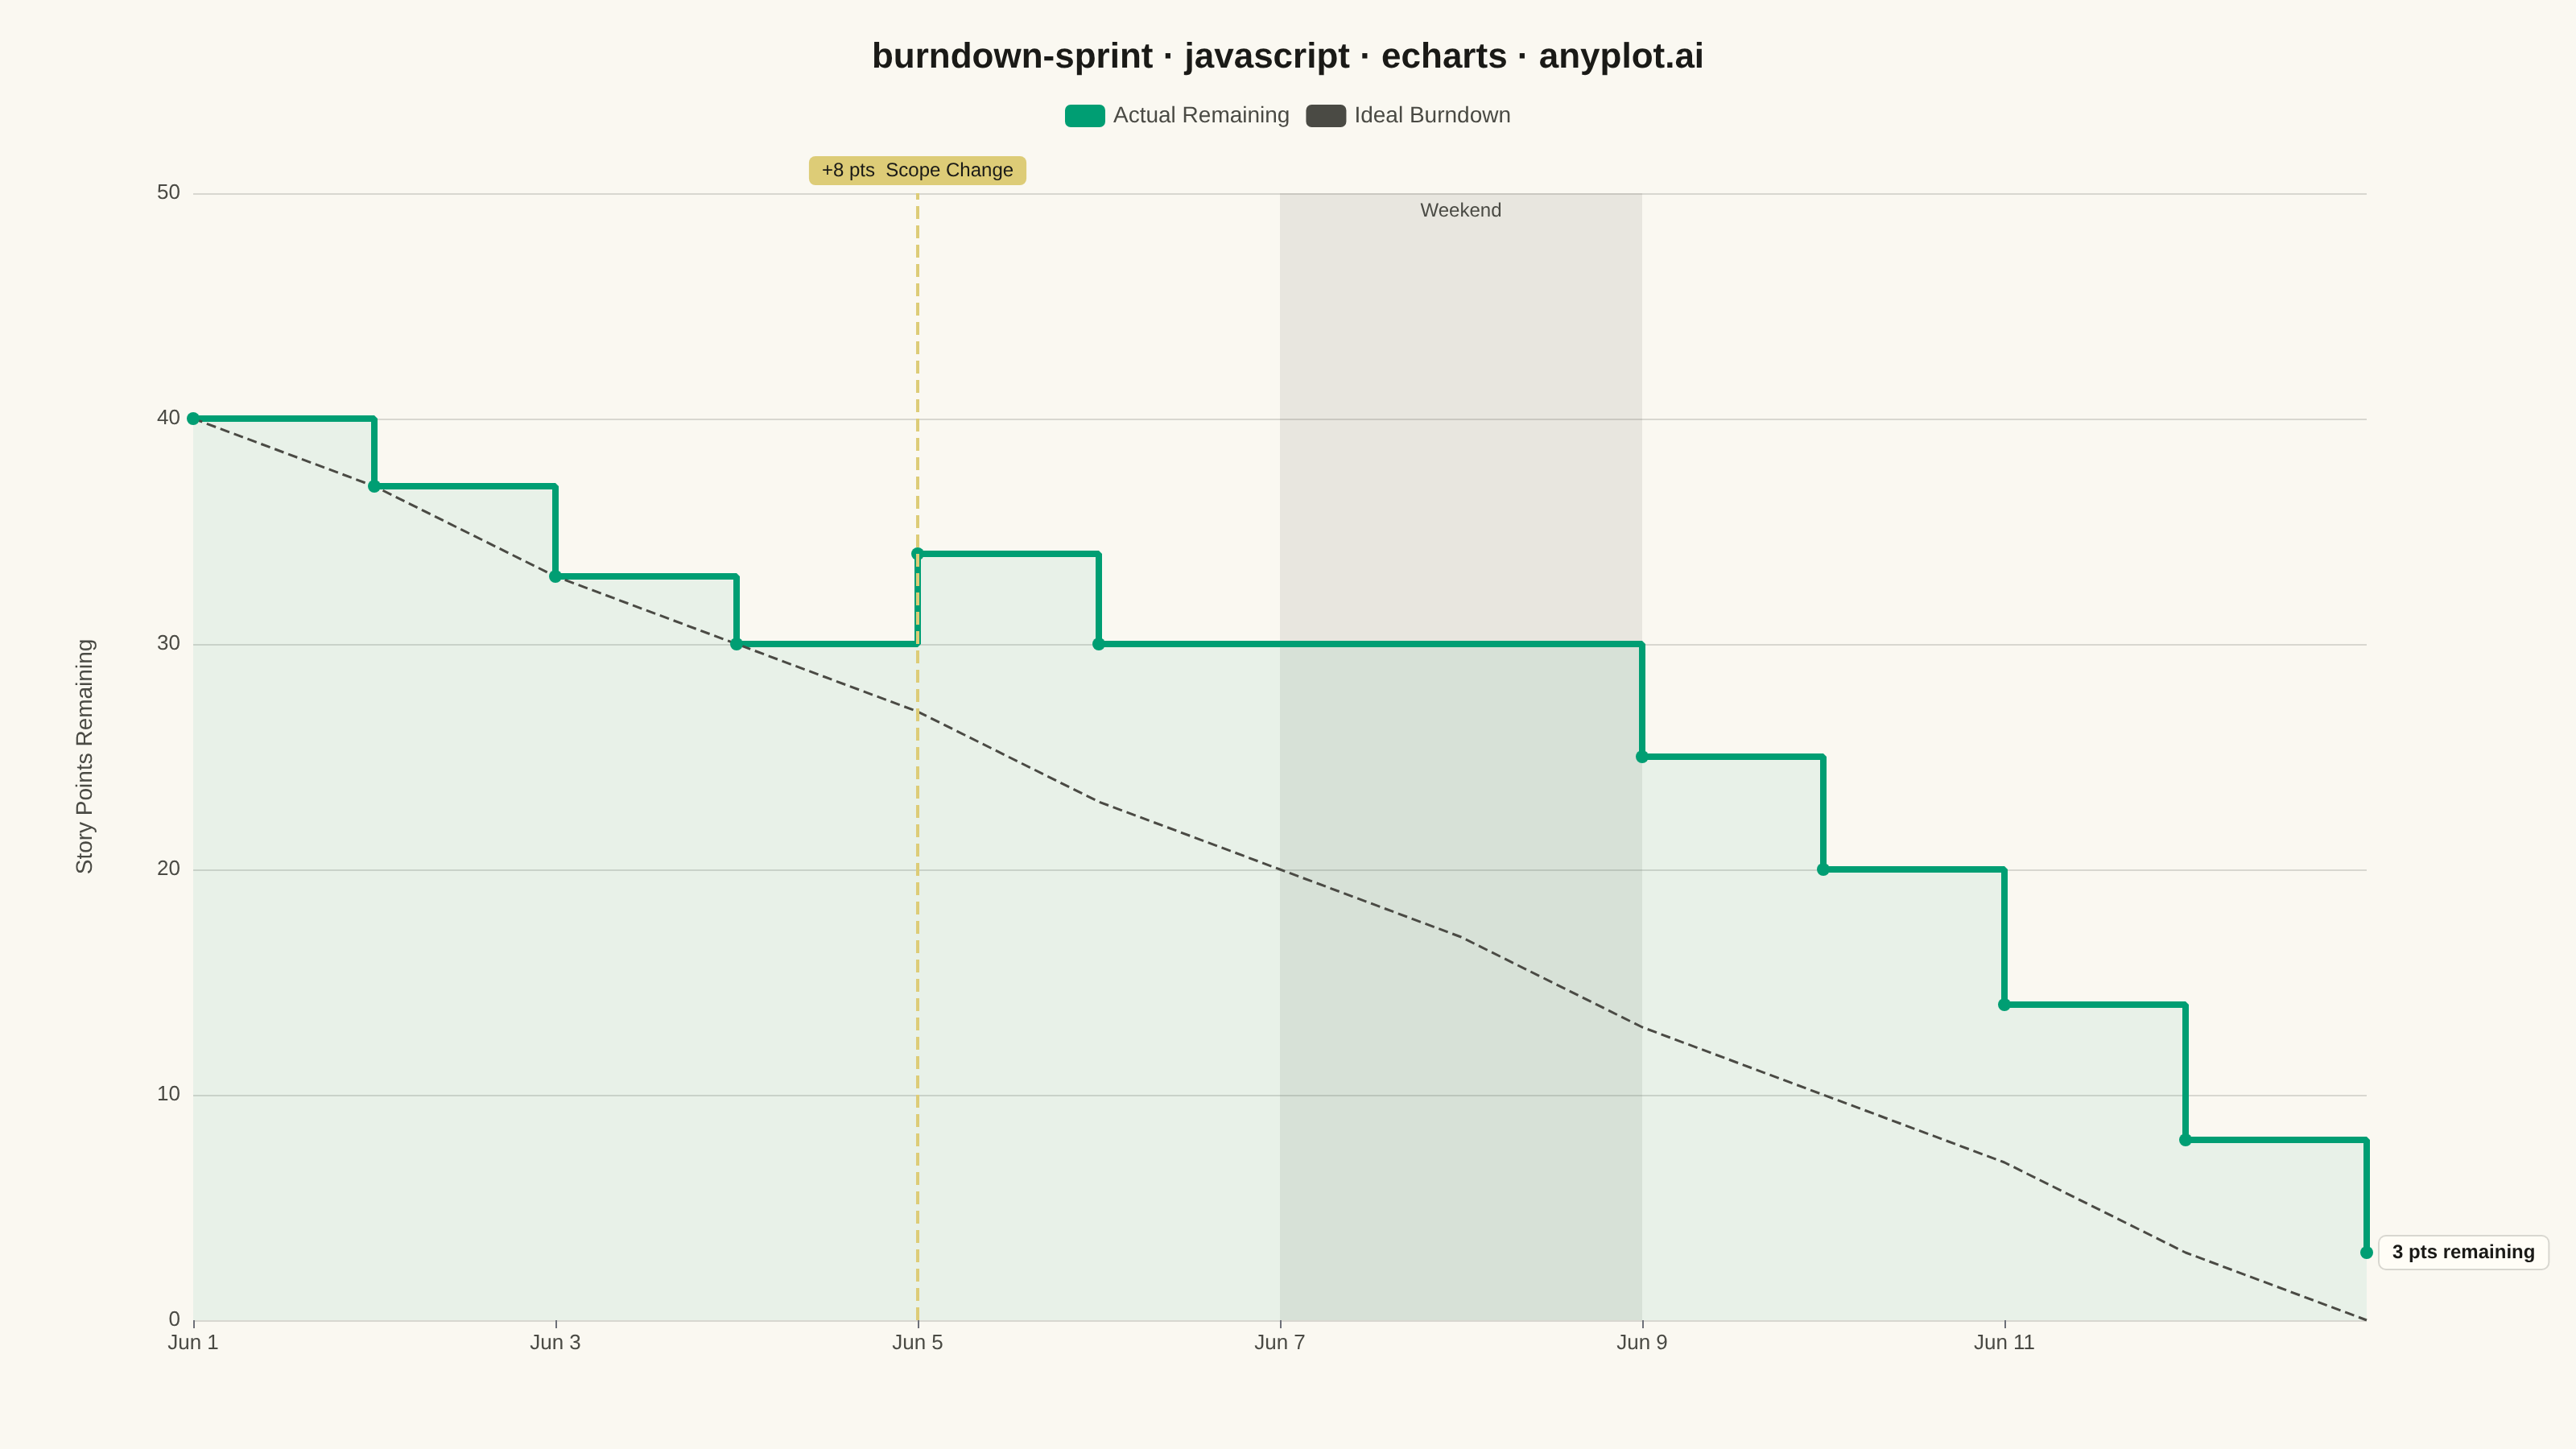
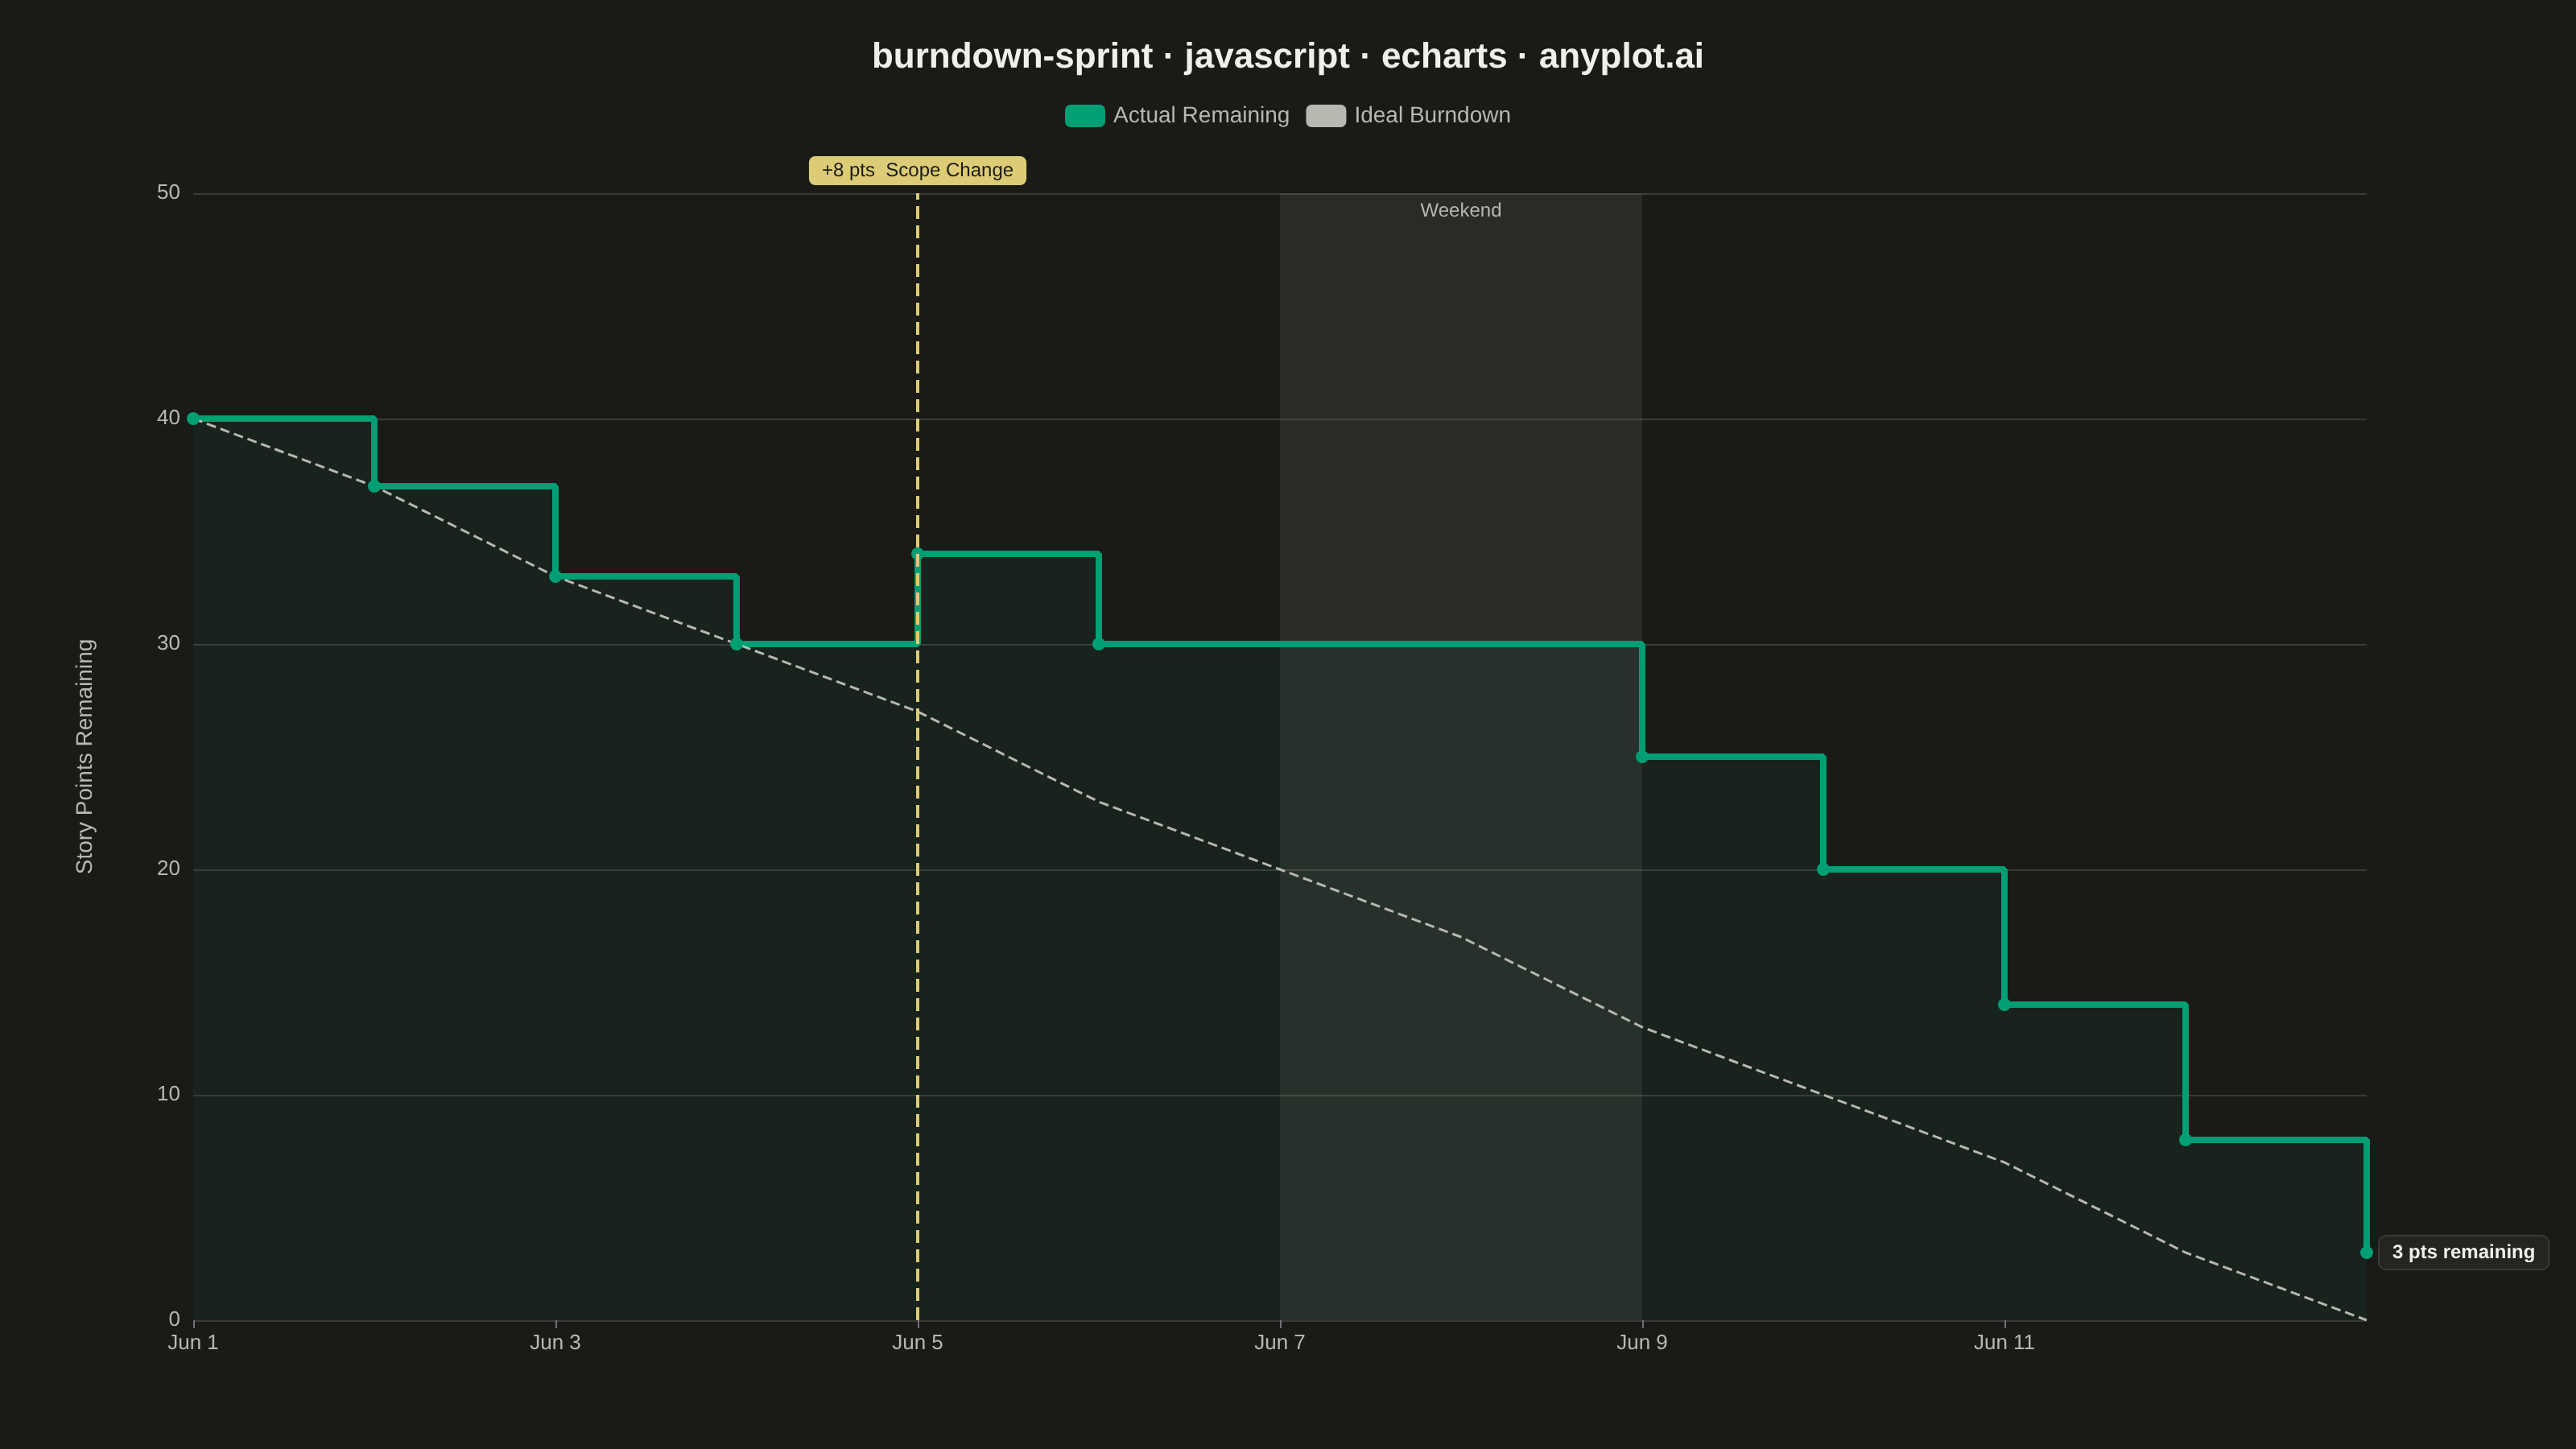
A sprint burndown chart tracks the amount of remaining work in an agile sprint over time, plotted as a step (or line) series that descends as tasks are completed. A straight ideal-burndown guideline runs diagonally from the total committed scope on day one down to zero on the final day, giving the team an at-a-glance reference for whether they are ahead of or behind schedule. It is one of the most widely used project-management visualizations in software development, surfacing scope creep, stalled progress, and end-of-sprint risk early enough to act on.
// anyplot.ai
// burndown-sprint: Agile Sprint Burndown Chart
// Library: echarts 5.5.1 | JavaScript 22.22.3
// Quality: 91/100 | Created: 2026-06-14
//# anyplot-orientation: landscape

const t = window.ANYPLOT_TOKENS;

// Sprint: June 1–13 2025, 10 working days, initial scope 40 story points
// Scope change: +8 points added on Thu Jun 5 (Day 4)
const ms = (s) => new Date(s).getTime();

const actual = [
  [ms('2025-06-01'), 40], // Sprint kick-off (committed scope)
  [ms('2025-06-02'), 37], // Mon Day 1: burned 3
  [ms('2025-06-03'), 33], // Tue Day 2: burned 4
  [ms('2025-06-04'), 30], // Wed Day 3: burned 3
  [ms('2025-06-05'), 34], // Thu Day 4: burned 4, +8 scope change added
  [ms('2025-06-06'), 30], // Fri Day 5: burned 4
  [ms('2025-06-09'), 25], // Mon Day 6: burned 5 (weekend flat at 30)
  [ms('2025-06-10'), 20], // Tue Day 7: burned 5
  [ms('2025-06-11'), 14], // Wed Day 8: burned 6
  [ms('2025-06-12'),  8], // Thu Day 9: burned 6
  [ms('2025-06-13'),  3], // Fri Day 10: burned 5 — sprint ends, 3 pts remain
];

// Ideal burndown: straight line from committed scope (40) to zero
const ideal = Array.from({ length: 13 }, (_, i) => {
  const day = new Date('2025-06-01');
  day.setDate(day.getDate() + i);
  return [day.getTime(), Math.round(40 * (12 - i) / 12)];
});

const chart = echarts.init(document.getElementById('container'));

chart.setOption({
  animation: false,
  color: t.palette,
  backgroundColor: 'transparent',

  title: {
    text: 'burndown-sprint · javascript · echarts · anyplot.ai',
    left: 'center',
    top: 20,
    textStyle: { color: t.ink, fontSize: 22, fontWeight: 'bold' },
  },

  legend: {
    top: 60,
    textStyle: { color: t.inkSoft, fontSize: 14 },
    icon: 'roundRect',
  },

  tooltip: {
    trigger: 'axis',
    backgroundColor: t.elevatedBg,
    borderColor: t.grid,
    textStyle: { color: t.ink, fontSize: 13 },
    axisPointer: { lineStyle: { color: t.inkSoft } },
    formatter: (params) => {
      const day = new Date(params[0].data[0]);
      const label = day.toLocaleDateString('en-US', { weekday: 'short', month: 'short', day: 'numeric' });
      const rows = params
        .filter((p) => p.data && p.data.length > 1 && p.data[1] != null)
        .map((p) => `${p.marker} ${p.seriesName}: <b>${p.data[1]} pts</b>`);
      return `${label}<br/>${rows.join('<br/>')}`;
    },
  },

  grid: { left: 120, right: 130, top: 120, bottom: 80 },

  xAxis: {
    type: 'time',
    min: ms('2025-06-01'),
    max: ms('2025-06-13'),
    axisLabel: {
      color: t.inkSoft,
      fontSize: 13,
      formatter: (val) =>
        new Date(val).toLocaleDateString('en-US', { month: 'short', day: 'numeric' }),
    },
    axisLine: { show: false },
    splitLine: { show: false },
  },

  yAxis: {
    type: 'value',
    name: 'Story Points Remaining',
    nameLocation: 'middle',
    nameRotate: 90,
    nameGap: 60,
    nameTextStyle: { color: t.inkSoft, fontSize: 14 },
    min: 0,
    max: 50,
    axisLabel: { color: t.inkSoft, fontSize: 13 },
    axisLine: { show: false },
    splitLine: { lineStyle: { color: t.grid } },
  },

  series: [
    {
      name: 'Actual Remaining',
      type: 'line',
      step: 'end',
      data: actual,
      itemStyle: { color: t.palette[0] },
      lineStyle: { color: t.palette[0], width: 4 },
      symbol: 'circle',
      symbolSize: 8,
      areaStyle: { color: t.palette[0], opacity: 0.07 },
      // Sprint outcome callout — tells the story at a glance
      endLabel: {
        show: true,
        formatter: '3 pts remaining',
        color: t.ink,
        fontSize: 12,
        fontWeight: 'bold',
        distance: 8,
        backgroundColor: t.elevatedBg,
        borderColor: t.grid,
        borderWidth: 1,
        padding: [4, 8],
        borderRadius: 4,
      },
      markArea: {
        silent: true,
        itemStyle: { color: t.inkSoft, opacity: 0.10 },
        label: {
          show: true,
          position: 'insideTop',
          color: t.inkSoft,
          fontSize: 12,
          formatter: 'Weekend',
        },
        data: [[{ xAxis: ms('2025-06-07') }, { xAxis: ms('2025-06-09') }]],
      },
      markLine: {
        silent: true,
        symbol: ['none', 'none'],
        lineStyle: { color: t.amber, width: 2, type: 'dashed' },
        // Amber badge (dark ink on amber bg) — high contrast on both light and dark themes
        label: {
          show: true,
          formatter: '{badge|+8 pts  Scope Change}',
          rich: {
            badge: {
              color: '#1A1A17',
              backgroundColor: '#DDCC77',
              borderRadius: 4,
              padding: [3, 8, 3, 8],
              fontSize: 12,
            },
          },
          position: 'end',
        },
        data: [{ xAxis: ms('2025-06-05'), name: 'Scope Change' }],
      },
    },
    {
      name: 'Ideal Burndown',
      type: 'line',
      data: ideal,
      itemStyle: { color: t.inkSoft },
      lineStyle: { color: t.inkSoft, width: 1.5, type: 'dashed' },
      symbol: 'none',
    },
  ],
});
Runnable source as JSON, for any HTTP client: https://api.anyplot.ai/specs/burndown-sprint/echarts/code. Any spec id and library id listed in llms-full.txt fit the same URL shape; every URL below is complete and callable.
{
  "spec_id": "burndown-sprint",
  "language": "javascript",
  "library": "echarts",
  "page": "https://anyplot.ai/burndown-sprint/javascript/echarts",
  "hub": "https://anyplot.ai/burndown-sprint",
  "code_json": "https://api.anyplot.ai/specs/burndown-sprint/echarts/code",
  "spec_json": "https://api.anyplot.ai/specs/burndown-sprint",
  "render_light_png": "https://storage.googleapis.com/anyplot-images/plots/burndown-sprint/javascript/echarts/plot-light.png",
  "render_dark_png": "https://storage.googleapis.com/anyplot-images/plots/burndown-sprint/javascript/echarts/plot-dark.png",
  "interactive_light_html": "https://storage.googleapis.com/anyplot-images/plots/burndown-sprint/javascript/echarts/plot-light.html",
  "interactive_dark_html": "https://storage.googleapis.com/anyplot-images/plots/burndown-sprint/javascript/echarts/plot-dark.html",
  "quality_score": 91.0,
  "license": "MIT",
  "guide": "https://anyplot.ai/llms.txt"
}
Part of Agile Sprint Burndown Chart on anyplot.ai.