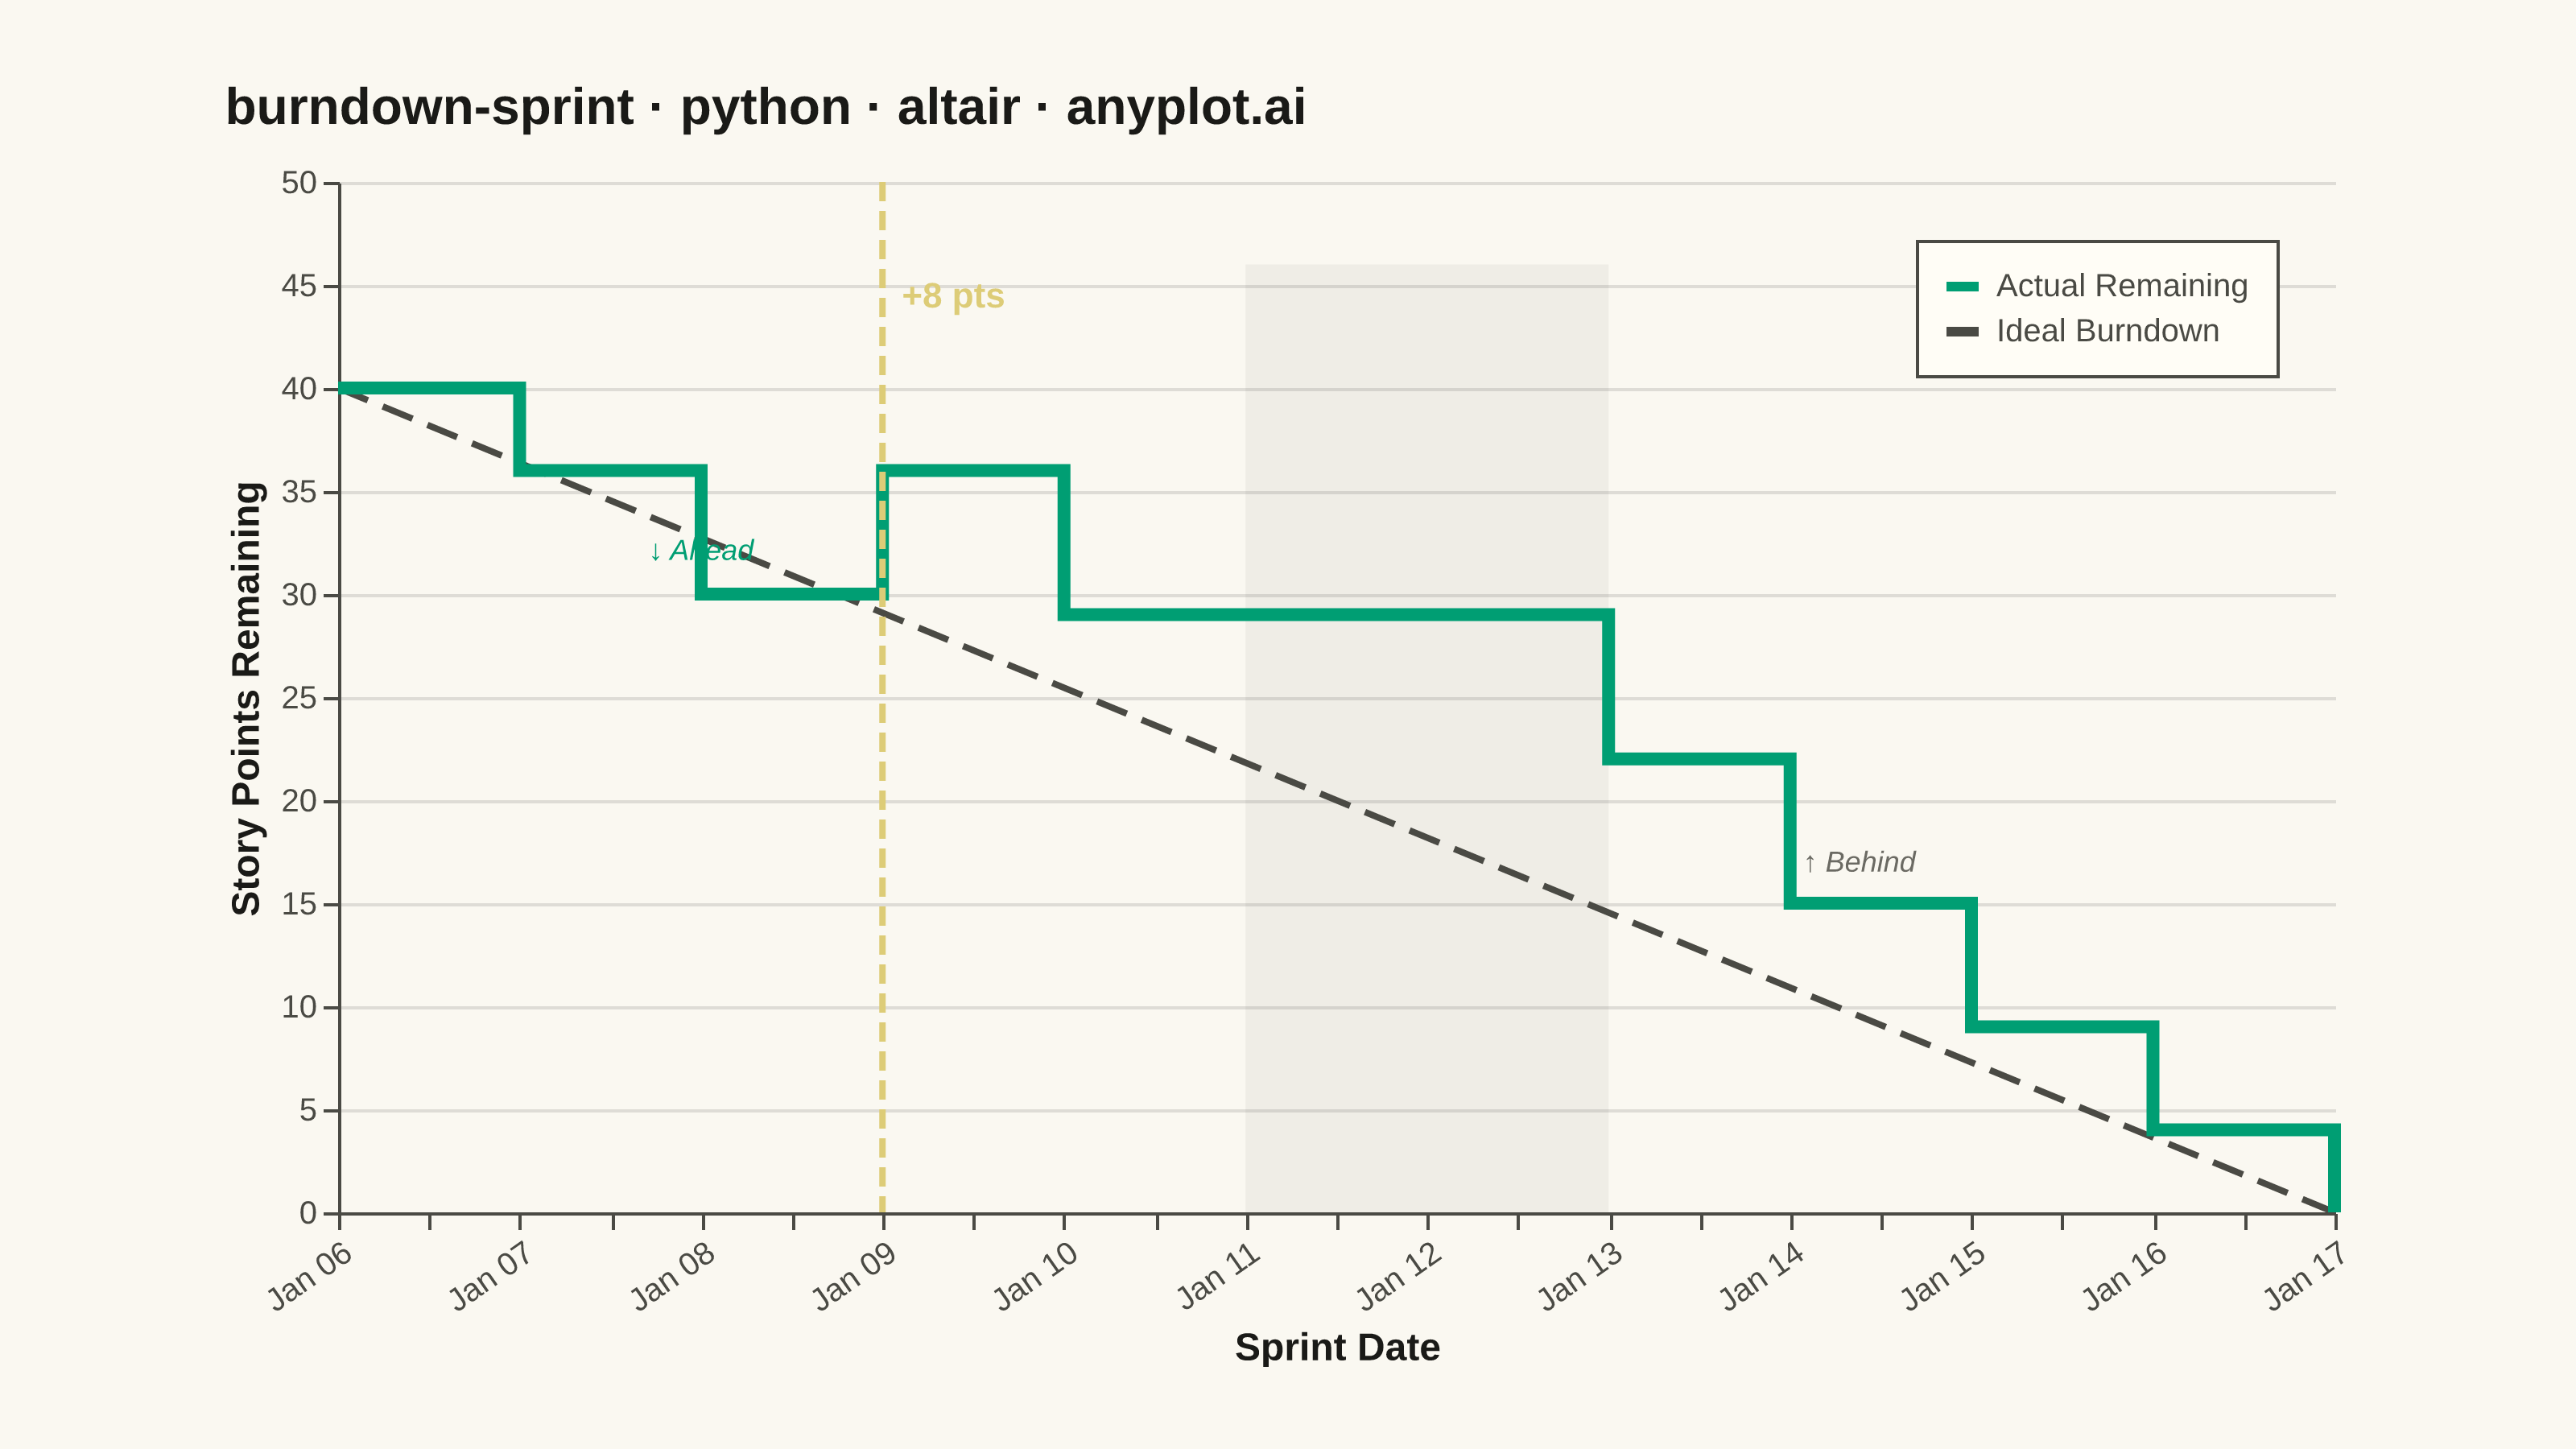
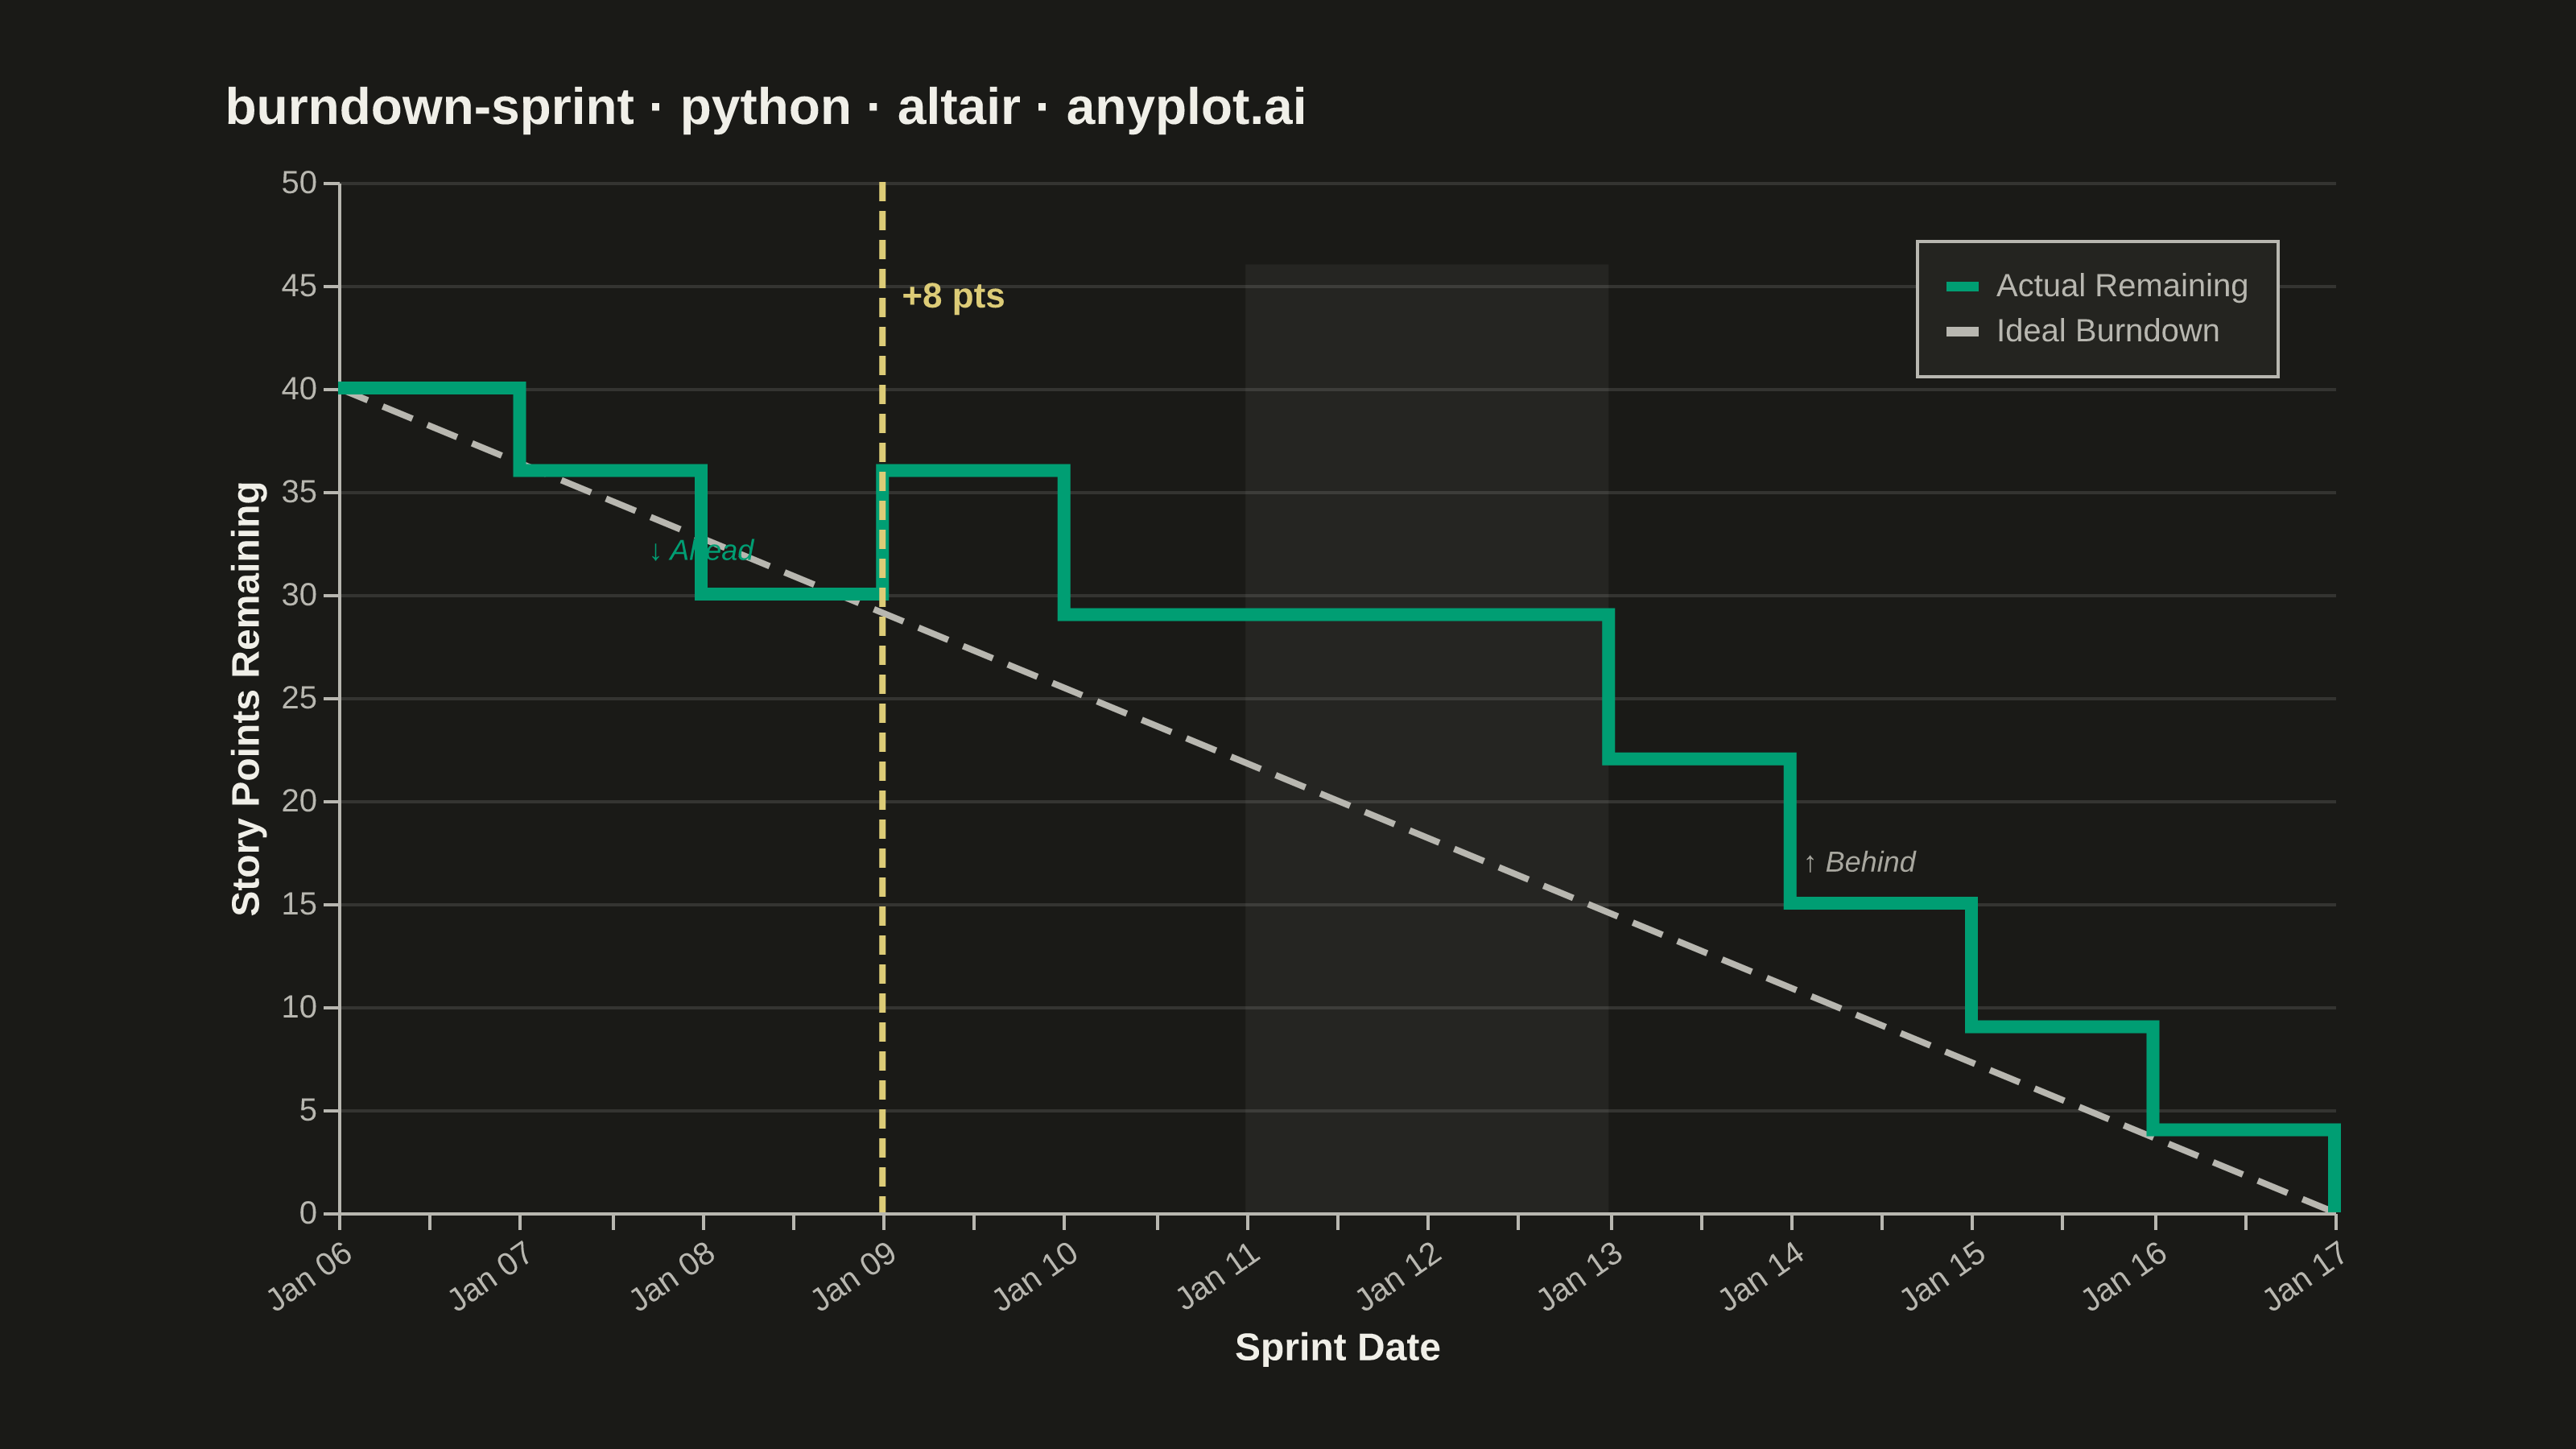
A sprint burndown chart tracks the amount of remaining work in an agile sprint over time, plotted as a step (or line) series that descends as tasks are completed. A straight ideal-burndown guideline runs diagonally from the total committed scope on day one down to zero on the final day, giving the team an at-a-glance reference for whether they are ahead of or behind schedule. It is one of the most widely used project-management visualizations in software development, surfacing scope creep, stalled progress, and end-of-sprint risk early enough to act on.
""" anyplot.ai
burndown-sprint: Agile Sprint Burndown Chart
Library: altair 6.2.1 | Python 3.13.13
Quality: 91/100 | Created: 2026-06-14
"""

import os
import sys


# Prevent self-import: the script is named altair.py, which shadows the library
_script_dir = os.path.dirname(os.path.abspath(__file__))
sys.path = [p for p in sys.path if os.path.abspath(p) != _script_dir]

import altair as alt
import pandas as pd
from PIL import Image


# Theme tokens (see prompts/default-style-guide.md)
THEME = os.getenv("ANYPLOT_THEME", "light")
PAGE_BG = "#FAF8F1" if THEME == "light" else "#1A1A17"
ELEVATED_BG = "#FFFDF6" if THEME == "light" else "#242420"
INK = "#1A1A17" if THEME == "light" else "#F0EFE8"
INK_SOFT = "#4A4A44" if THEME == "light" else "#B8B7B0"
INK_MUTED = "#6B6A63" if THEME == "light" else "#A8A79F"
ANYPLOT_AMBER = "#DDCC77"  # Imprint amber — scope change warning

BRAND = "#009E73"  # Imprint palette position 1 — actual remaining (first series)

# Data — 10-working-day sprint Jan 6–17 2025; +8 pt scope change on Jan 9 (Thu)
# Story: team starts at 40 pts, burns down well, scope jumps on day 4, recovers to finish at 0
sprint_dates = pd.to_datetime(
    [
        "2025-01-06",
        "2025-01-07",
        "2025-01-08",
        "2025-01-09",
        "2025-01-10",
        "2025-01-11",
        "2025-01-12",
        "2025-01-13",
        "2025-01-14",
        "2025-01-15",
        "2025-01-16",
        "2025-01-17",
    ]
)
actual_pts = [40, 36, 30, 36, 29, 29, 29, 22, 15, 9, 4, 0]

df_actual = pd.DataFrame({"date": sprint_dates, "remaining": actual_pts, "series": "Actual Remaining"})
df_ideal = pd.DataFrame(
    {"date": pd.to_datetime(["2025-01-06", "2025-01-17"]), "remaining": [40, 0], "series": "Ideal Burndown"}
)
weekend_bands = pd.DataFrame(
    {"start": pd.to_datetime(["2025-01-11"]), "end": pd.to_datetime(["2025-01-13"]), "top": [46.0], "bottom": [0.0]}
)
scope_df = pd.DataFrame({"date": pd.to_datetime(["2025-01-09"]), "label": ["+8 pts"]})

# Shared color scale — actual (green first series) vs ideal (muted)
color_scale = alt.Scale(domain=["Actual Remaining", "Ideal Burndown"], range=[BRAND, INK_SOFT])
series_legend = alt.Legend(title=None, symbolType="stroke", symbolStrokeWidth=3, labelFontSize=10)

y_scale = alt.Scale(domain=[0, 46])
x_axis = alt.Axis(format="%b %d", labelAngle=-35, title="Sprint Date")
y_axis = alt.Axis(title="Story Points Remaining")

# Weekend shading using data coordinates — spans full y-range unobtrusively
weekend_layer = (
    alt.Chart(weekend_bands)
    .mark_rect(opacity=0.08, color=INK_MUTED)
    .encode(x="start:T", x2="end:T", y="top:Q", y2="bottom:Q")
)

# Ideal burndown — straight dashed diagonal reference line
ideal_layer = (
    alt.Chart(df_ideal)
    .mark_line(strokeDash=[10, 5], strokeWidth=2)
    .encode(
        x=alt.X("date:T", axis=x_axis),
        y=alt.Y("remaining:Q", scale=y_scale, axis=y_axis),
        color=alt.Color("series:N", scale=color_scale, legend=series_legend),
    )
)

# Actual remaining — step-after series (work done in discrete chunks)
actual_layer = (
    alt.Chart(df_actual)
    .mark_line(interpolate="step-after", strokeWidth=4)
    .encode(
        x=alt.X("date:T", axis=x_axis),
        y=alt.Y("remaining:Q", scale=y_scale, axis=y_axis),
        color=alt.Color("series:N", scale=color_scale, legend=series_legend),
        tooltip=[
            alt.Tooltip("date:T", title="Date", format="%b %d"),
            alt.Tooltip("remaining:Q", title="Pts Remaining"),
        ],
    )
)

# Scope change: amber dashed vertical rule + label
scope_rule = alt.Chart(scope_df).mark_rule(strokeDash=[6, 3], strokeWidth=2, color=ANYPLOT_AMBER).encode(x="date:T")
scope_label = (
    alt.Chart(scope_df)
    .mark_text(align="left", dx=6, baseline="top", color=ANYPLOT_AMBER, fontSize=11, fontWeight="bold")
    .encode(x="date:T", y=alt.value(30), text="label:N")
)

# Ahead/behind schedule annotations — makes the reading explicit per spec
# Team is briefly ahead Jan 07–08 (actual < ideal), then behind after scope jump
ahead_df = pd.DataFrame({"date": pd.to_datetime(["2025-01-08"]), "remaining": [31.5], "label": ["↓ Ahead"]})
ahead_annotation = (
    alt.Chart(ahead_df)
    .mark_text(align="center", dy=-4, fontSize=9, color=BRAND, fontStyle="italic")
    .encode(x="date:T", y=alt.Y("remaining:Q", scale=y_scale), text="label:N")
)
behind_df = pd.DataFrame({"date": pd.to_datetime(["2025-01-14"]), "remaining": [17.0], "label": ["↑ Behind"]})
behind_annotation = (
    alt.Chart(behind_df)
    .mark_text(align="left", dx=4, fontSize=9, color=INK_MUTED, fontStyle="italic")
    .encode(x="date:T", y=alt.Y("remaining:Q", scale=y_scale), text="label:N")
)

# Compose and configure
title_str = "burndown-sprint · python · altair · anyplot.ai"

chart = (
    alt.layer(weekend_layer, ideal_layer, actual_layer, scope_rule, scope_label, ahead_annotation, behind_annotation)
    .properties(
        width=620,
        height=320,
        background=PAGE_BG,
        padding={"left": 0, "right": 0, "top": 0, "bottom": 0},
        title=alt.Title(text=title_str, fontSize=16, color=INK, anchor="start", offset=10),
    )
    .configure_view(fill=PAGE_BG, stroke=None, continuousWidth=620, continuousHeight=320)
    .configure_axisX(
        domainColor=INK_SOFT,
        tickColor=INK_SOFT,
        grid=False,
        labelColor=INK_SOFT,
        labelFontSize=10,
        titleColor=INK,
        titleFontSize=12,
    )
    .configure_axisY(
        domainColor=INK_SOFT,
        tickColor=INK_SOFT,
        gridColor=INK,
        gridOpacity=0.12,
        labelColor=INK_SOFT,
        labelFontSize=10,
        titleColor=INK,
        titleFontSize=12,
    )
    .configure_title(color=INK, fontSize=16)
    .configure_legend(
        fillColor=ELEVATED_BG,
        strokeColor=INK_SOFT,
        labelColor=INK_SOFT,
        labelFontSize=10,
        orient="top-right",
        padding=8,
    )
)

# Save PNG
chart.save(f"plot-{THEME}.png", scale_factor=4.0)

# Pad to exact 3200×1800 (vl-convert may undershoot)
TW, TH = 3200, 1800
_img = Image.open(f"plot-{THEME}.png").convert("RGB")
_w, _h = _img.size
if _w > TW or _h > TH:
    raise SystemExit(
        f"altair vl-convert produced {_w}×{_h}, exceeds target {TW}×{TH}. "
        f"Shrink chart .properties(width=, height=) values and re-render."
    )
if _w < TW or _h < TH:
    _canvas = Image.new("RGB", (TW, TH), PAGE_BG)
    _canvas.paste(_img, ((TW - _w) // 2, (TH - _h) // 2))
    _canvas.save(f"plot-{THEME}.png")

# Save HTML (interactive)
chart.save(f"plot-{THEME}.html")
Runnable source as JSON, for any HTTP client: https://api.anyplot.ai/specs/burndown-sprint/altair/code. Any spec id and library id listed in llms-full.txt fit the same URL shape; every URL below is complete and callable.
{
  "spec_id": "burndown-sprint",
  "language": "python",
  "library": "altair",
  "page": "https://anyplot.ai/burndown-sprint/python/altair",
  "hub": "https://anyplot.ai/burndown-sprint",
  "code_json": "https://api.anyplot.ai/specs/burndown-sprint/altair/code",
  "spec_json": "https://api.anyplot.ai/specs/burndown-sprint",
  "render_light_png": "https://storage.googleapis.com/anyplot-images/plots/burndown-sprint/python/altair/plot-light.png",
  "render_dark_png": "https://storage.googleapis.com/anyplot-images/plots/burndown-sprint/python/altair/plot-dark.png",
  "interactive_light_html": "https://storage.googleapis.com/anyplot-images/plots/burndown-sprint/python/altair/plot-light.html",
  "interactive_dark_html": "https://storage.googleapis.com/anyplot-images/plots/burndown-sprint/python/altair/plot-dark.html",
  "quality_score": 91.0,
  "license": "MIT",
  "guide": "https://anyplot.ai/llms.txt"
}
Part of Agile Sprint Burndown Chart on anyplot.ai.