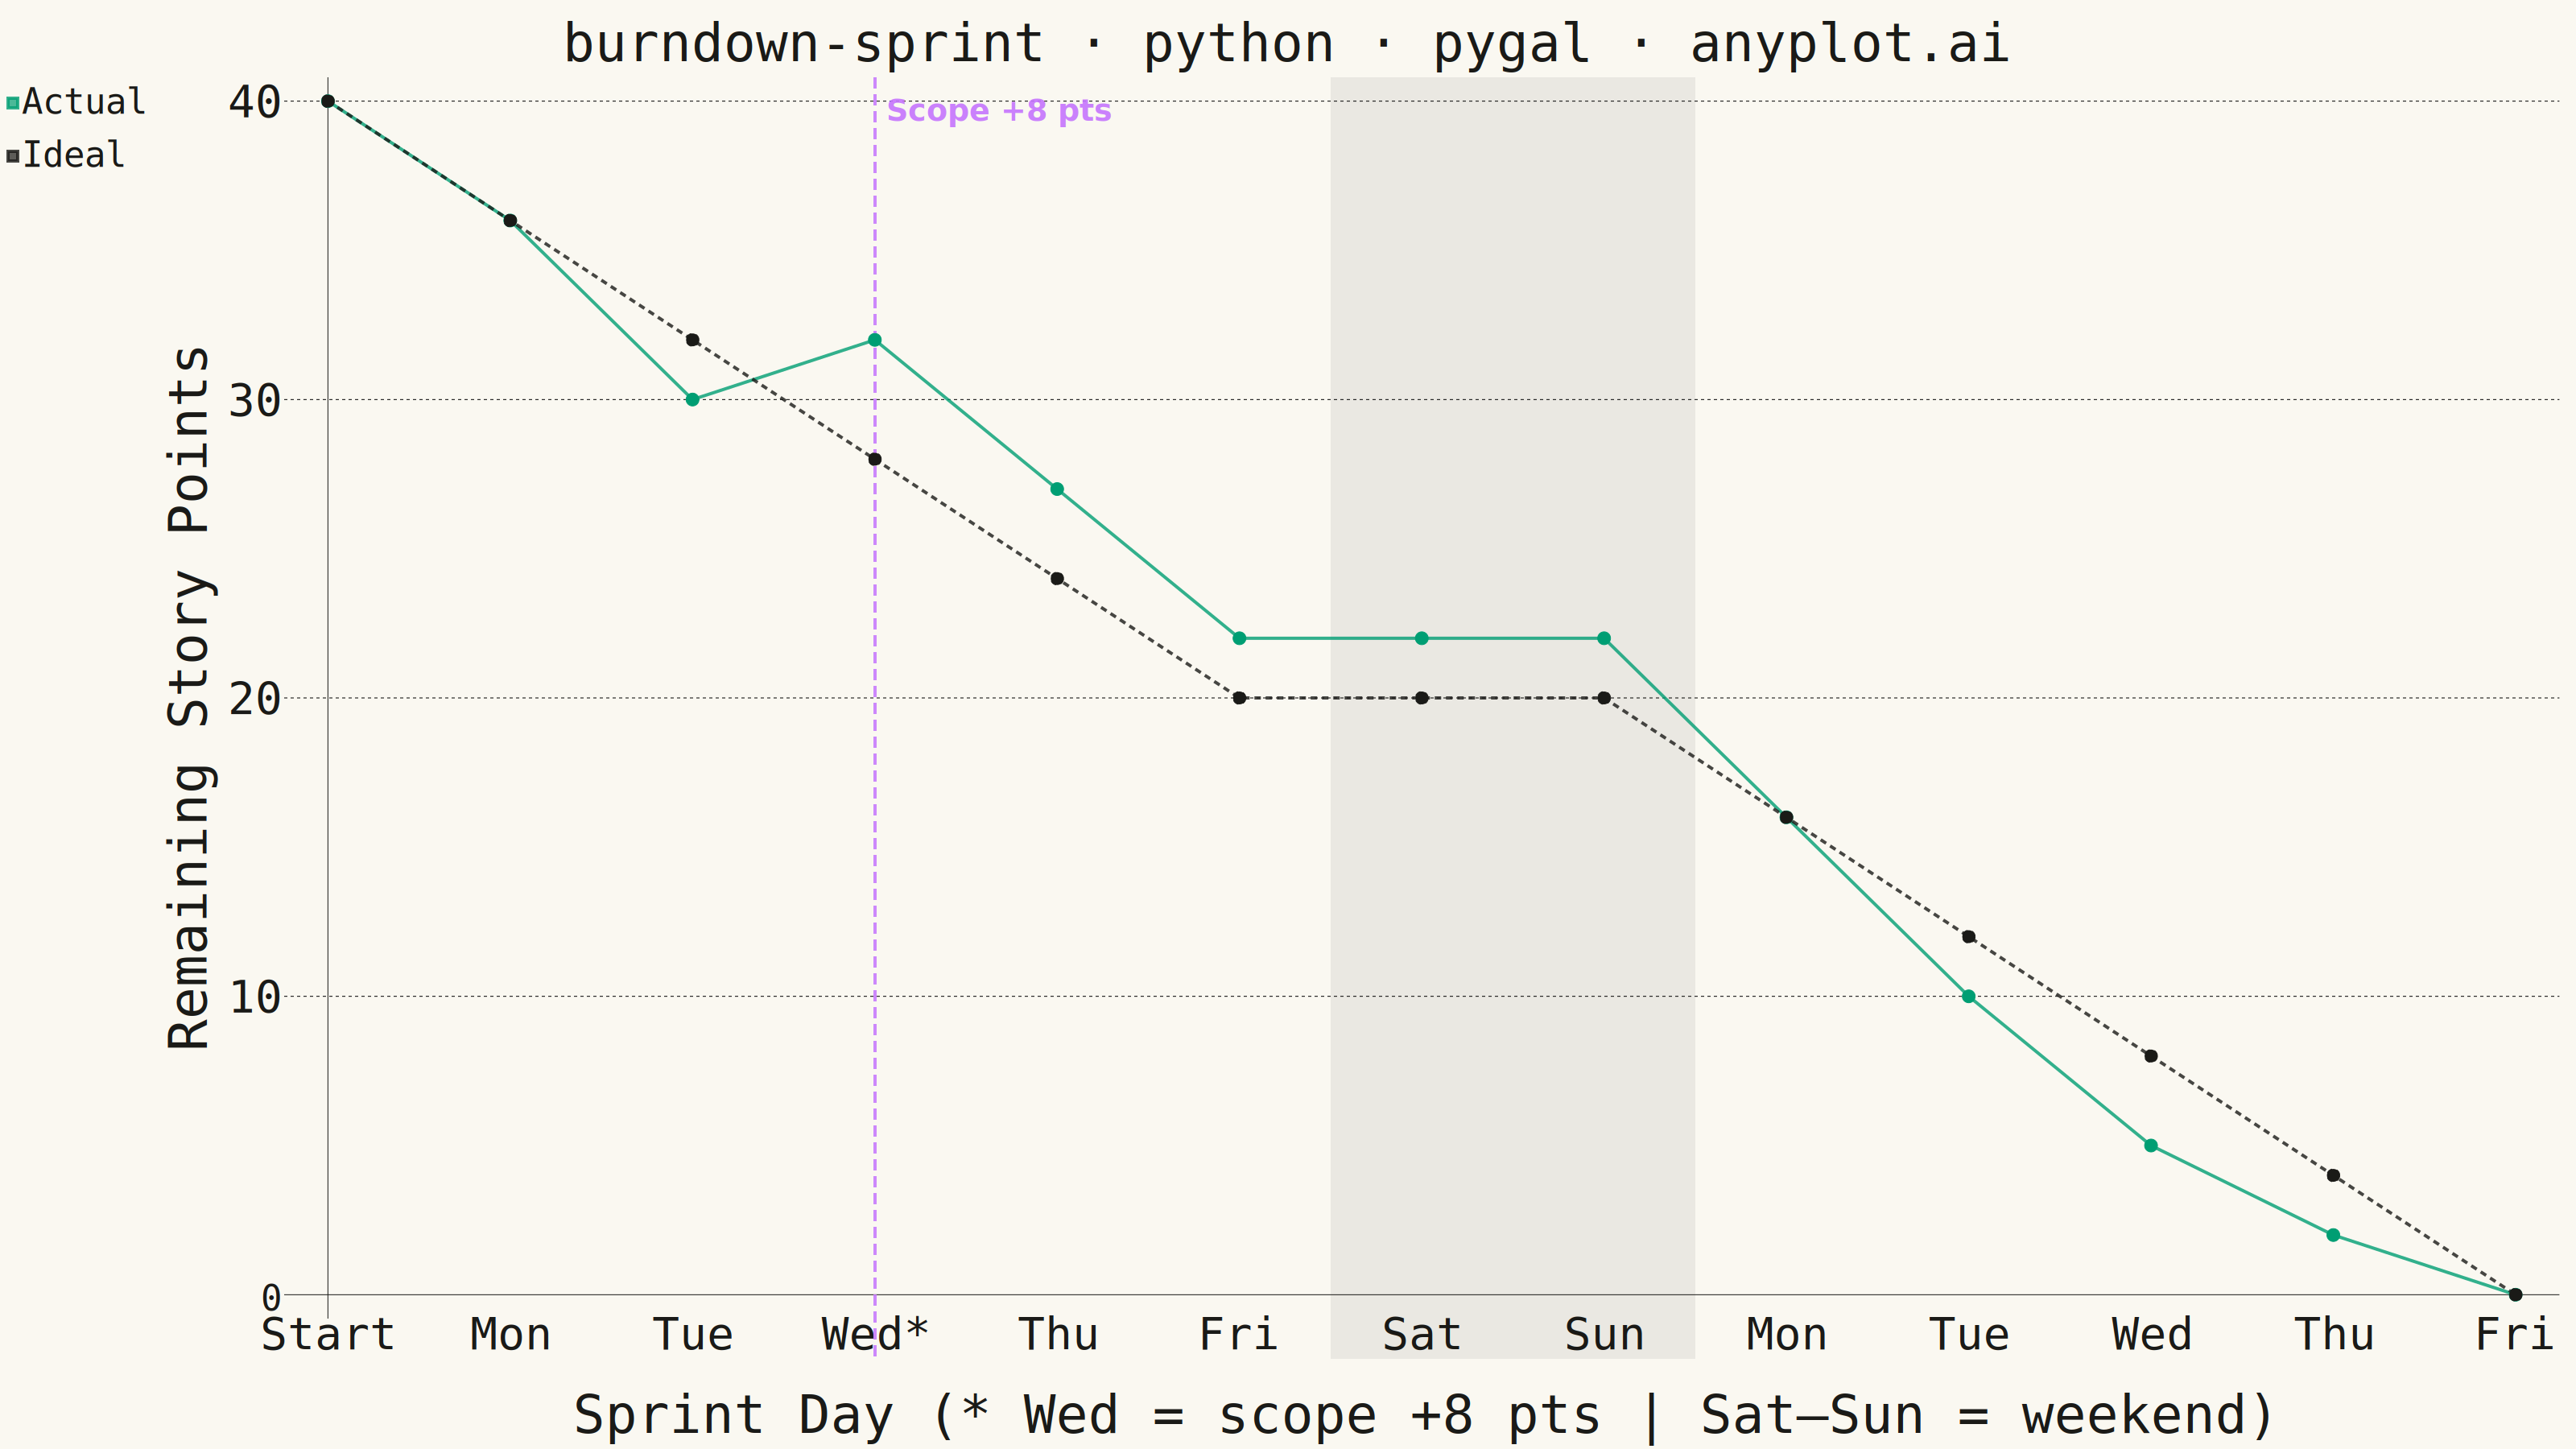
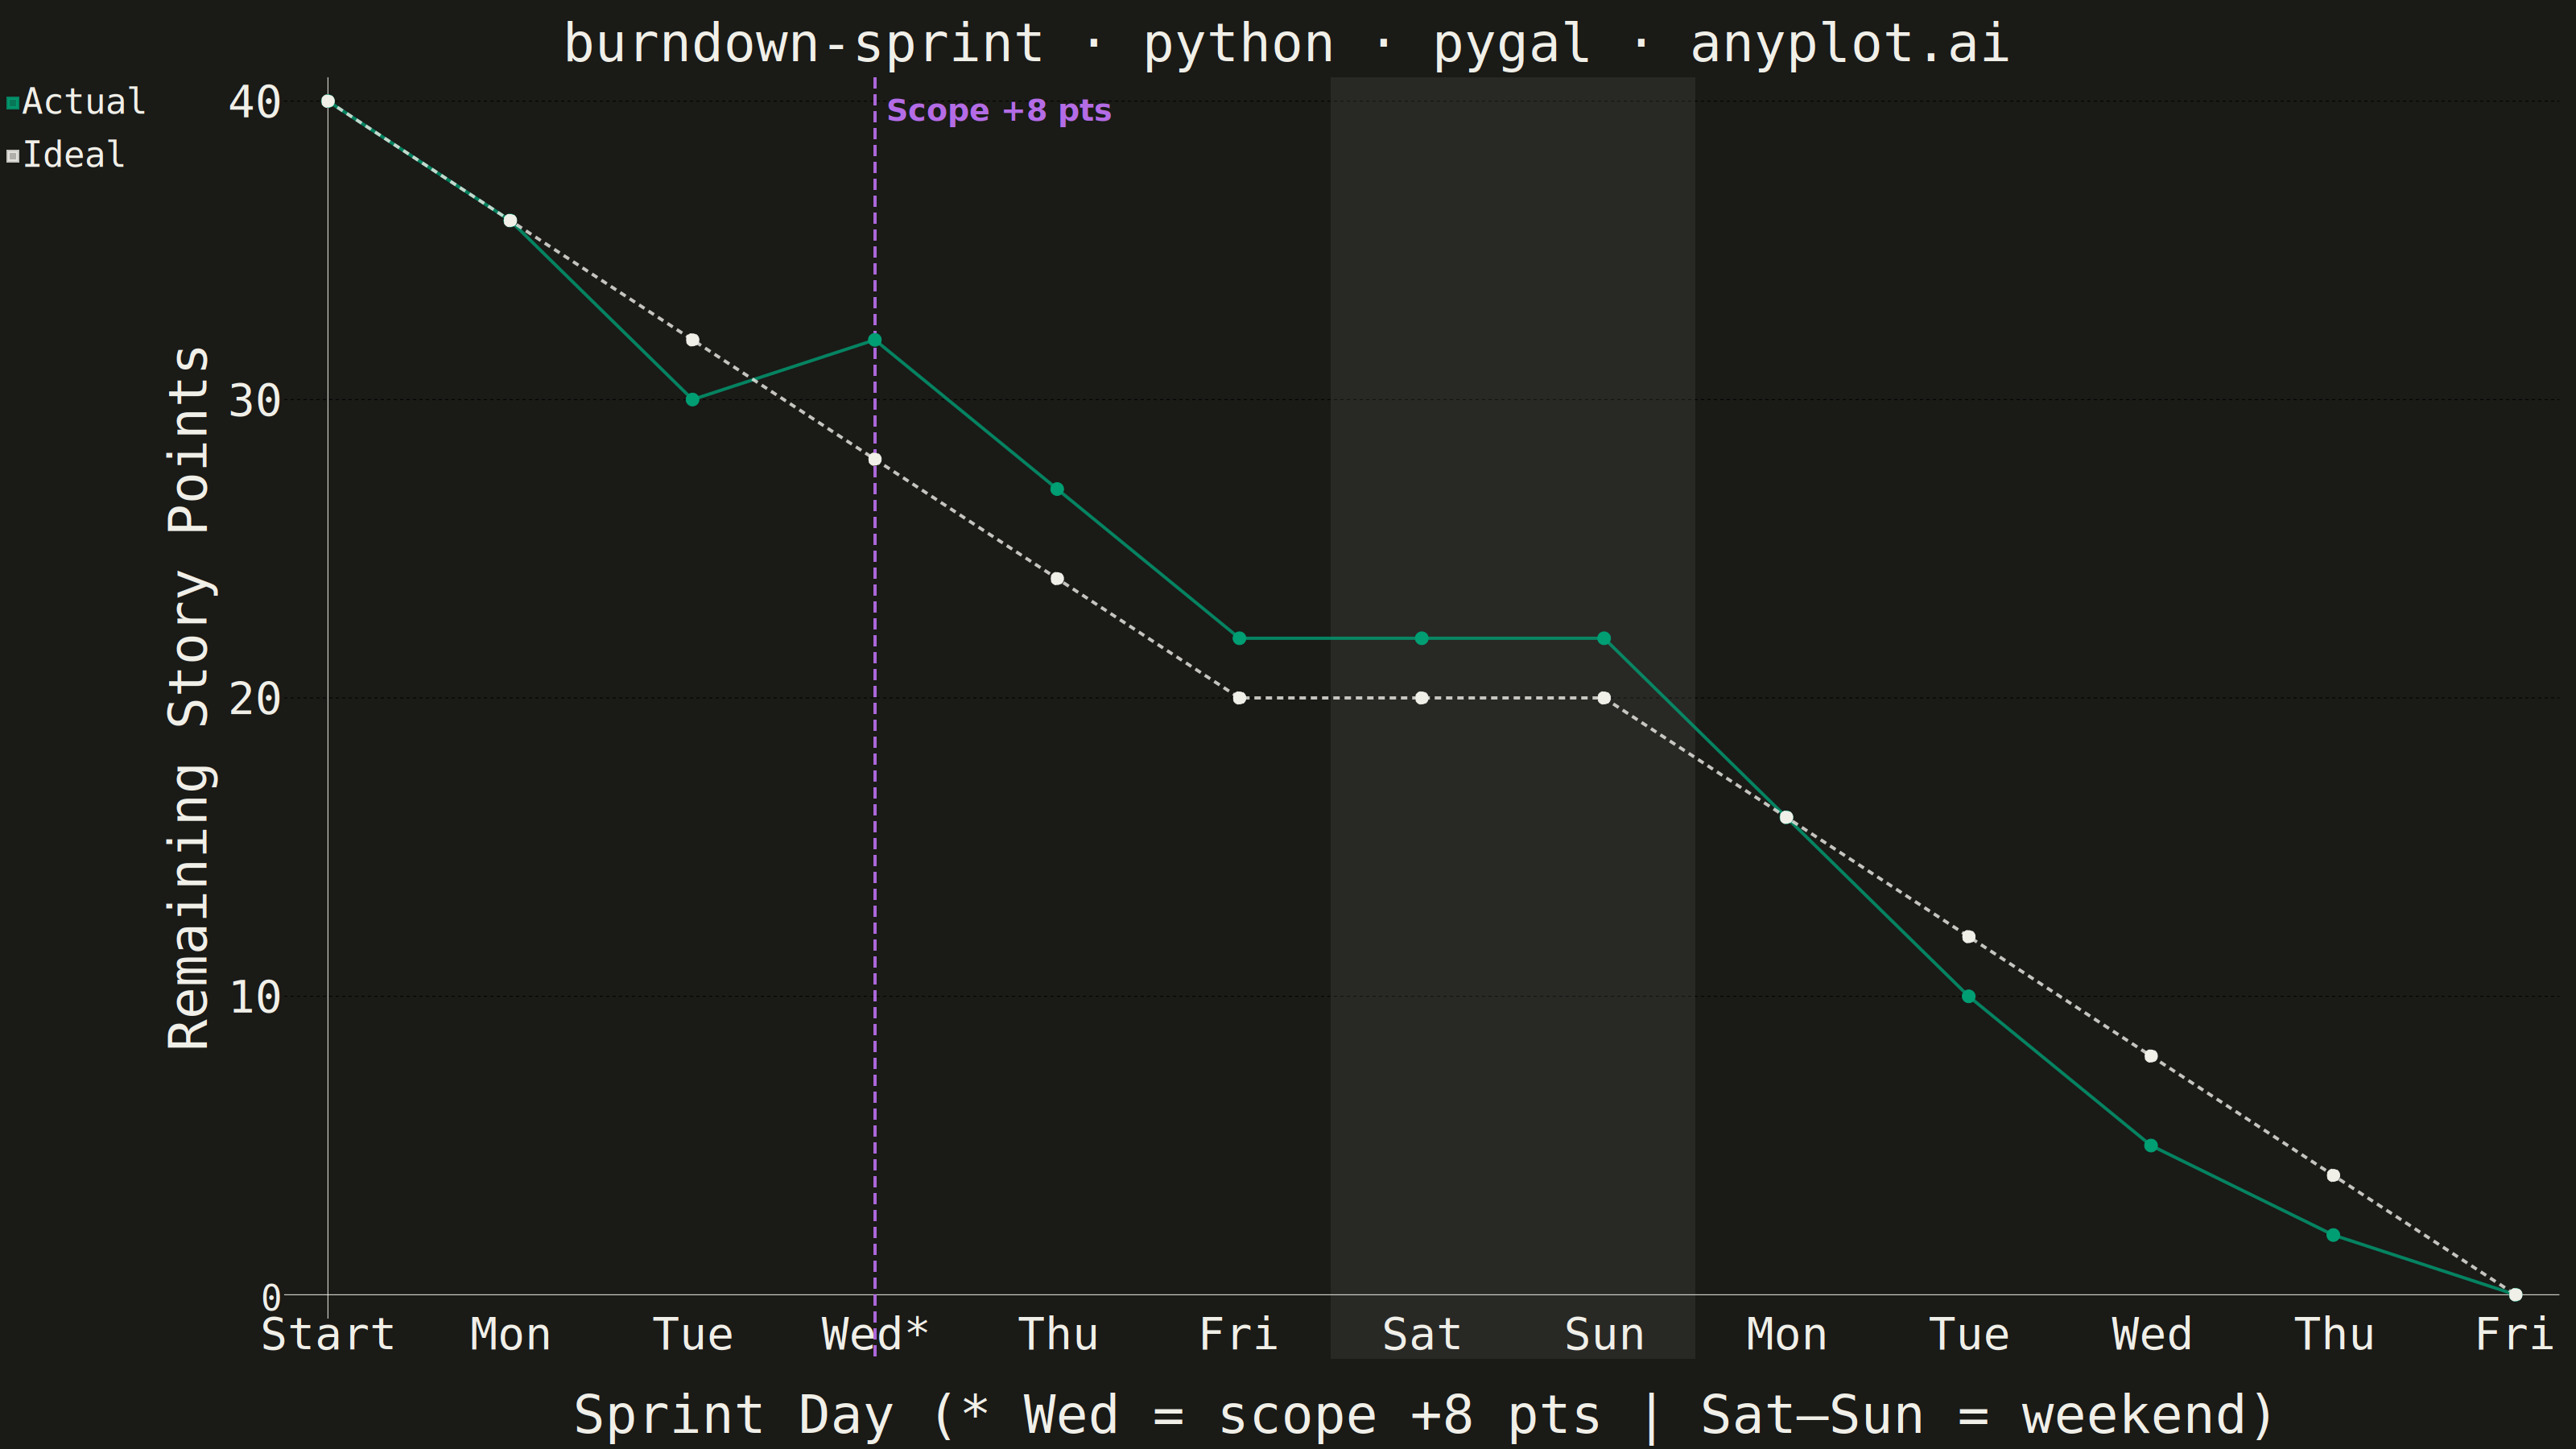
A sprint burndown chart tracks the amount of remaining work in an agile sprint over time, plotted as a step (or line) series that descends as tasks are completed. A straight ideal-burndown guideline runs diagonally from the total committed scope on day one down to zero on the final day, giving the team an at-a-glance reference for whether they are ahead of or behind schedule. It is one of the most widely used project-management visualizations in software development, surfacing scope creep, stalled progress, and end-of-sprint risk early enough to act on.
""" anyplot.ai
burndown-sprint: Agile Sprint Burndown Chart
Library: pygal 3.1.0 | Python 3.13.13
Quality: 87/100 | Created: 2026-06-14
"""

import os
import re
import sys


# Remove script directory from sys.path to avoid self-import (file is named pygal.py)
_here = os.path.dirname(os.path.abspath(__file__))
if _here in sys.path:
    sys.path.remove(_here)

import cairosvg
import pygal
from pygal.style import Style


# Theme tokens — Imprint palette, theme-adaptive chrome
THEME = os.getenv("ANYPLOT_THEME", "light")
PAGE_BG = "#FAF8F1" if THEME == "light" else "#1A1A17"
INK = "#1A1A17" if THEME == "light" else "#F0EFE8"
INK_MUTED = "#6B6A63" if THEME == "light" else "#A8A79F"
WEEKEND_FILL = INK  # subtle non-working-day band
SCOPE_COLOR = "#C475FD"  # Imprint violet — scope-change annotation

IMPRINT_PALETTE = ("#009E73", "#C475FD", "#4467A3", "#BD8233", "#AE3030", "#2ABCCD", "#954477", "#99B314")
ANYPLOT_NEUTRAL = INK  # reference lines / baseline (theme-adaptive)

title = "burndown-sprint · python · pygal · anyplot.ai"

# Data — 2-week sprint: 10 working days + 1 Sat/Sun weekend block
x_labels = ["Start", "Mon", "Tue", "Wed*", "Thu", "Fri", "Sat", "Sun", "Mon", "Tue", "Wed", "Thu", "Fri"]
# Ideal burndown: 4 pts/working day from 40 → 0; flat on Sat and Sun
ideal = [40, 36, 32, 28, 24, 20, 20, 20, 16, 12, 8, 4, 0]
# Actual remaining: scope change on Wed* (day 3) pushes line above ideal mid-sprint
actual = [40, 36, 30, 32, 27, 22, 22, 22, 16, 10, 5, 2, 0]

# Overlay landmark indices in x_labels
WEEKEND_START_IDX = 6  # Sat
WEEKEND_END_IDX = 7  # Sun
SCOPE_CHANGE_IDX = 3  # Wed*

custom_style = Style(
    background=PAGE_BG,
    plot_background=PAGE_BG,
    foreground=INK,
    foreground_strong=INK,
    foreground_subtle=INK_MUTED,
    colors=(IMPRINT_PALETTE[0], ANYPLOT_NEUTRAL),
    title_font_size=66,
    label_font_size=56,
    major_label_font_size=44,
    legend_font_size=44,
    value_font_size=36,
    stroke_width=4,
)

chart = pygal.Line(
    width=3200,
    height=1800,
    style=custom_style,
    title=title,
    x_title="Sprint Day  (* Wed = scope +8 pts  |  Sat–Sun = weekend)",
    y_title="Remaining Story Points",
    show_x_guides=False,
    show_y_guides=True,
    show_dots=True,
    dots_size=8,
    stroke=True,
    x_label_rotation=0,
)

chart.x_labels = x_labels
chart.add("Actual", actual, stroke_style={"width": 5})
chart.add("Ideal", ideal, stroke_style={"width": 3, "dasharray": "8, 6"})

# Render to SVG then post-process: inject weekend band + scope-change marker
svg_str = chart.render().decode("utf-8")

# Extract x-coordinates from data-point circle elements (plot-group local space)
cx_vals = sorted(
    {int(round(float(m.group(1)))) for m in re.finditer(r"<circle\b[^>]+\bcx=[\"']([^\"']+)[\"']", svg_str)}
)  # 13 unique positions, one per x_label

# Estimate plot area height from maximum cy of data circles
cy_vals = [float(m.group(1)) for m in re.finditer(r"<circle\b[^>]+\bcy=[\"']([^\"']+)[\"']", svg_str)]
plot_height = int(max(cy_vals) + 80) if cy_vals else 1380

# Build SVG overlay elements (injected before the first data series group)
overlays = []
if len(cx_vals) >= 13:
    step = cx_vals[1] - cx_vals[0]

    # Weekend shading band: covers from midpoint before Sat to midpoint after Sun
    wx_left = cx_vals[WEEKEND_START_IDX] - step // 2
    wx_right = cx_vals[WEEKEND_END_IDX] + step // 2
    overlays.append(
        f'<rect x="{wx_left}" y="0" width="{wx_right - wx_left}" '
        f'height="{plot_height}" fill="{WEEKEND_FILL}" fill-opacity="0.07" stroke="none"/>'
    )

    # Scope-change vertical dashed marker at Wed* (index 3)
    sx = cx_vals[SCOPE_CHANGE_IDX]
    overlays.append(
        f'<line x1="{sx}" y1="0" x2="{sx}" y2="{plot_height}" '
        f'stroke="{SCOPE_COLOR}" stroke-width="4" stroke-dasharray="14,7" opacity="0.85"/>'
    )
    # Inline annotation label near the top of the marker line
    overlays.append(
        f'<text x="{sx + 14}" y="54" fill="{SCOPE_COLOR}" '
        f'font-family="sans-serif" font-size="38" font-weight="600" opacity="0.9">'
        f"Scope +8 pts</text>"
    )

if overlays:
    # Insert inside the plot group, immediately before the first data series
    for marker in ('<g class="series serie-0', '<g class="series '):
        pos = svg_str.find(marker)
        if pos >= 0:
            svg_str = svg_str[:pos] + "\n".join(overlays) + "\n" + svg_str[pos:]
            break

output_bytes = svg_str.encode("utf-8")
cairosvg.svg2png(bytestring=output_bytes, write_to=f"plot-{THEME}.png")
with open(f"plot-{THEME}.html", "wb") as f:
    f.write(output_bytes)
Runnable source as JSON, for any HTTP client: https://api.anyplot.ai/specs/burndown-sprint/pygal/code. Any spec id and library id listed in llms-full.txt fit the same URL shape; every URL below is complete and callable.
{
  "spec_id": "burndown-sprint",
  "language": "python",
  "library": "pygal",
  "page": "https://anyplot.ai/burndown-sprint/python/pygal",
  "hub": "https://anyplot.ai/burndown-sprint",
  "code_json": "https://api.anyplot.ai/specs/burndown-sprint/pygal/code",
  "spec_json": "https://api.anyplot.ai/specs/burndown-sprint",
  "render_light_png": "https://storage.googleapis.com/anyplot-images/plots/burndown-sprint/python/pygal/plot-light.png",
  "render_dark_png": "https://storage.googleapis.com/anyplot-images/plots/burndown-sprint/python/pygal/plot-dark.png",
  "interactive_light_html": "https://storage.googleapis.com/anyplot-images/plots/burndown-sprint/python/pygal/plot-light.html",
  "interactive_dark_html": "https://storage.googleapis.com/anyplot-images/plots/burndown-sprint/python/pygal/plot-dark.html",
  "quality_score": 87.0,
  "license": "MIT",
  "guide": "https://anyplot.ai/llms.txt"
}
Part of Agile Sprint Burndown Chart on anyplot.ai.