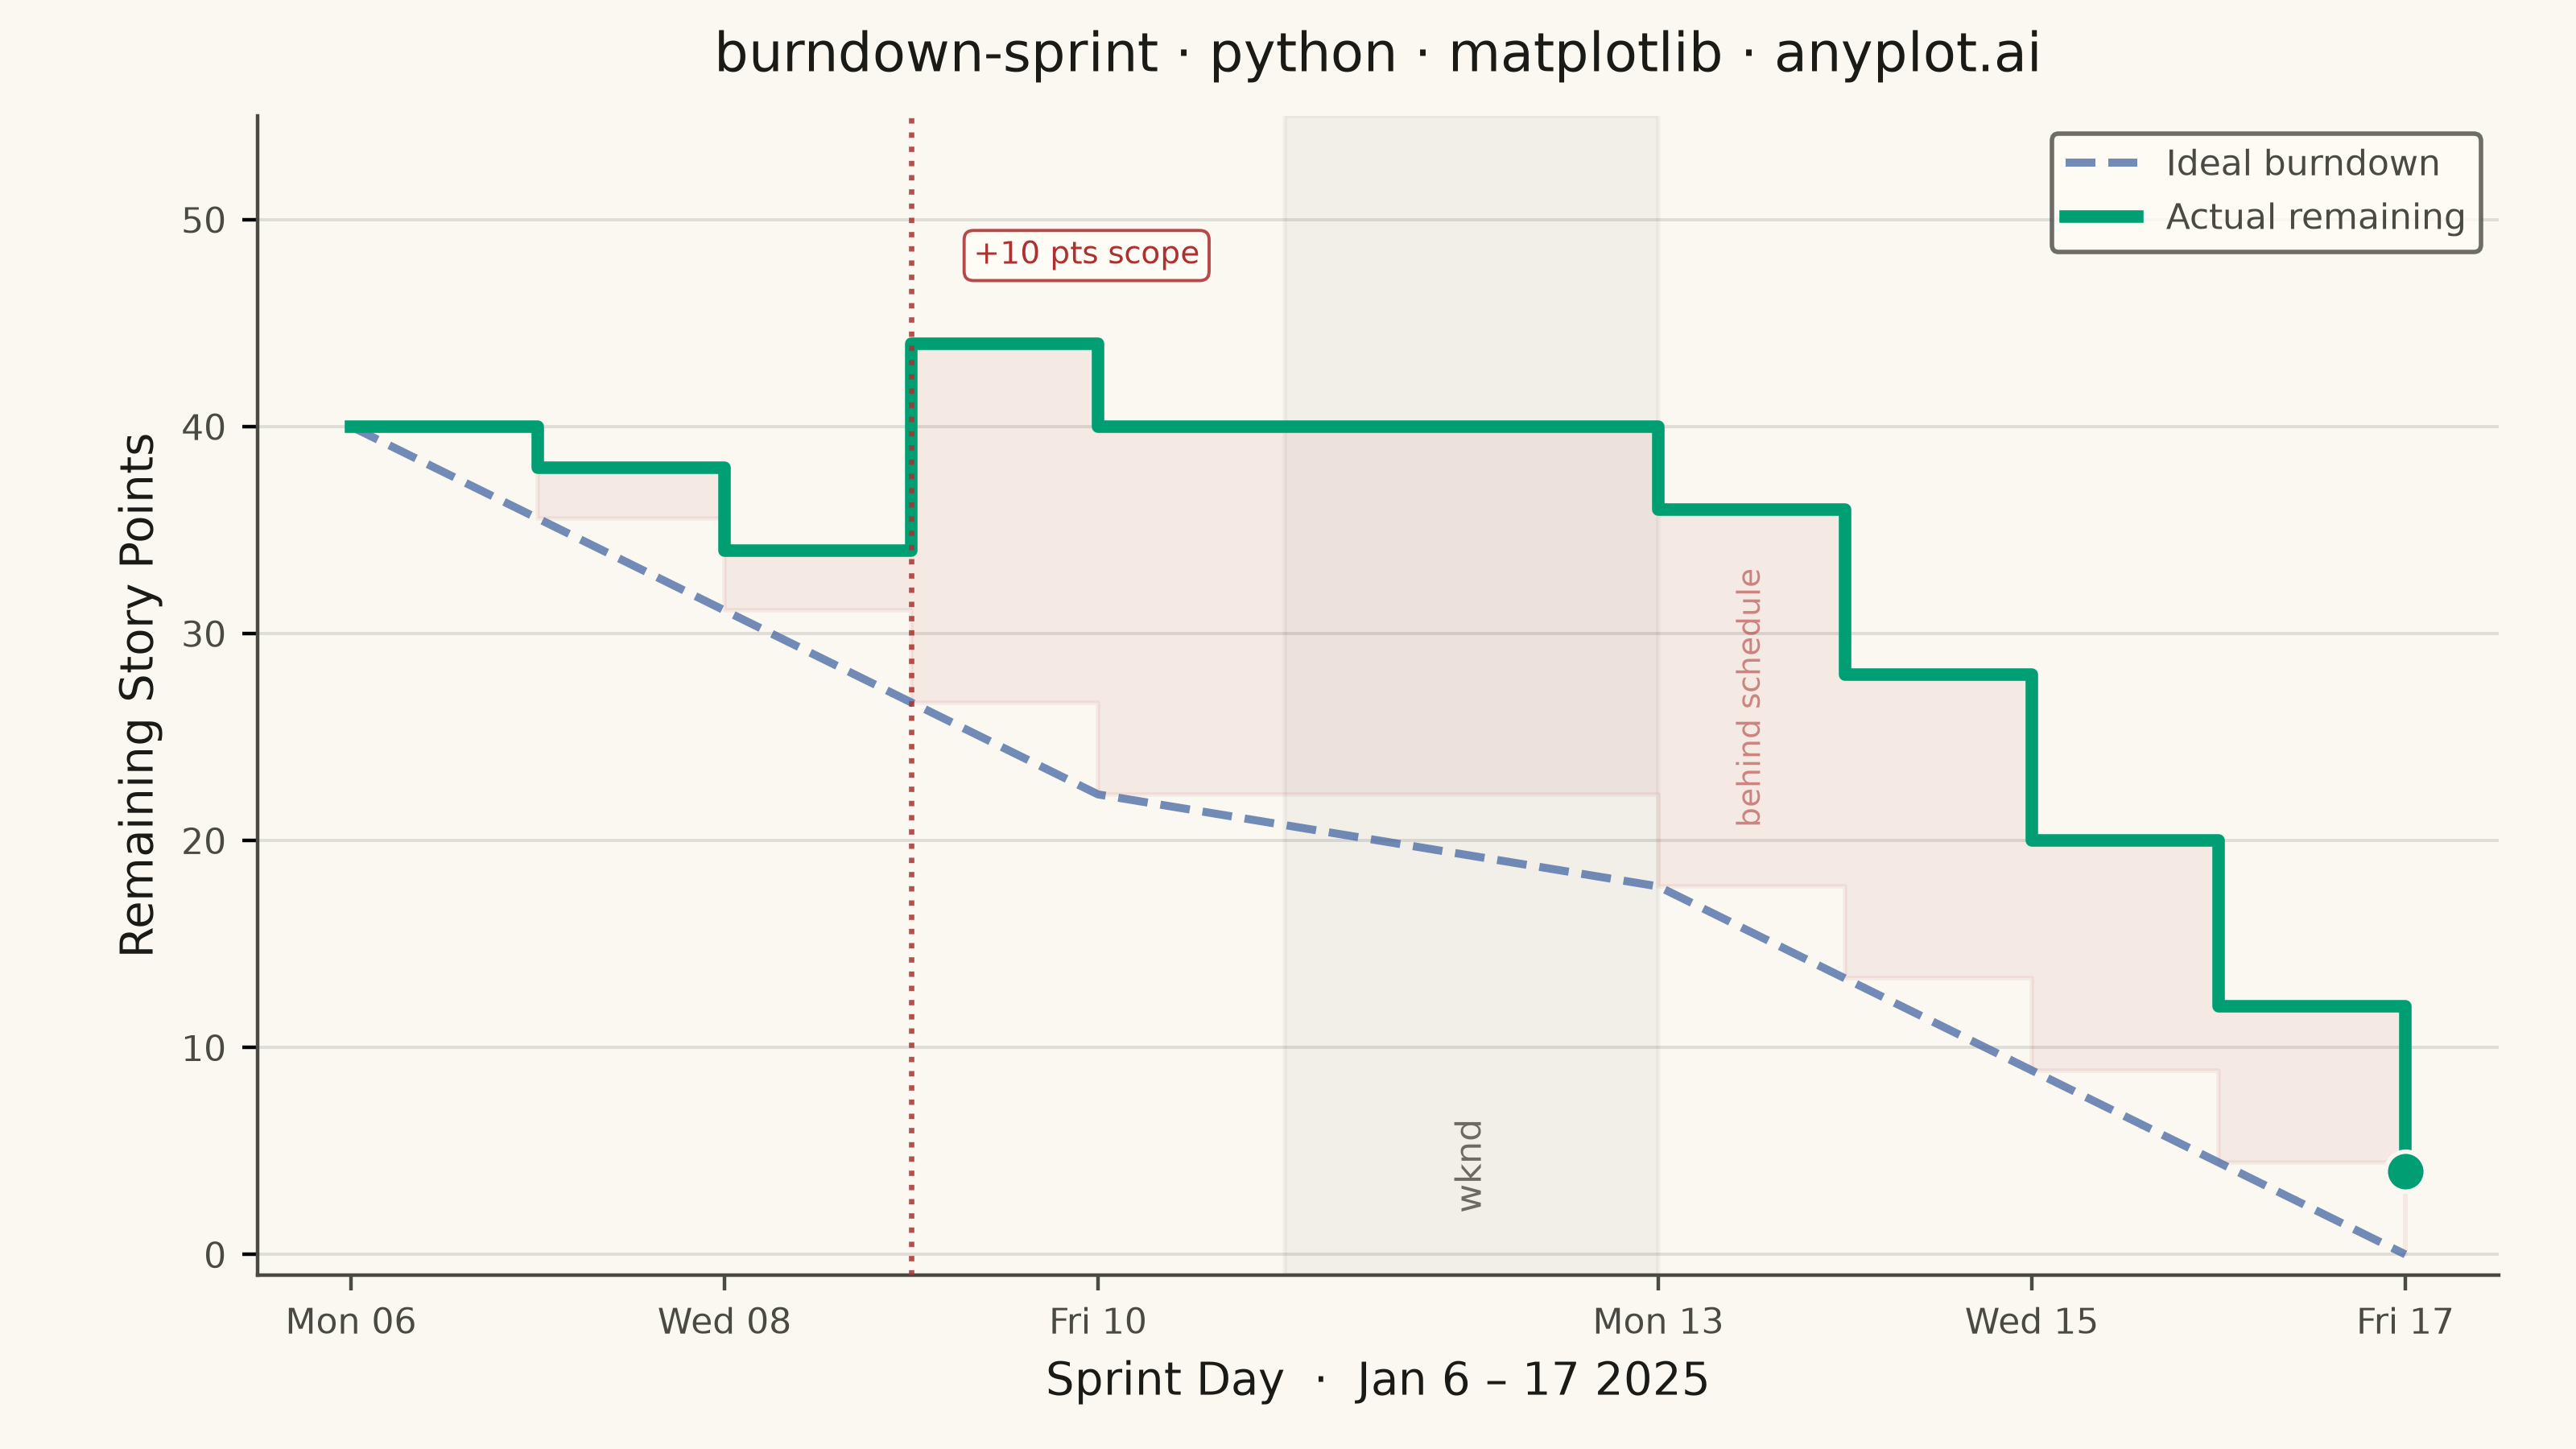
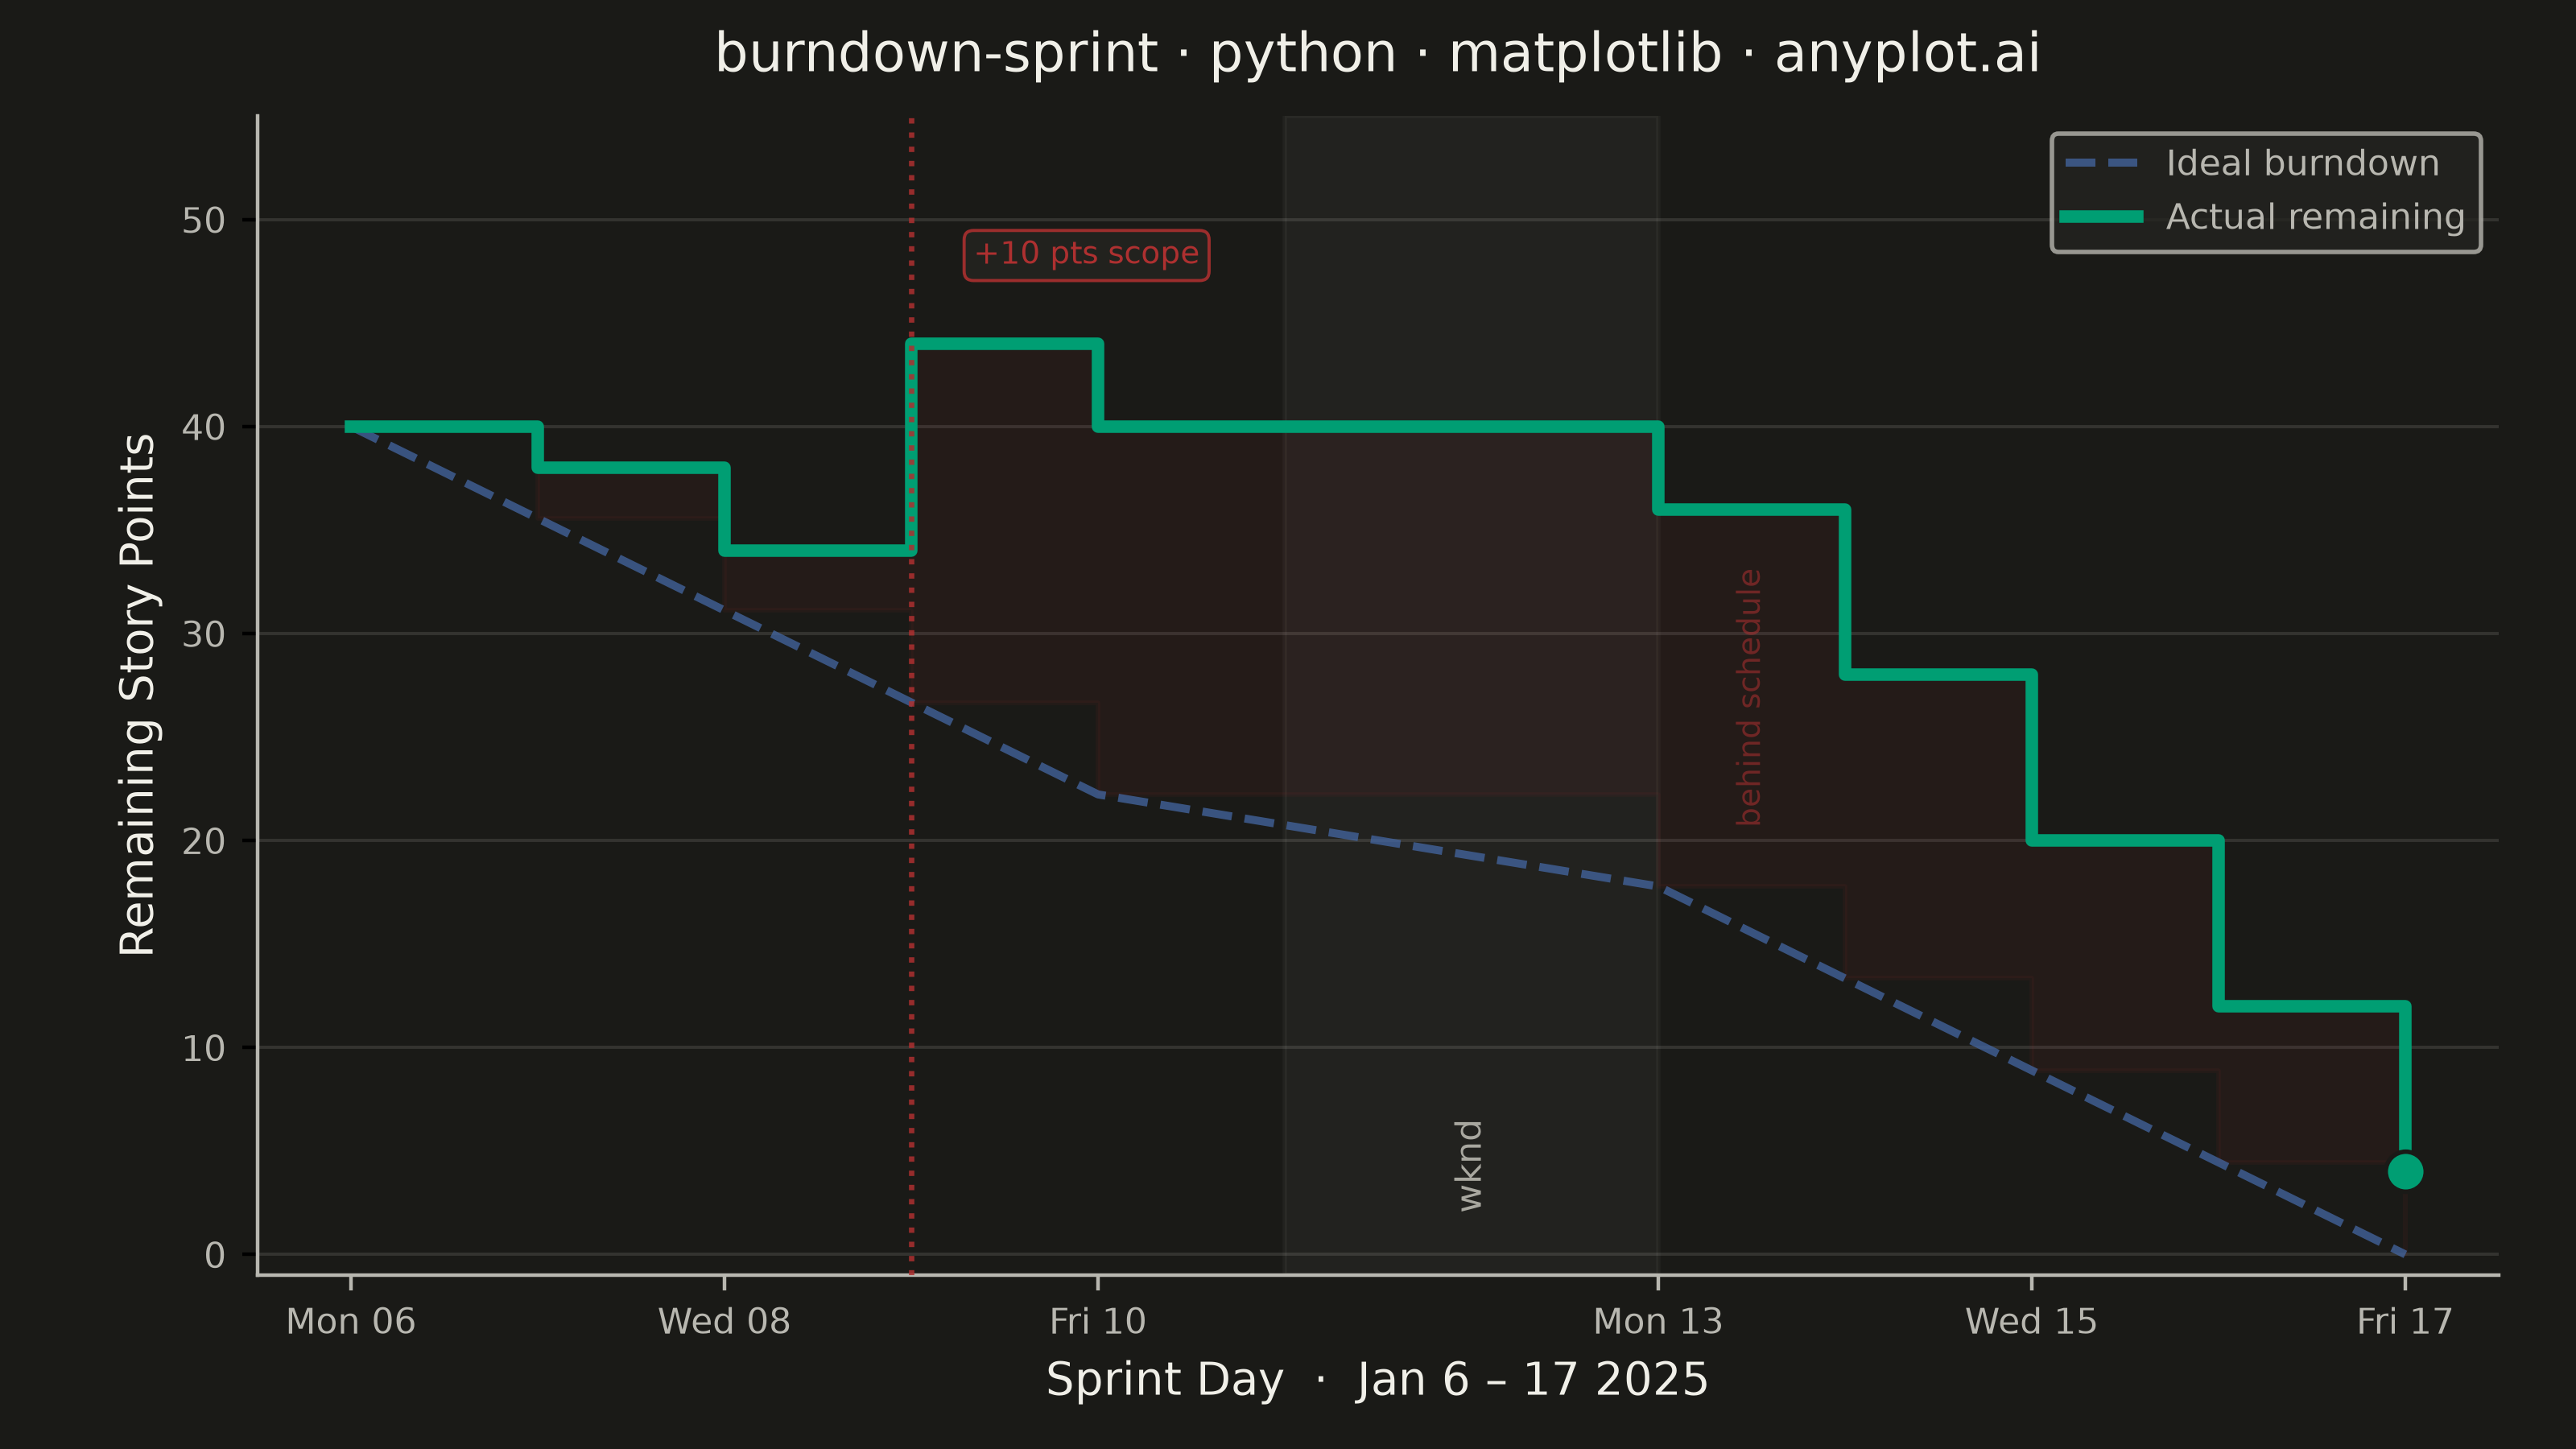
A sprint burndown chart tracks the amount of remaining work in an agile sprint over time, plotted as a step (or line) series that descends as tasks are completed. A straight ideal-burndown guideline runs diagonally from the total committed scope on day one down to zero on the final day, giving the team an at-a-glance reference for whether they are ahead of or behind schedule. It is one of the most widely used project-management visualizations in software development, surfacing scope creep, stalled progress, and end-of-sprint risk early enough to act on.
""" anyplot.ai
burndown-sprint: Agile Sprint Burndown Chart
Library: matplotlib 3.11.0 | Python 3.13.13
Quality: 89/100 | Created: 2026-06-14
"""

import sys


# Prevent this file from shadowing the installed matplotlib package when run
# from its own directory (sys.path[0] would otherwise resolve to this file).
sys.path.pop(0)

import os

import matplotlib.dates as mdates
import matplotlib.pyplot as plt
import numpy as np
import pandas as pd


# Theme tokens
THEME = os.getenv("ANYPLOT_THEME", "light")
PAGE_BG = "#FAF8F1" if THEME == "light" else "#1A1A17"
ELEVATED_BG = "#FFFDF6" if THEME == "light" else "#242420"
INK = "#1A1A17" if THEME == "light" else "#F0EFE8"
INK_SOFT = "#4A4A44" if THEME == "light" else "#B8B7B0"
INK_MUTED = "#6B6A63" if THEME == "light" else "#A8A79F"

# Imprint palette positions used
BRAND = "#009E73"  # brand green — actual remaining (first series, always)
BLUE = "#4467A3"  # blue — ideal burndown reference line
RED = "#AE3030"  # matte red — scope change / behind-schedule indicator

# Data — 10-working-day sprint: Mon Jan 6 to Fri Jan 17 2025
# Committed scope: 40 story points; scope change (+10) occurs on Thu Jan 9
sprint_dates = pd.bdate_range("2025-01-06", "2025-01-17")  # 10 business days
remaining = np.array([40, 38, 34, 44, 40, 36, 28, 20, 12, 4])
ideal = np.linspace(40, 0, len(sprint_dates))

scope_change_date = sprint_dates[3]  # Jan 9: remaining jumps 34 → 44 (+10 scope)

# Plot
fig, ax = plt.subplots(figsize=(8, 4.5), dpi=400, facecolor=PAGE_BG)
ax.set_facecolor(PAGE_BG)

# Weekend background band (Sat–Sun between the two working weeks)
ax.axvspan(pd.Timestamp("2025-01-11"), pd.Timestamp("2025-01-13"), color=INK, alpha=0.04, zorder=0)
ax.text(pd.Timestamp("2025-01-12"), 2, "wknd", fontsize=8, ha="center", va="bottom", color=INK_MUTED, rotation=90)

# Behind-schedule fill: region where actual remaining exceeds the ideal target
ax.fill_between(sprint_dates, remaining, ideal, where=(remaining > ideal), color=RED, alpha=0.07, step="post", zorder=1)

# Ideal burndown — straight diagonal reference from committed scope to zero
ax.plot(sprint_dates, ideal, color=BLUE, linewidth=1.8, linestyle="--", alpha=0.75, label="Ideal burndown", zorder=2)

# Actual remaining — step series (work completes in discrete daily chunks)
ax.step(sprint_dates, remaining, where="post", color=BRAND, linewidth=2.8, label="Actual remaining", zorder=3)
ax.scatter([sprint_dates[-1]], [remaining[-1]], color=BRAND, s=80, zorder=4, edgecolors=PAGE_BG, linewidth=1.0)

# Scope change: vertical dotted line + label above the spike
ax.axvline(scope_change_date, color=RED, linewidth=1.2, linestyle=":", alpha=0.85, zorder=4)
ax.text(
    scope_change_date + pd.Timedelta(hours=8),
    47.5,
    "+10 pts scope",
    fontsize=7,
    color=RED,
    ha="left",
    va="bottom",
    bbox={"facecolor": ELEVATED_BG, "edgecolor": RED, "alpha": 0.88, "linewidth": 0.7, "boxstyle": "round,pad=0.3"},
    zorder=5,
)

# "Behind schedule" label at peak deviation — Jan 13 (Mon), midpoint between step and ideal
ax.text(
    sprint_dates[5] + pd.Timedelta(hours=12),
    (remaining[5] + ideal[5]) / 2,
    "behind schedule",
    fontsize=7,
    color=RED,
    alpha=0.55,
    ha="center",
    va="center",
    rotation=90,
)

# Axis limits and labels
ax.set_xlim(sprint_dates[0] - pd.Timedelta(hours=12), sprint_dates[-1] + pd.Timedelta(hours=12))
ax.set_ylim(-1, 55)
ax.set_ylabel("Remaining Story Points", fontsize=10, color=INK)
ax.set_xlabel("Sprint Day  ·  Jan 6 – 17 2025", fontsize=10, color=INK)

# X-axis ticks: Mon, Wed, Fri
ax.xaxis.set_major_locator(mdates.WeekdayLocator(byweekday=[0, 2, 4]))
ax.xaxis.set_major_formatter(mdates.DateFormatter("%a %d"))
plt.setp(ax.get_xticklabels(), rotation=0, ha="center", fontsize=8, color=INK_SOFT)
ax.tick_params(axis="y", labelsize=8, labelcolor=INK_SOFT)
ax.tick_params(axis="x", colors=INK_SOFT)

# Grid and spines
ax.yaxis.grid(True, alpha=0.12, linewidth=0.7, color=INK)
ax.set_axisbelow(True)
ax.spines["top"].set_visible(False)
ax.spines["right"].set_visible(False)
for s in ("left", "bottom"):
    ax.spines[s].set_color(INK_SOFT)

# Title
title = "burndown-sprint · python · matplotlib · anyplot.ai"
ax.set_title(title, fontsize=12, fontweight="medium", color=INK, pad=10)

# Legend
leg = ax.legend(fontsize=8, loc="upper right")
if leg:
    leg.get_frame().set_facecolor(ELEVATED_BG)
    leg.get_frame().set_edgecolor(INK_SOFT)
    plt.setp(leg.get_texts(), color=INK_SOFT)

fig.subplots_adjust(left=0.10, right=0.97, top=0.92, bottom=0.12)

# Save
plt.savefig(f"plot-{THEME}.png", dpi=400, facecolor=PAGE_BG)
plt.close()
Runnable source as JSON, for any HTTP client: https://api.anyplot.ai/specs/burndown-sprint/matplotlib/code. Any spec id and library id listed in llms-full.txt fit the same URL shape; every URL below is complete and callable.
{
  "spec_id": "burndown-sprint",
  "language": "python",
  "library": "matplotlib",
  "page": "https://anyplot.ai/burndown-sprint/python/matplotlib",
  "hub": "https://anyplot.ai/burndown-sprint",
  "code_json": "https://api.anyplot.ai/specs/burndown-sprint/matplotlib/code",
  "spec_json": "https://api.anyplot.ai/specs/burndown-sprint",
  "render_light_png": "https://storage.googleapis.com/anyplot-images/plots/burndown-sprint/python/matplotlib/plot-light.png",
  "render_dark_png": "https://storage.googleapis.com/anyplot-images/plots/burndown-sprint/python/matplotlib/plot-dark.png",
  "quality_score": 89.0,
  "license": "MIT",
  "guide": "https://anyplot.ai/llms.txt"
}
Part of Agile Sprint Burndown Chart on anyplot.ai.