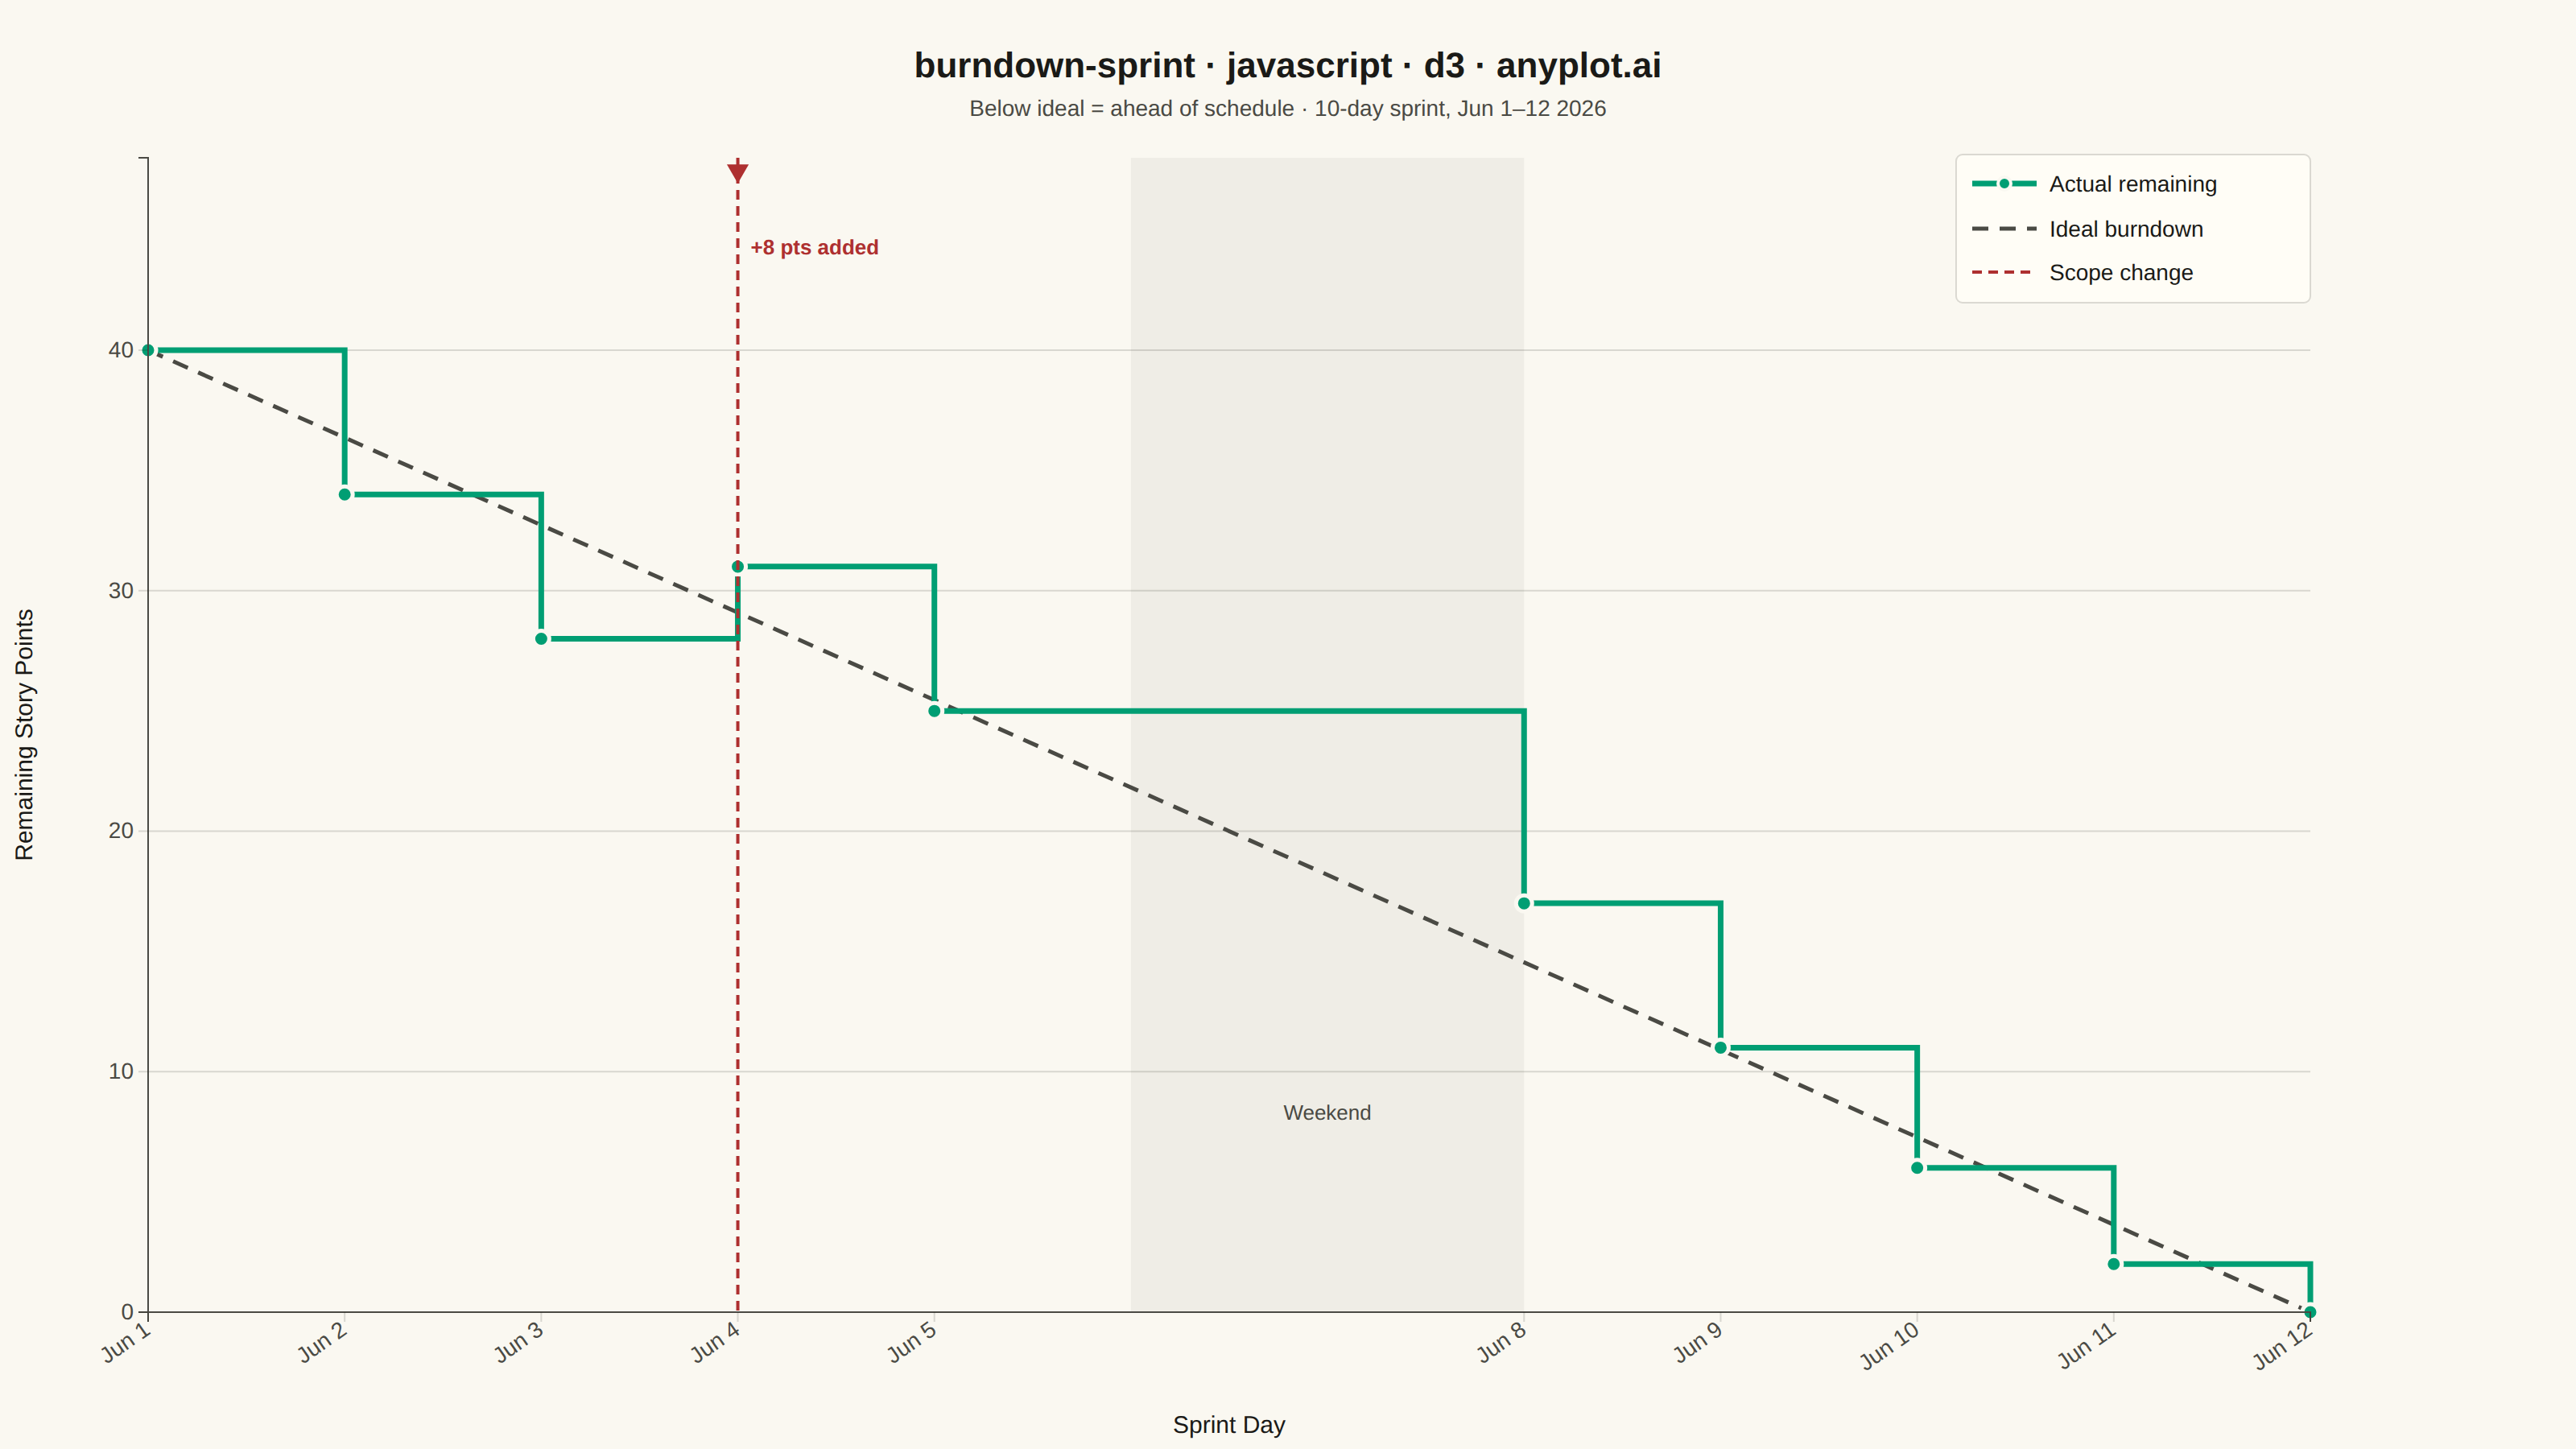
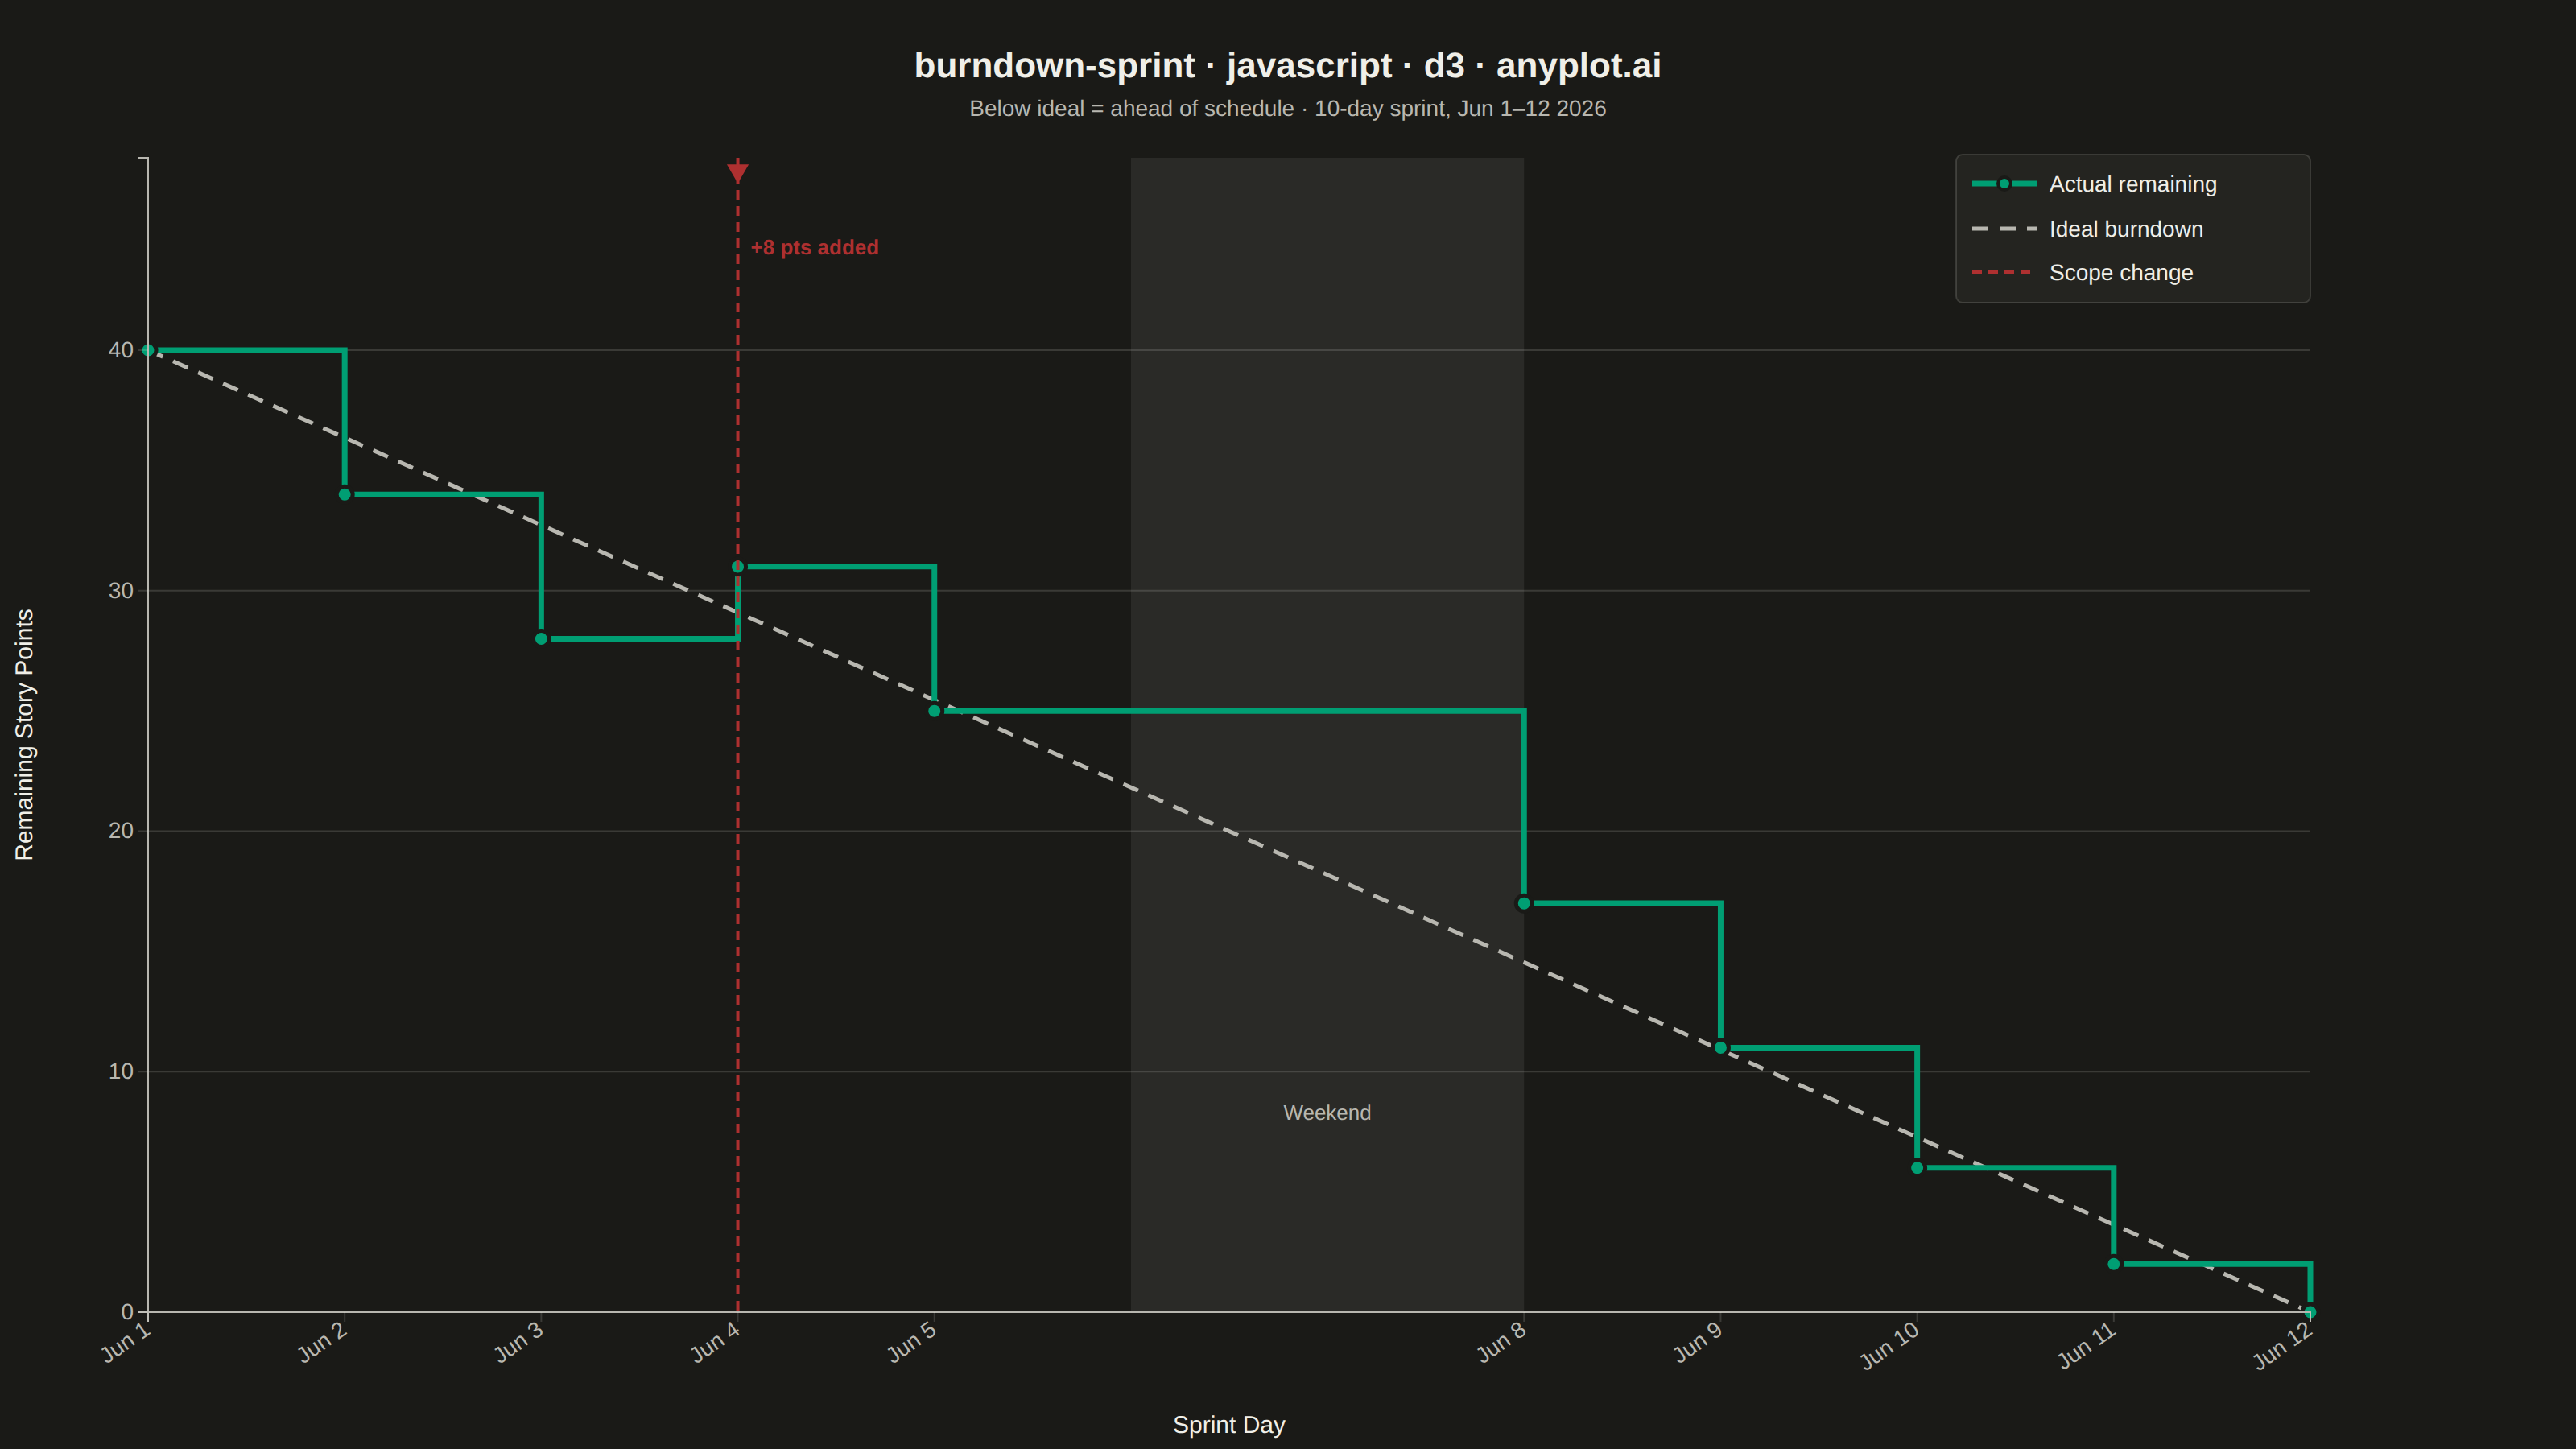
A sprint burndown chart tracks the amount of remaining work in an agile sprint over time, plotted as a step (or line) series that descends as tasks are completed. A straight ideal-burndown guideline runs diagonally from the total committed scope on day one down to zero on the final day, giving the team an at-a-glance reference for whether they are ahead of or behind schedule. It is one of the most widely used project-management visualizations in software development, surfacing scope creep, stalled progress, and end-of-sprint risk early enough to act on.
// anyplot.ai
// burndown-sprint: Agile Sprint Burndown Chart
// Library: d3 7.9.0 | JavaScript 22.22.3
// Quality: 92/100 | Created: 2026-06-14

const t = window.ANYPLOT_TOKENS;
const { width, height } = window.ANYPLOT_SIZE;
const margin = { top: 98, right: 165, bottom: 85, left: 92 };
const iw = width - margin.left - margin.right;
const ih = height - margin.top - margin.bottom;

// --- Data: 10-working-day sprint Jun 1–12 2026 (weekends Jun 6–7) ---
// Initial scope: 40 story points; scope change +8 on Jun 4 (burned 5, added 8 → net +3)
const parseDate = d3.timeParse("%Y-%m-%d");

const actualData = [
  { date: parseDate("2026-06-01"), value: 40 },
  { date: parseDate("2026-06-02"), value: 34 },
  { date: parseDate("2026-06-03"), value: 28 },
  { date: parseDate("2026-06-04"), value: 31 },
  { date: parseDate("2026-06-05"), value: 25 },
  { date: parseDate("2026-06-08"), value: 17 },
  { date: parseDate("2026-06-09"), value: 11 },
  { date: parseDate("2026-06-10"), value: 6 },
  { date: parseDate("2026-06-11"), value: 2 },
  { date: parseDate("2026-06-12"), value: 0 },
];

// Ideal line: straight from (Jun 1, 40) to (Jun 12, 0)
const idealData = [
  { date: parseDate("2026-06-01"), value: 40 },
  { date: parseDate("2026-06-12"), value: 0 },
];

const scopeChangeDate = parseDate("2026-06-04");
const weekendStart = parseDate("2026-06-06");
const weekendEnd = parseDate("2026-06-08");

// --- SVG mount ---
const svg = d3.select("#container").append("svg")
  .attr("width", width).attr("height", height);
const g = svg.append("g").attr("transform", `translate(${margin.left},${margin.top})`);

// --- Scales ---
const x = d3.scaleTime()
  .domain([parseDate("2026-06-01"), parseDate("2026-06-12")])
  .range([0, iw]);
const y = d3.scaleLinear()
  .domain([0, 48])
  .range([ih, 0]);

// --- Weekend band ---
const isLight = window.ANYPLOT_THEME === "light";
g.append("rect")
  .attr("x", x(weekendStart))
  .attr("y", 0)
  .attr("width", x(weekendEnd) - x(weekendStart))
  .attr("height", ih)
  .attr("fill", isLight ? "rgba(0,0,0,0.045)" : "rgba(255,255,255,0.07)");

g.append("text")
  .attr("x", (x(weekendStart) + x(weekendEnd)) / 2)
  .attr("y", y(8))
  .attr("text-anchor", "middle")
  .attr("fill", t.inkSoft)
  .style("font-size", "13px")
  .text("Weekend");

// --- Horizontal gridlines ---
g.append("g")
  .call(d3.axisLeft(y).tickSize(-iw).tickFormat("").ticks(6))
  .call(ax => ax.select(".domain").remove())
  .call(ax => ax.selectAll("line")
    .attr("stroke", t.grid)
    .attr("stroke-width", 1));

// --- Ideal burndown line (dashed, muted) ---
g.append("path")
  .datum(idealData)
  .attr("fill", "none")
  .attr("stroke", t.inkSoft)
  .attr("stroke-width", 2.5)
  .attr("stroke-dasharray", "10,7")
  .attr("d", d3.line().x(d => x(d.date)).y(d => y(d.value)));

// --- Actual remaining (step-after curve, brand green) ---
g.append("path")
  .datum(actualData)
  .attr("fill", "none")
  .attr("stroke", t.palette[0])
  .attr("stroke-width", 3.5)
  .attr("d", d3.line()
    .x(d => x(d.date))
    .y(d => y(d.value))
    .curve(d3.curveStepAfter));

// Data point markers
g.selectAll(".dot")
  .data(actualData)
  .join("circle")
  .attr("class", "dot")
  .attr("cx", d => x(d.date))
  .attr("cy", d => y(d.value))
  .attr("r", 5)
  .attr("fill", t.palette[0])
  .attr("stroke", t.pageBg)
  .attr("stroke-width", 2.5);

// --- Scope change marker (matte red vertical dashed line + D3 triangle tip) ---
g.append("line")
  .attr("x1", x(scopeChangeDate)).attr("x2", x(scopeChangeDate))
  .attr("y1", 0).attr("y2", ih)
  .attr("stroke", t.palette[4])
  .attr("stroke-width", 2)
  .attr("stroke-dasharray", "6,4");

// Triangle arrowhead at the top of the scope-change line (pointing down = event occurred here)
g.append("path")
  .attr("d", d3.symbol().type(d3.symbolTriangle).size(80)())
  .attr("transform", `translate(${x(scopeChangeDate)}, 8) rotate(180)`)
  .attr("fill", t.palette[4]);

// Scope change annotation
const scx = x(scopeChangeDate) + 8;
g.append("text")
  .attr("x", scx).attr("y", y(44))
  .attr("fill", t.palette[4])
  .style("font-size", "13px")
  .style("font-weight", "600")
  .text("+8 pts added");

// --- X axis ---
const xAxis = g.append("g")
  .attr("transform", `translate(0,${ih})`)
  .call(
    d3.axisBottom(x)
      .tickValues(actualData.map(d => d.date))
      .tickFormat(d => `${d3.timeFormat("%b")(d)} ${d.getDate()}`)
  );
xAxis.selectAll("text")
  .attr("fill", t.inkSoft)
  .style("font-size", "14px")
  .attr("transform", "rotate(-35)")
  .attr("text-anchor", "end")
  .attr("dx", "-0.4em")
  .attr("dy", "0.2em");
xAxis.selectAll("line").attr("stroke", t.grid);
xAxis.select(".domain").attr("stroke", t.inkSoft);

// --- Y axis ---
const yAxis = g.append("g")
  .call(d3.axisLeft(y).ticks(6));
yAxis.selectAll("text").attr("fill", t.inkSoft).style("font-size", "14px");
yAxis.selectAll("line").attr("stroke", t.grid);
yAxis.select(".domain").attr("stroke", t.inkSoft);

// --- Axis labels ---
svg.append("text")
  .attr("x", margin.left + iw / 2)
  .attr("y", height - 10)
  .attr("text-anchor", "middle")
  .attr("fill", t.ink)
  .style("font-size", "15px")
  .text("Sprint Day");

svg.append("text")
  .attr("transform", `translate(20,${margin.top + ih / 2}) rotate(-90)`)
  .attr("text-anchor", "middle")
  .attr("fill", t.ink)
  .style("font-size", "15px")
  .text("Remaining Story Points");

// --- Legend (top-right of plot area) ---
const lx = iw - 210;
const ly = 8;

// Elevated-bg legend frame
g.append("rect")
  .attr("x", lx - 10).attr("y", ly - 10)
  .attr("width", 220).attr("height", 92)
  .attr("rx", 4)
  .attr("fill", t.elevatedBg)
  .attr("stroke", t.grid)
  .attr("stroke-width", 1);

g.append("line")
  .attr("x1", lx).attr("y1", ly + 8).attr("x2", lx + 40).attr("y2", ly + 8)
  .attr("stroke", t.palette[0]).attr("stroke-width", 3.5);
g.append("circle")
  .attr("cx", lx + 20).attr("cy", ly + 8).attr("r", 4)
  .attr("fill", t.palette[0]).attr("stroke", t.pageBg).attr("stroke-width", 2);
g.append("text")
  .attr("x", lx + 48).attr("y", ly + 13)
  .attr("fill", t.ink).style("font-size", "14px").text("Actual remaining");

g.append("line")
  .attr("x1", lx).attr("y1", ly + 36).attr("x2", lx + 40).attr("y2", ly + 36)
  .attr("stroke", t.inkSoft).attr("stroke-width", 2.5).attr("stroke-dasharray", "10,7");
g.append("text")
  .attr("x", lx + 48).attr("y", ly + 41)
  .attr("fill", t.ink).style("font-size", "14px").text("Ideal burndown");

g.append("line")
  .attr("x1", lx).attr("y1", ly + 63).attr("x2", lx + 40).attr("y2", ly + 63)
  .attr("stroke", t.palette[4]).attr("stroke-width", 2).attr("stroke-dasharray", "6,4");
g.append("text")
  .attr("x", lx + 48).attr("y", ly + 68)
  .attr("fill", t.ink).style("font-size", "14px").text("Scope change");

// --- Title and subtitle ---
svg.append("text")
  .attr("x", width / 2).attr("y", 48)
  .attr("text-anchor", "middle")
  .attr("fill", t.ink)
  .style("font-size", "22px")
  .style("font-weight", "600")
  .text("burndown-sprint · javascript · d3 · anyplot.ai");

svg.append("text")
  .attr("x", width / 2).attr("y", 72)
  .attr("text-anchor", "middle")
  .attr("fill", t.inkSoft)
  .style("font-size", "14px")
  .text("Below ideal = ahead of schedule · 10-day sprint, Jun 1–12 2026");
Runnable source as JSON, for any HTTP client: https://api.anyplot.ai/specs/burndown-sprint/d3/code. Any spec id and library id listed in llms-full.txt fit the same URL shape; every URL below is complete and callable.
{
  "spec_id": "burndown-sprint",
  "language": "javascript",
  "library": "d3",
  "page": "https://anyplot.ai/burndown-sprint/javascript/d3",
  "hub": "https://anyplot.ai/burndown-sprint",
  "code_json": "https://api.anyplot.ai/specs/burndown-sprint/d3/code",
  "spec_json": "https://api.anyplot.ai/specs/burndown-sprint",
  "render_light_png": "https://storage.googleapis.com/anyplot-images/plots/burndown-sprint/javascript/d3/plot-light.png",
  "render_dark_png": "https://storage.googleapis.com/anyplot-images/plots/burndown-sprint/javascript/d3/plot-dark.png",
  "interactive_light_html": "https://storage.googleapis.com/anyplot-images/plots/burndown-sprint/javascript/d3/plot-light.html",
  "interactive_dark_html": "https://storage.googleapis.com/anyplot-images/plots/burndown-sprint/javascript/d3/plot-dark.html",
  "quality_score": 92.0,
  "license": "MIT",
  "guide": "https://anyplot.ai/llms.txt"
}
Part of Agile Sprint Burndown Chart on anyplot.ai.