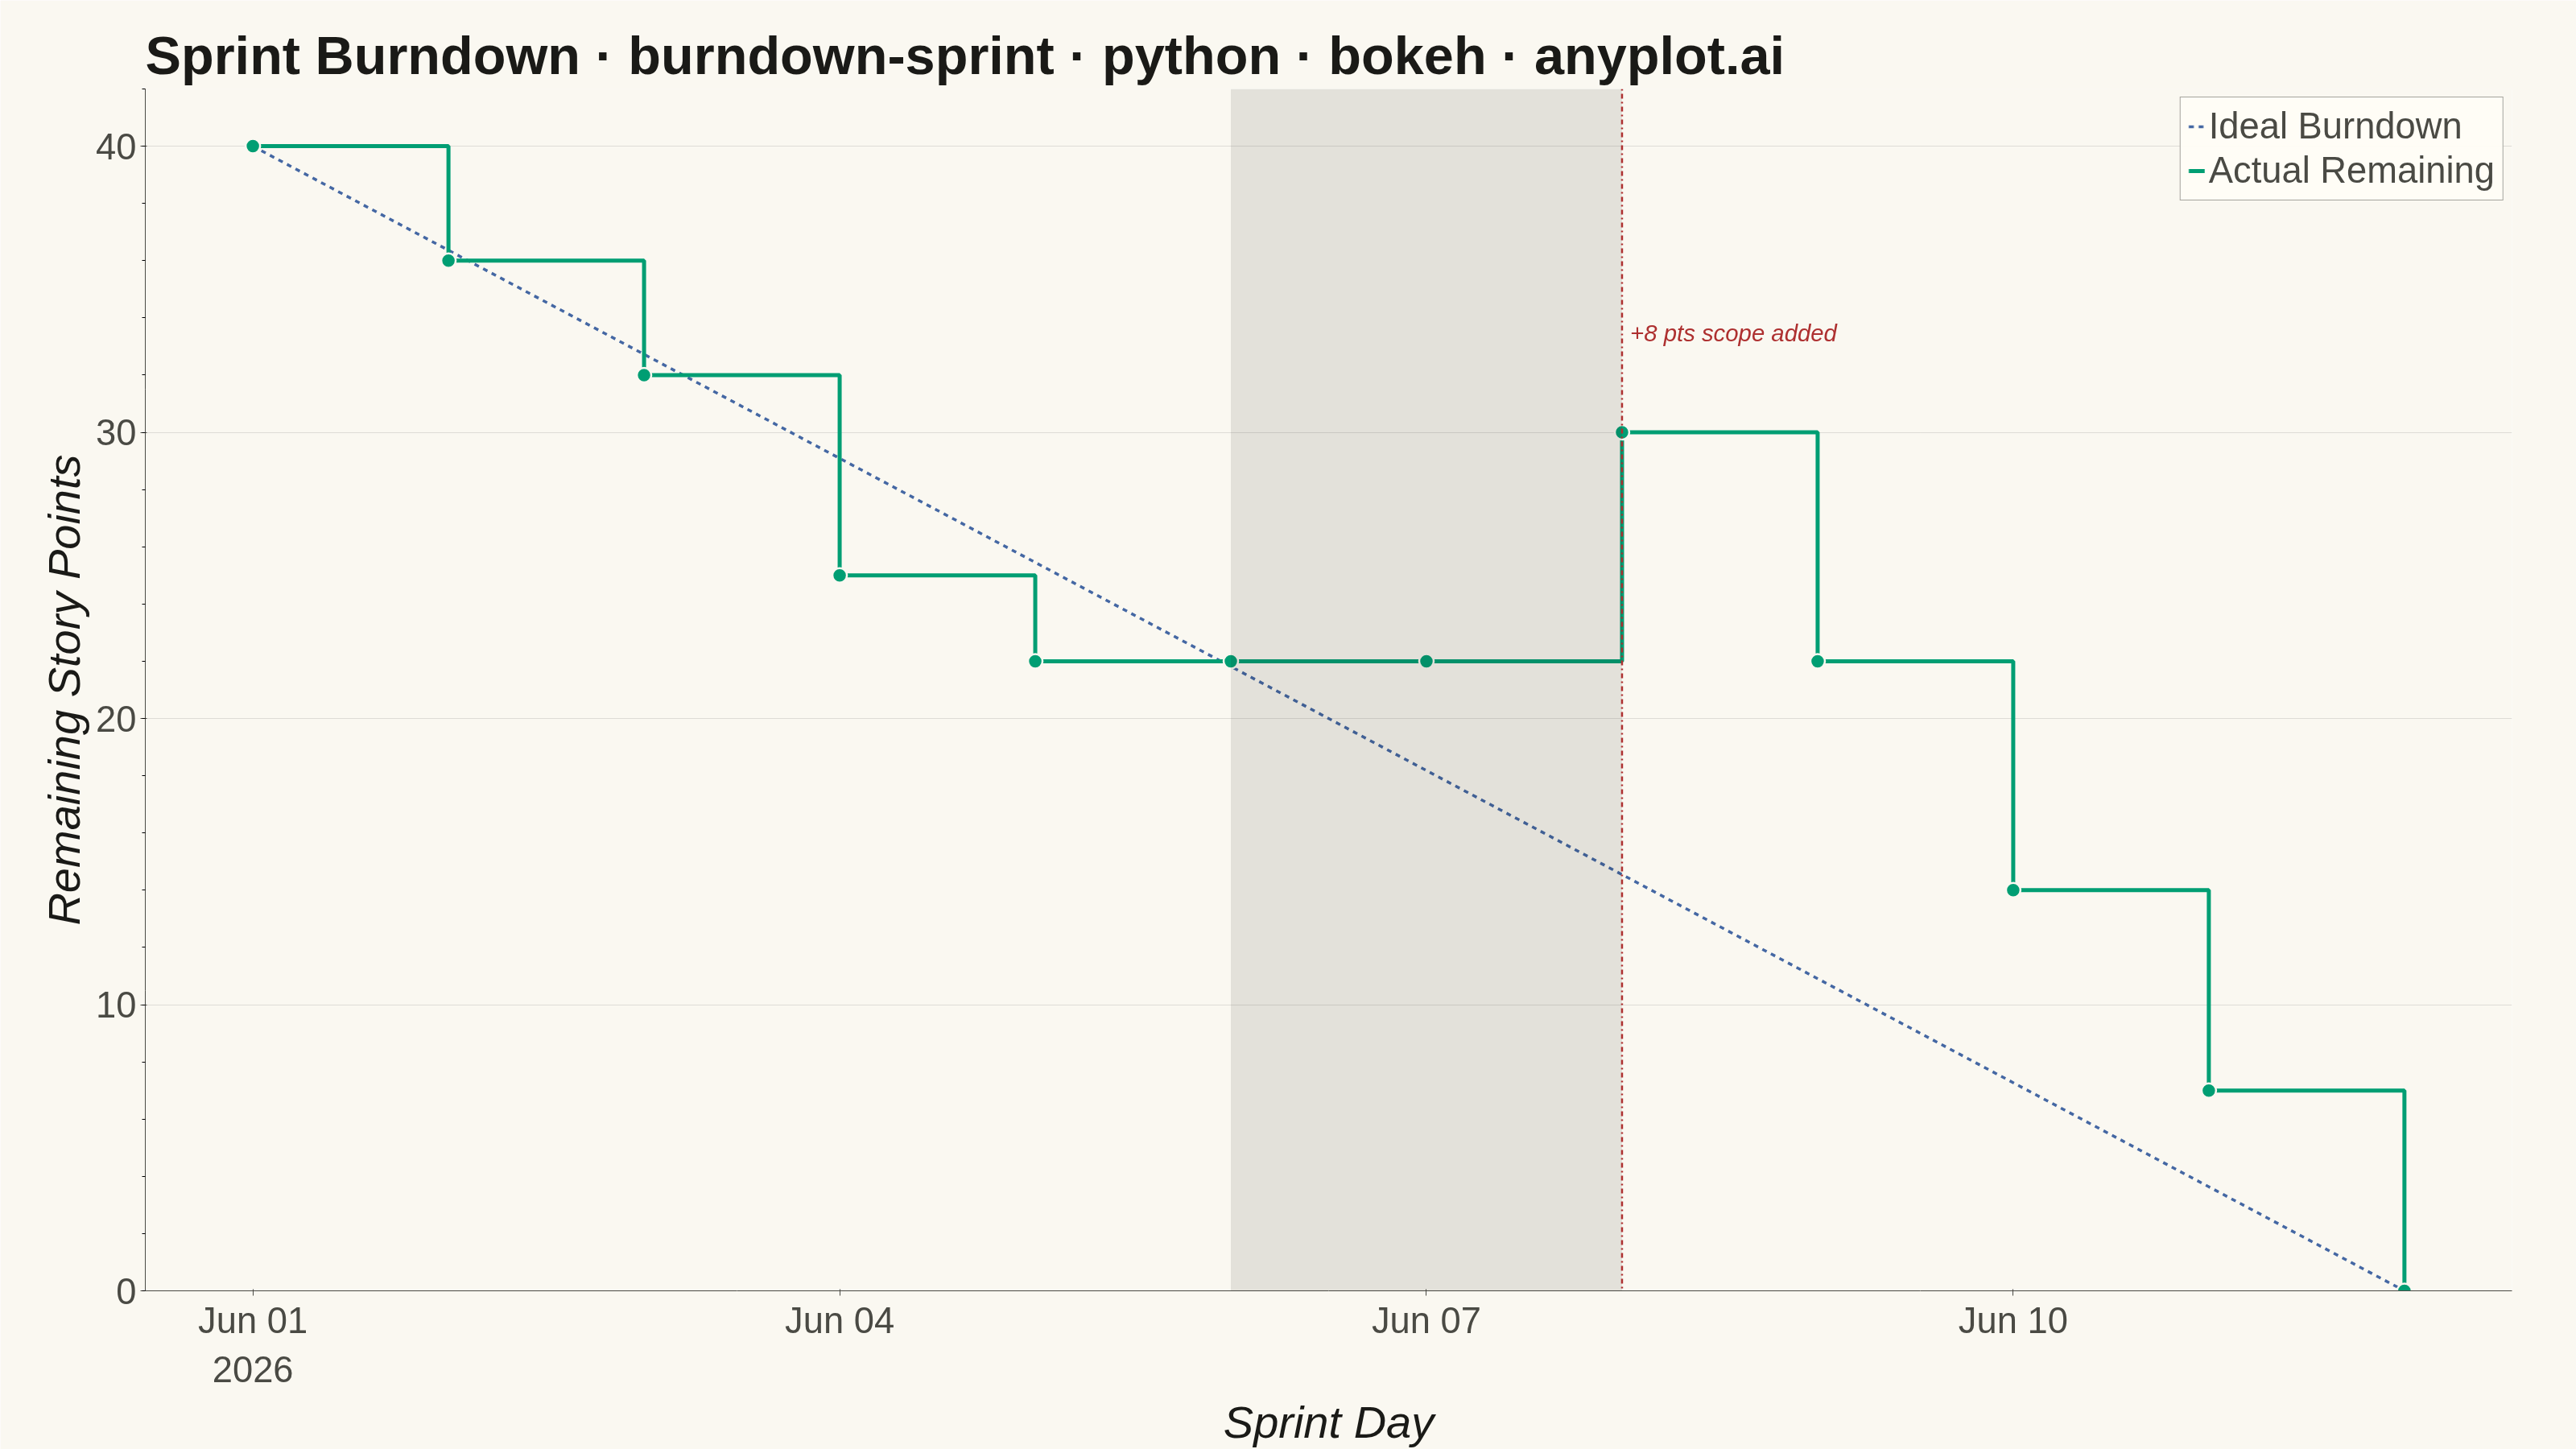
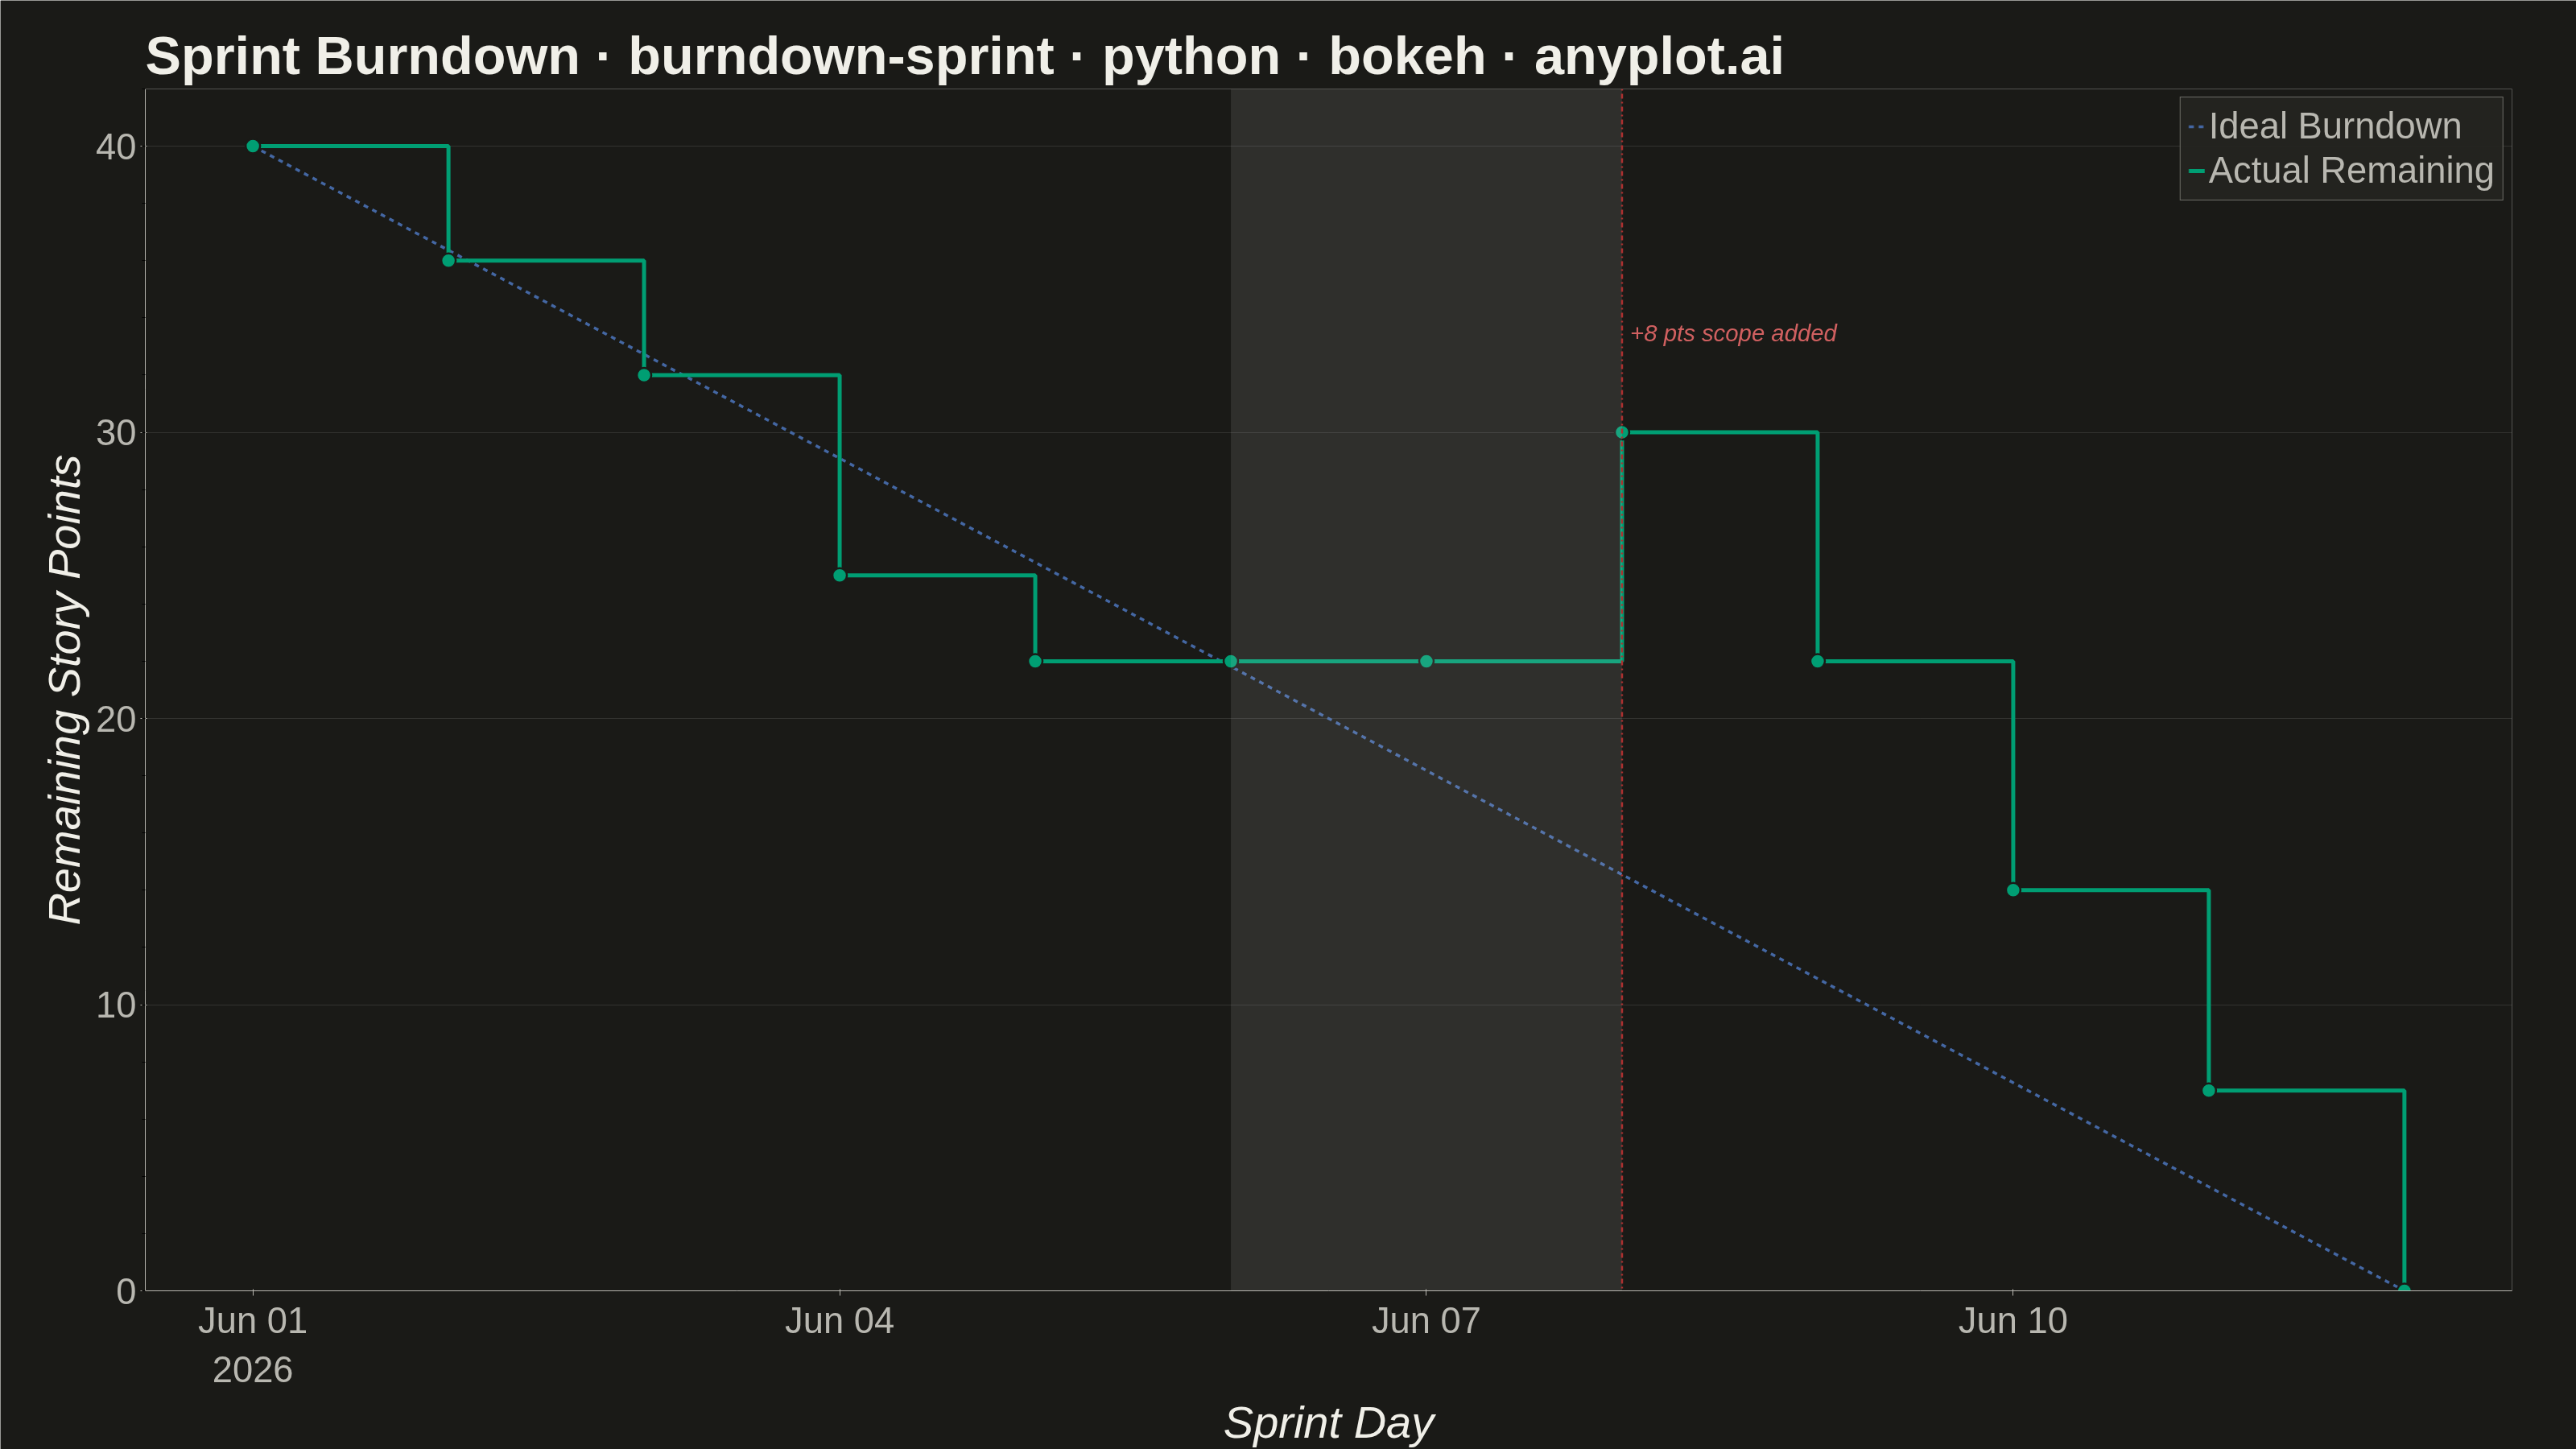
A sprint burndown chart tracks the amount of remaining work in an agile sprint over time, plotted as a step (or line) series that descends as tasks are completed. A straight ideal-burndown guideline runs diagonally from the total committed scope on day one down to zero on the final day, giving the team an at-a-glance reference for whether they are ahead of or behind schedule. It is one of the most widely used project-management visualizations in software development, surfacing scope creep, stalled progress, and end-of-sprint risk early enough to act on.
""" anyplot.ai
burndown-sprint: Agile Sprint Burndown Chart
Library: bokeh 3.9.1 | Python 3.13.13
Quality: 86/100 | Created: 2026-06-14
"""

import io
import os
import sys
import time
from datetime import date, datetime, timezone
from pathlib import Path


# Remove current dir from sys.path so bokeh.py doesn't shadow the bokeh package
sys.path = [p for p in sys.path if p != "" and not (os.path.isfile(os.path.join(p, "bokeh.py")) if p else False)]

from bokeh.io import output_file, save
from bokeh.models import BoxAnnotation, ColumnDataSource, Label, Span
from bokeh.plotting import figure
from PIL import Image
from selenium import webdriver
from selenium.webdriver.chrome.options import Options


# Theme tokens
THEME = os.getenv("ANYPLOT_THEME", "light")
PAGE_BG = "#FAF8F1" if THEME == "light" else "#1A1A17"
ELEVATED_BG = "#FFFDF6" if THEME == "light" else "#242420"
INK = "#1A1A17" if THEME == "light" else "#F0EFE8"
INK_SOFT = "#4A4A44" if THEME == "light" else "#B8B7B0"

# Imprint palette — canonical order, theme-independent
IMPRINT_PALETTE = ["#009E73", "#C475FD", "#4467A3", "#BD8233", "#AE3030", "#2ABCCD", "#954477", "#99B314"]
BRAND = IMPRINT_PALETTE[0]  # actual remaining (green)
IDEAL_CLR = IMPRINT_PALETTE[2]  # ideal burndown (blue)
SCOPE_CLR = IMPRINT_PALETTE[4]  # scope change marker (red — semantic: bad/risk)
# Lighter red for dark theme to meet WCAG large-text 3:1 contrast against #1A1A17
SCOPE_ANNOTATION_CLR = SCOPE_CLR if THEME == "light" else "#D06060"


# Data: 10-working-day sprint Jun 1–12 2026, weekends Jun 6–7
# Scope change on Jun 8: +8 pts added, so remaining jumps from 22 → 30
sprint_dates = [
    date(2026, 6, 1),  # Mon WD1 — sprint start
    date(2026, 6, 2),  # Tue WD2
    date(2026, 6, 3),  # Wed WD3
    date(2026, 6, 4),  # Thu WD4
    date(2026, 6, 5),  # Fri WD5
    date(2026, 6, 6),  # Sat — weekend (flat)
    date(2026, 6, 7),  # Sun — weekend (flat)
    date(2026, 6, 8),  # Mon WD6 — scope added (+8 pts)
    date(2026, 6, 9),  # Tue WD7
    date(2026, 6, 10),  # Wed WD8
    date(2026, 6, 11),  # Thu WD9
    date(2026, 6, 12),  # Fri WD10 — sprint end
]
remaining = [40, 36, 32, 25, 22, 22, 22, 30, 22, 14, 7, 0]

n = len(sprint_dates)
ideal = [40 * (1 - i / (n - 1)) for i in range(n)]

dates_ms = [datetime(d.year, d.month, d.day, tzinfo=timezone.utc).timestamp() * 1000 for d in sprint_dates]
weekend_start_ms = datetime(2026, 6, 6, tzinfo=timezone.utc).timestamp() * 1000
weekend_end_ms = datetime(2026, 6, 7, tzinfo=timezone.utc).timestamp() * 1000 + 86_400_000
scope_ms = datetime(2026, 6, 8, tzinfo=timezone.utc).timestamp() * 1000

# Title — 63 chars, under 67 baseline, so title_pt stays at 50
TITLE = "Sprint Burndown · burndown-sprint · python · bokeh · anyplot.ai"
title_pt = max(34, round(50 * 67 / len(TITLE))) if len(TITLE) > 67 else 50

# Plot
source = ColumnDataSource(data={"dates": dates_ms, "remaining": remaining, "ideal": ideal})

p = figure(
    width=3200,
    height=1800,
    x_axis_type="datetime",
    title=TITLE,
    x_axis_label="Sprint Day",
    y_axis_label="Remaining Story Points",
    toolbar_location=None,
    min_border_bottom=160,
    min_border_left=180,
    min_border_top=110,
    min_border_right=80,
)

# Weekend shading (subtle band — flat segments in the burndown fall on weekends)
p.add_layout(
    BoxAnnotation(left=weekend_start_ms, right=weekend_end_ms, fill_color=INK, fill_alpha=0.10, line_color=None)
)

# Ideal burndown — straight reference line (blue dashed)
p.line(
    x="dates",
    y="ideal",
    source=source,
    line_color=IDEAL_CLR,
    line_width=3.5,
    line_dash="dashed",
    legend_label="Ideal Burndown",
)

# Actual remaining — step series (green, mode=after: steps down at day-end)
p.step(
    x="dates",
    y="remaining",
    source=source,
    mode="after",
    line_color=BRAND,
    line_width=5,
    legend_label="Actual Remaining",
)

# Day-end dots on actual remaining for each data point
p.scatter(x="dates", y="remaining", source=source, size=18, color=BRAND, line_color=PAGE_BG, line_width=2.5)

# Scope change vertical marker (red dotdash line)
p.add_layout(Span(location=scope_ms, dimension="height", line_color=SCOPE_CLR, line_width=2.5, line_dash="dotdash"))

# Scope change annotation — lighter red on dark theme for WCAG 3:1 contrast
p.add_layout(
    Label(
        x=scope_ms + 3_600_000,  # 1 hr right of the span
        y=33,
        text="+8 pts scope added",
        text_color=SCOPE_ANNOTATION_CLR,
        text_font_size="22pt",
        text_font_style="italic",
    )
)

# Y-axis floor at 0
p.y_range.start = 0

# Style — theme-adaptive chrome
p.background_fill_color = PAGE_BG
p.border_fill_color = PAGE_BG
p.outline_line_color = None  # remove 4-sided border; axes provide L-shaped frame

p.title.text_font_size = f"{title_pt}pt"
p.title.text_color = INK

p.xaxis.axis_label_text_font_size = "42pt"
p.yaxis.axis_label_text_font_size = "42pt"
p.xaxis.major_label_text_font_size = "34pt"
p.yaxis.major_label_text_font_size = "34pt"

p.xaxis.axis_label_text_color = INK
p.yaxis.axis_label_text_color = INK
p.xaxis.major_label_text_color = INK_SOFT
p.yaxis.major_label_text_color = INK_SOFT
p.xaxis.axis_line_color = INK_SOFT
p.yaxis.axis_line_color = INK_SOFT
p.xaxis.major_tick_line_color = INK_SOFT
p.yaxis.major_tick_line_color = INK_SOFT

p.xgrid.grid_line_color = None  # no x-grid for cleaner time-series look
p.ygrid.grid_line_color = INK
p.ygrid.grid_line_alpha = 0.12

p.legend.background_fill_color = ELEVATED_BG
p.legend.border_line_color = INK_SOFT
p.legend.label_text_color = INK_SOFT
p.legend.label_text_font_size = "34pt"
p.legend.location = "top_right"

# Save HTML (interactive catalog artifact)
output_file(f"plot-{THEME}.html")
save(p)

# Screenshot with headless Chrome — window taller than target so browser chrome
# overhead doesn't clip the figure; PIL crops to exact 3200×1800 canvas.
FIG_W, FIG_H = 3200, 1800
WIN_W, WIN_H = FIG_W, FIG_H + 200
opts = Options()
for arg in (
    "--headless=new",
    "--no-sandbox",
    "--disable-dev-shm-usage",
    "--disable-gpu",
    "--force-device-scale-factor=1",
    f"--window-size={WIN_W},{WIN_H}",
    "--hide-scrollbars",
):
    opts.add_argument(arg)
driver = webdriver.Chrome(options=opts)
driver.set_window_size(WIN_W, WIN_H)
driver.get(f"file://{Path(f'plot-{THEME}.html').resolve()}")
time.sleep(3)
raw = driver.get_screenshot_as_png()
driver.quit()
Image.open(io.BytesIO(raw)).crop((0, 0, FIG_W, FIG_H)).save(f"plot-{THEME}.png")
Runnable source as JSON, for any HTTP client: https://api.anyplot.ai/specs/burndown-sprint/bokeh/code. Any spec id and library id listed in llms-full.txt fit the same URL shape; every URL below is complete and callable.
{
  "spec_id": "burndown-sprint",
  "language": "python",
  "library": "bokeh",
  "page": "https://anyplot.ai/burndown-sprint/python/bokeh",
  "hub": "https://anyplot.ai/burndown-sprint",
  "code_json": "https://api.anyplot.ai/specs/burndown-sprint/bokeh/code",
  "spec_json": "https://api.anyplot.ai/specs/burndown-sprint",
  "render_light_png": "https://storage.googleapis.com/anyplot-images/plots/burndown-sprint/python/bokeh/plot-light.png",
  "render_dark_png": "https://storage.googleapis.com/anyplot-images/plots/burndown-sprint/python/bokeh/plot-dark.png",
  "interactive_light_html": "https://storage.googleapis.com/anyplot-images/plots/burndown-sprint/python/bokeh/plot-light.html",
  "interactive_dark_html": "https://storage.googleapis.com/anyplot-images/plots/burndown-sprint/python/bokeh/plot-dark.html",
  "quality_score": 86.0,
  "license": "MIT",
  "guide": "https://anyplot.ai/llms.txt"
}
Part of Agile Sprint Burndown Chart on anyplot.ai.