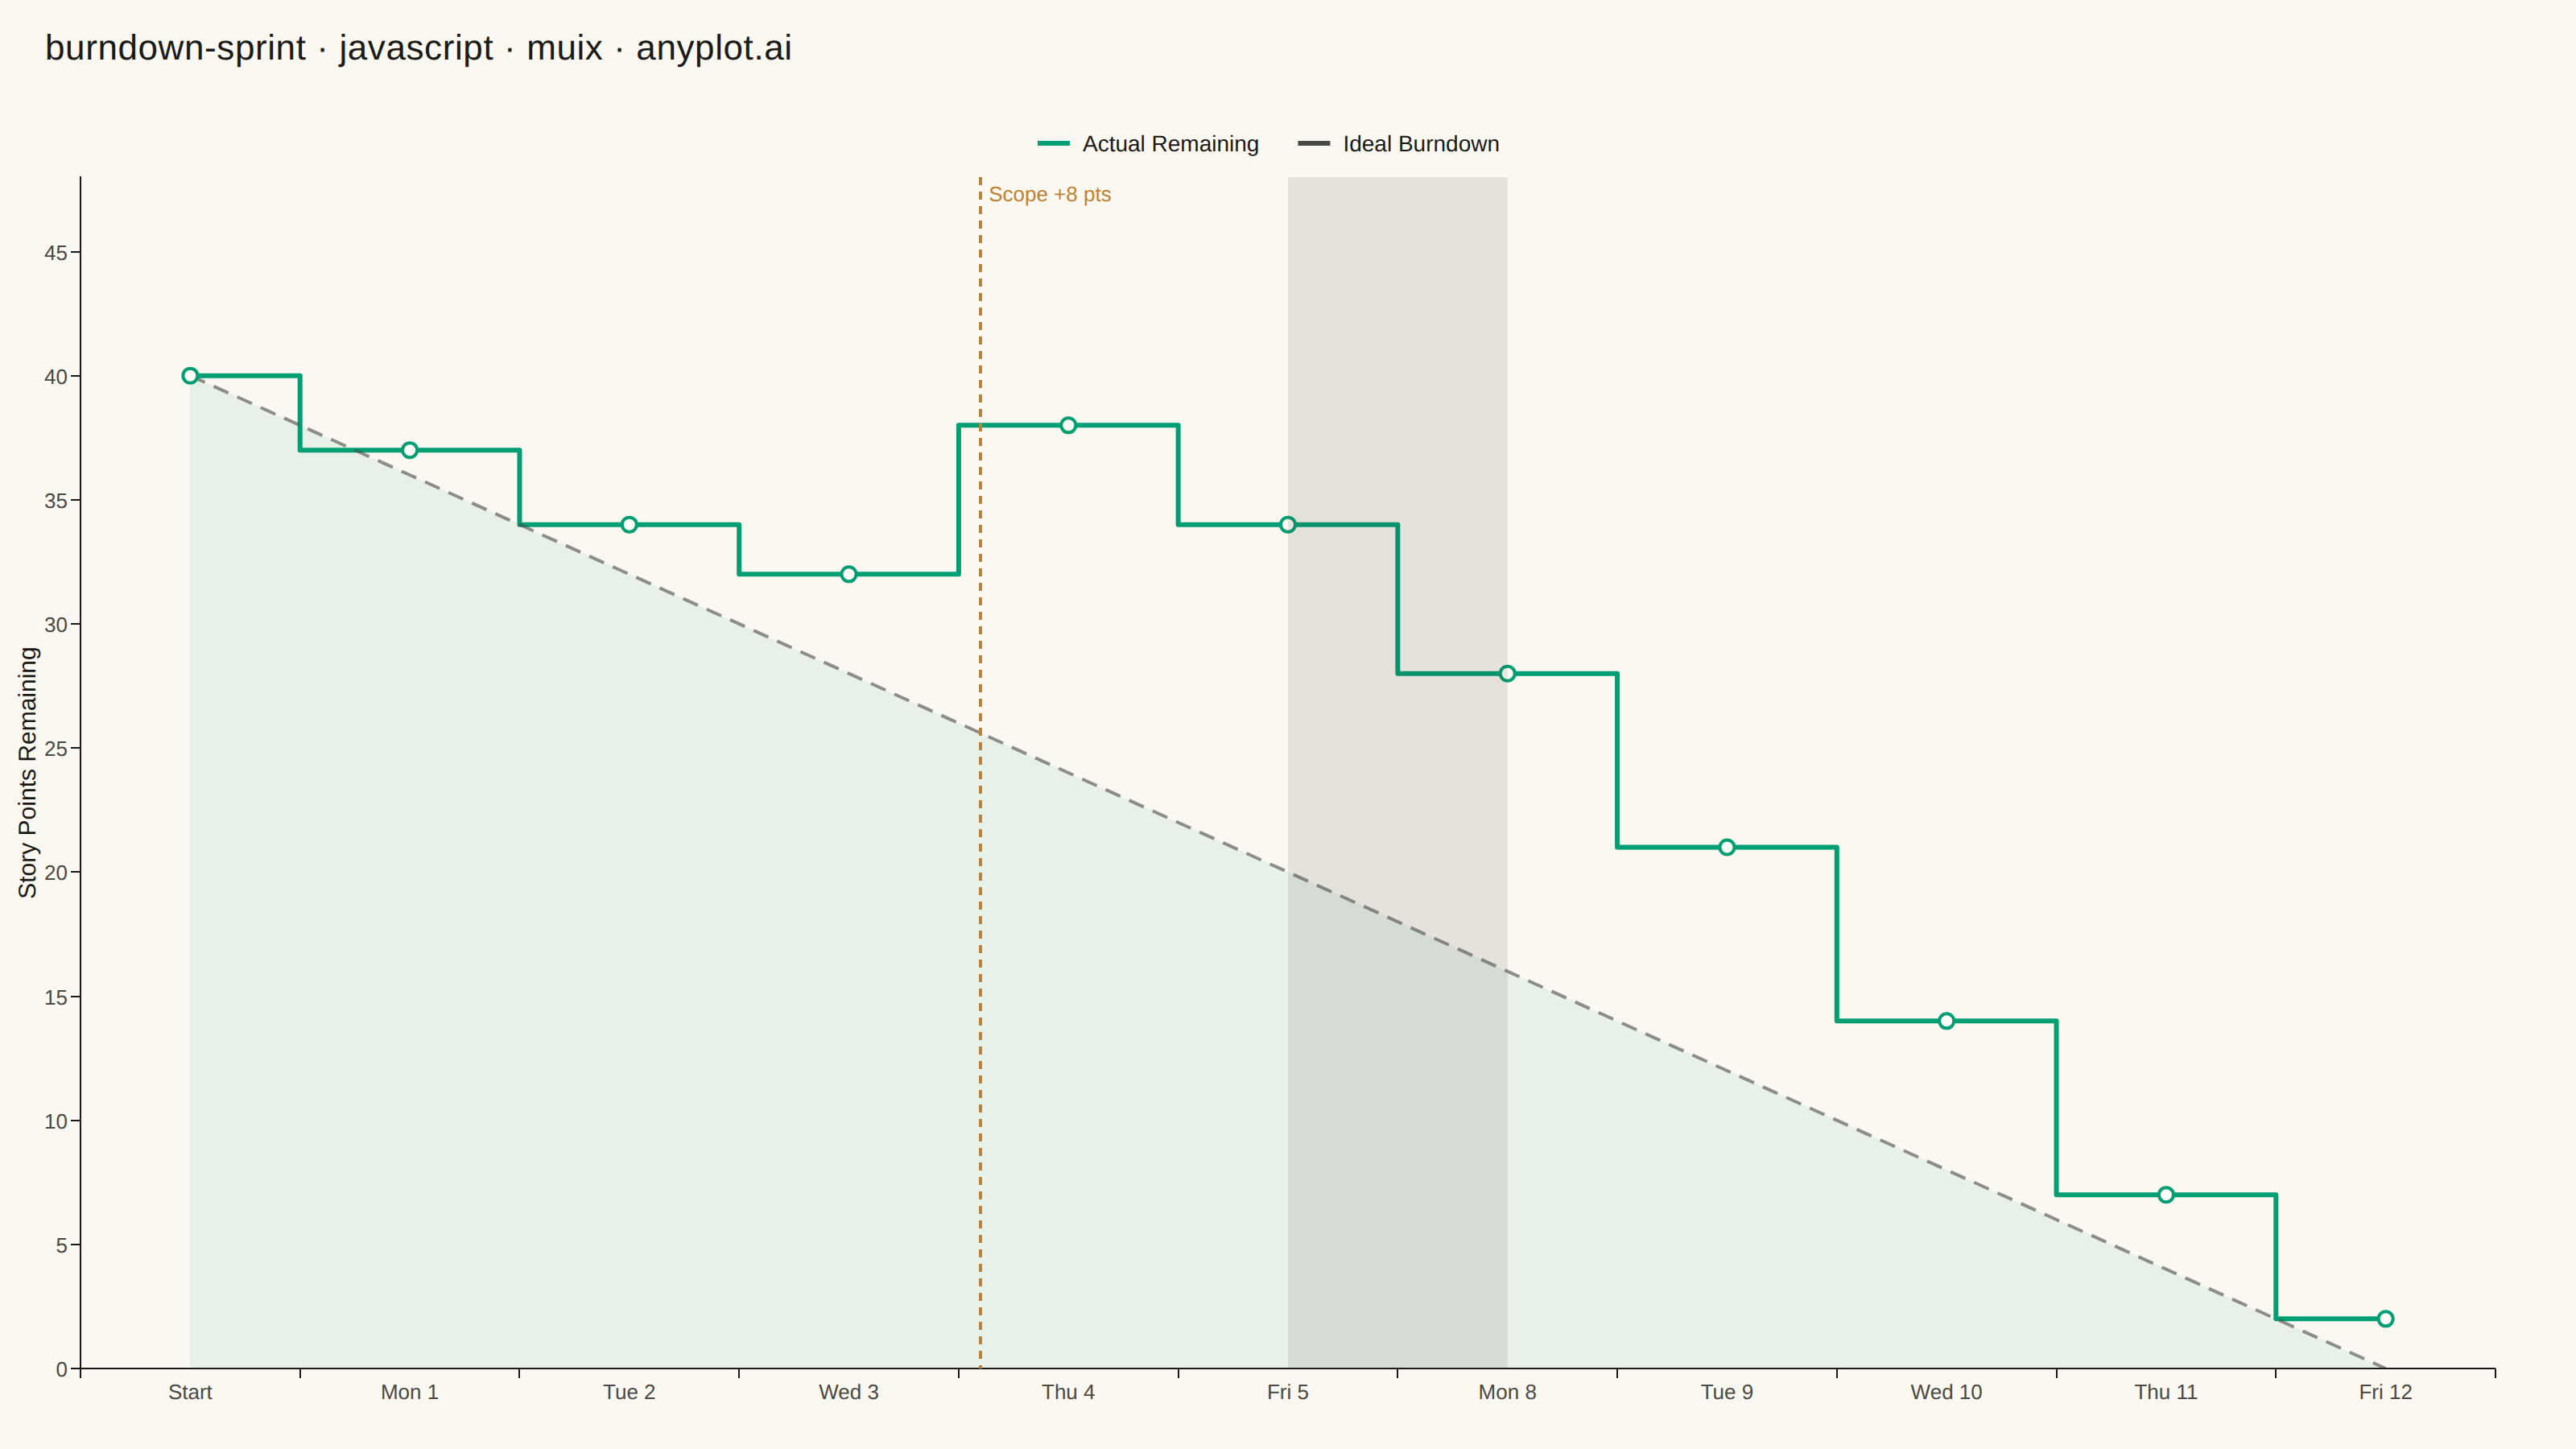
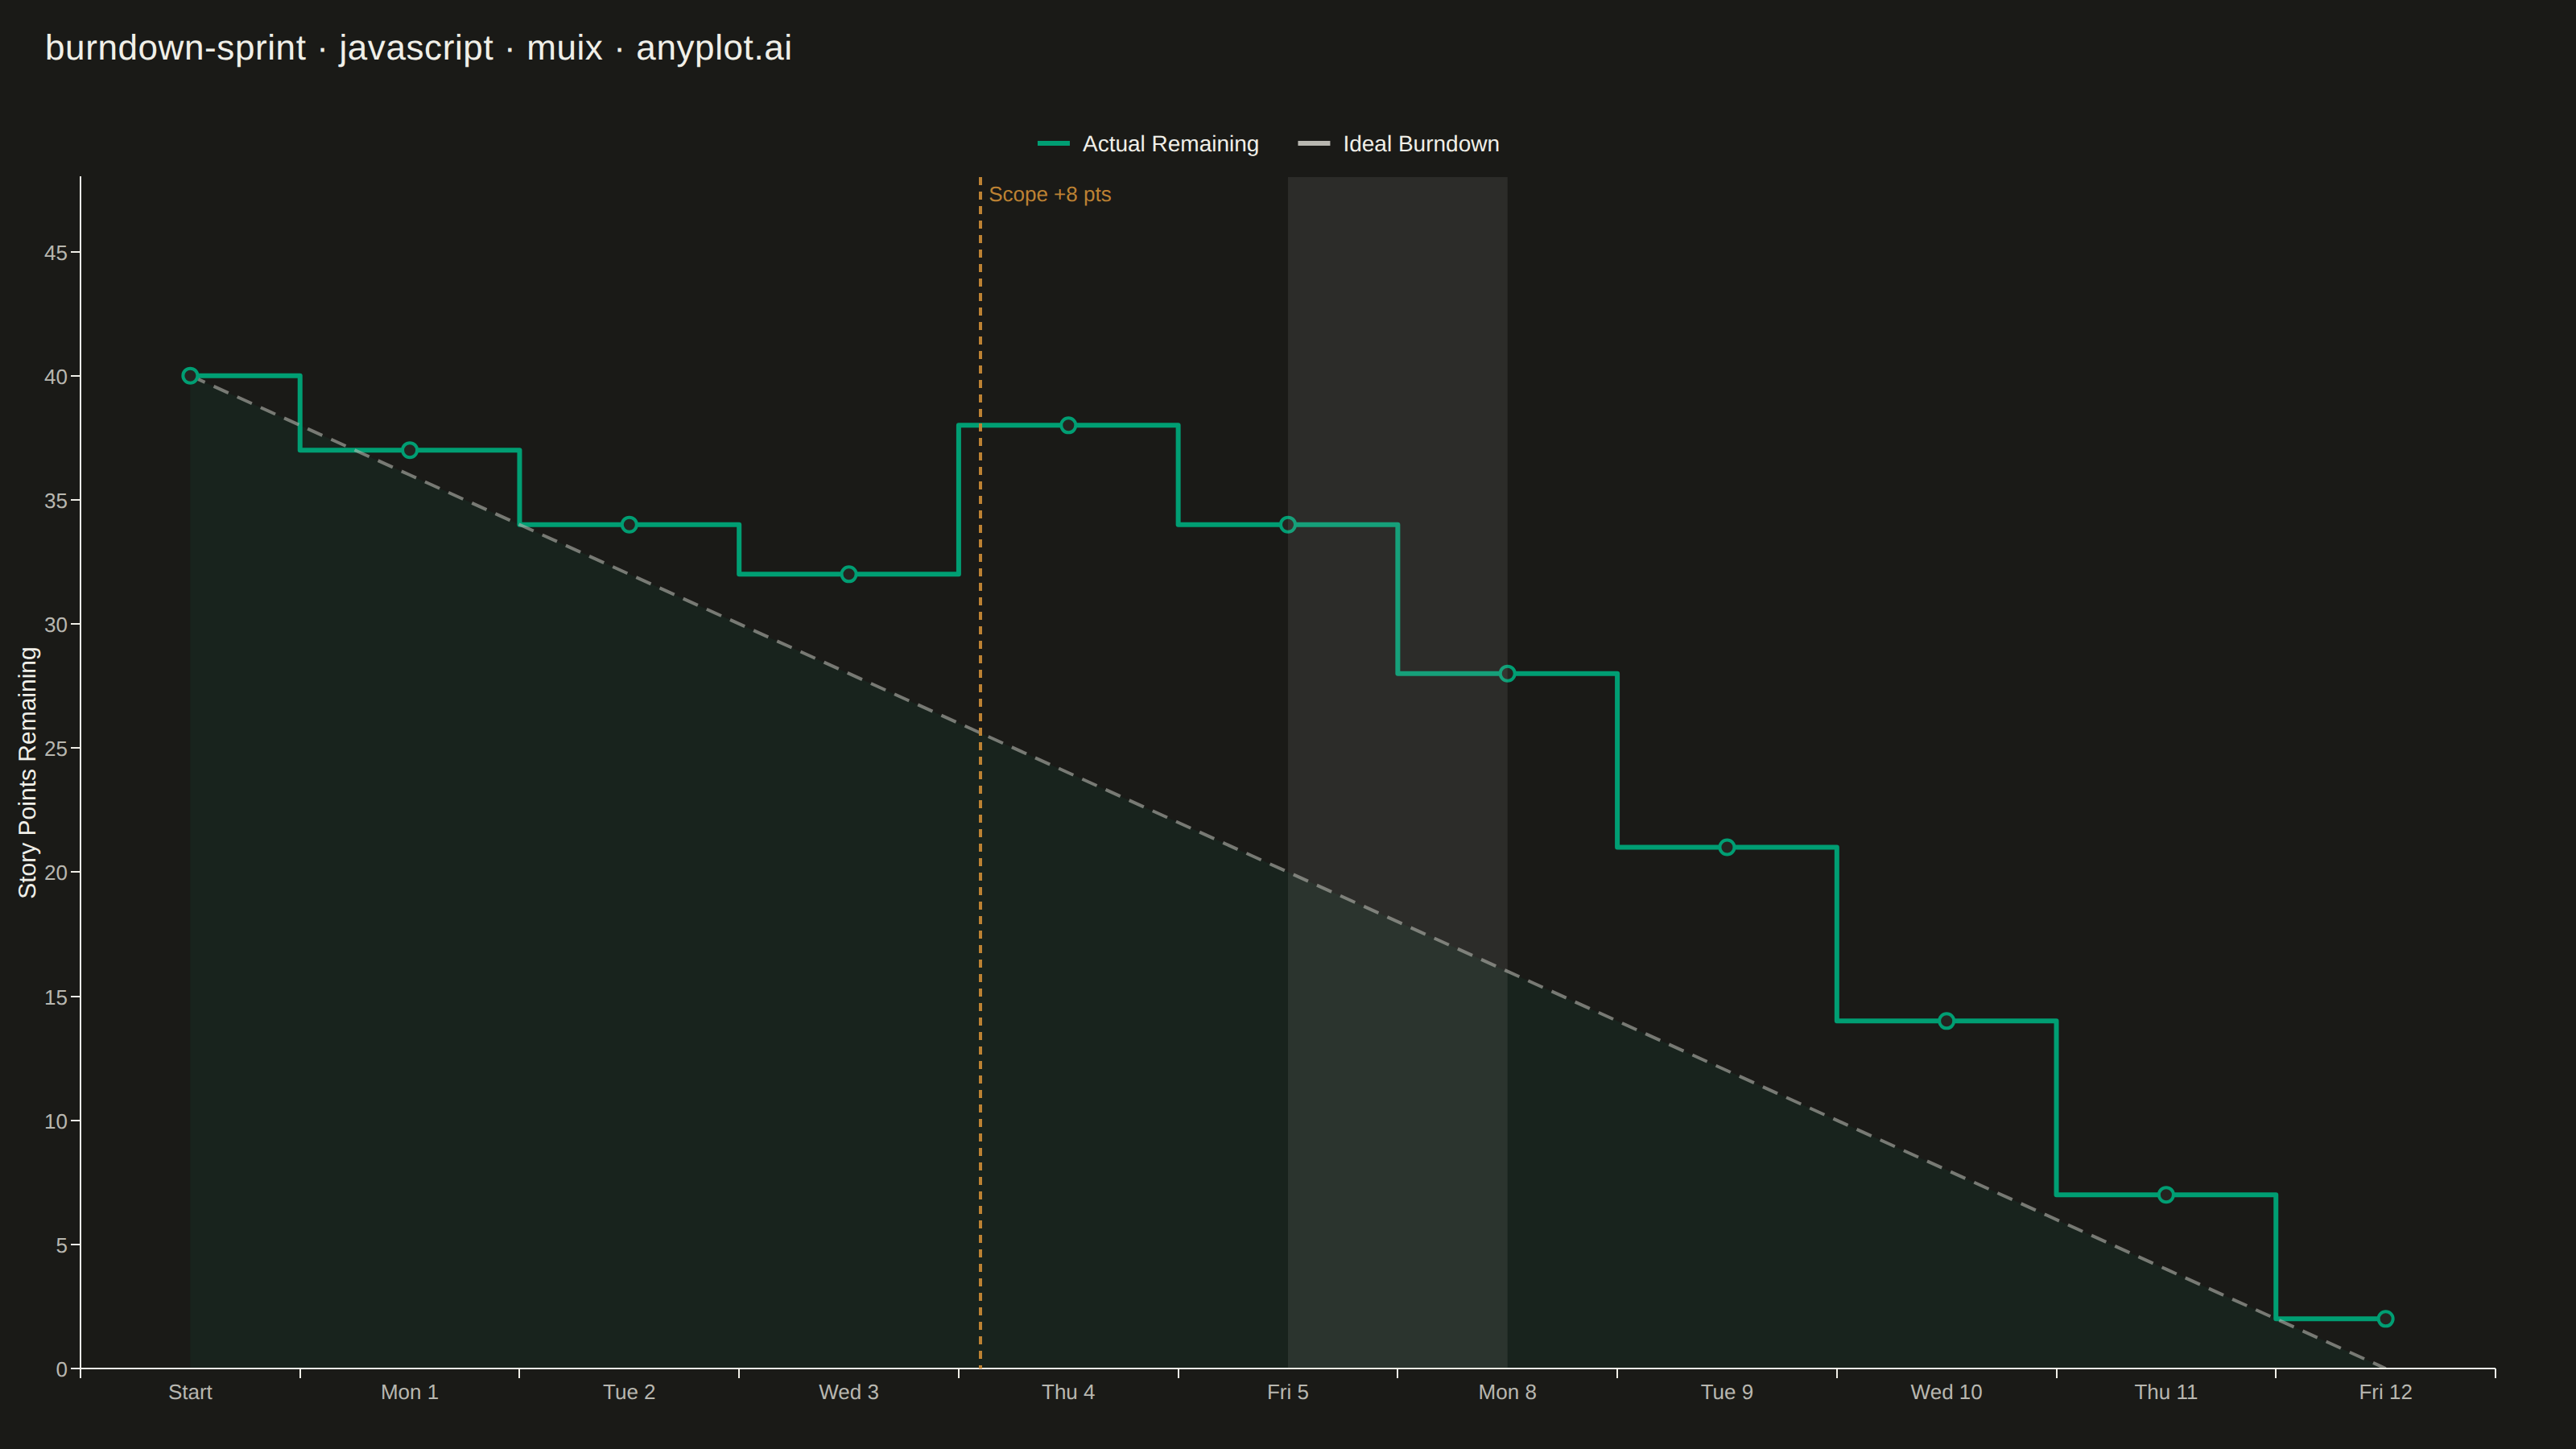
A sprint burndown chart tracks the amount of remaining work in an agile sprint over time, plotted as a step (or line) series that descends as tasks are completed. A straight ideal-burndown guideline runs diagonally from the total committed scope on day one down to zero on the final day, giving the team an at-a-glance reference for whether they are ahead of or behind schedule. It is one of the most widely used project-management visualizations in software development, surfacing scope creep, stalled progress, and end-of-sprint risk early enough to act on.
// anyplot.ai
// burndown-sprint: Agile Sprint Burndown Chart
// Library: muix 7.29.1 | JavaScript 22.22.3
// Quality: 91/100 | Created: 2026-06-14

import { LineChart } from "@mui/x-charts/LineChart";
import { ChartsReferenceLine } from "@mui/x-charts";
import { useXScale, useDrawingArea } from "@mui/x-charts/hooks";

const t = window.ANYPLOT_TOKENS;

// Sprint: start state + 10 working days (2 weeks Mon–Fri)
// Scope change: +8 story points added by stakeholder on Thu of Week 1 (Day 4)
const days = [
  "Start",
  "Mon 1", "Tue 2", "Wed 3", "Thu 4", "Fri 5",
  "Mon 8", "Tue 9", "Wed 10", "Thu 11", "Fri 12",
];

// Remaining story points recorded at end of each day.
// Thu 4: team completed 2 pts but +8 scope added → jump from 32 to 38
const actual = [40, 37, 34, 32, 38, 34, 28, 21, 14, 7, 2];

// Ideal burndown: straight line from 40 → 0 across 10 working days (4 pts/day)
const ideal = [40, 36, 32, 28, 24, 20, 16, 12, 8, 4, 0];

const TITLE_H = 60;

// SVG overlay: shades the Fri→Mon gap to represent the weekend break
function WeekendBand() {
  const xScale = useXScale();
  const { top, height } = useDrawingArea();

  if (typeof xScale.bandwidth !== "function") return null;

  const bw = xScale.bandwidth();
  const x1 = xScale("Fri 5");
  const x2 = xScale("Mon 8");

  if (x1 == null || x2 == null) return null;

  // Shade from the mid-point of Fri 5 to mid-point of Mon 8 (one bandwidth wide)
  // — visually straddles the weekend discontinuity between the two adjacent bands
  const rectX = x1 + bw * 0.5;
  const rectW = x2 + bw * 0.5 - rectX;

  return (
    <rect
      x={rectX}
      y={top}
      width={rectW}
      height={height}
      fill={t.inkSoft}
      fillOpacity={0.12}
    />
  );
}

export default function Chart() {
  const { width, height } = window.ANYPLOT_SIZE;

  return (
    <div
      style={{
        width,
        height,
        background: t.pageBg,
        overflow: "hidden",
        boxSizing: "border-box",
        fontFamily: "'Roboto', 'Helvetica Neue', Arial, sans-serif",
      }}
    >
      <div
        style={{
          height: TITLE_H,
          display: "flex",
          alignItems: "center",
          paddingLeft: 28,
          paddingRight: 28,
        }}
      >
        <span
          style={{
            color: t.ink,
            fontSize: 22,
            fontWeight: 500,
            letterSpacing: 0.3,
          }}
        >
          burndown-sprint · javascript · muix · anyplot.ai
        </span>
      </div>

      <LineChart
        width={width}
        height={height - TITLE_H}
        skipAnimation
        xAxis={[{
          scaleType: "band",
          data: days,
          tickLabelStyle: { fontSize: 13, fill: t.inkSoft },
        }]}
        yAxis={[{
          label: "Story Points Remaining",
          min: 0,
          max: 48,
          tickLabelStyle: { fontSize: 13, fill: t.inkSoft },
          labelStyle: { fontSize: 15, fill: t.ink },
        }]}
        series={[
          {
            id: "actual",
            data: actual,
            label: "Actual Remaining",
            curve: "step",
            showMark: true,
            color: t.palette[0],
          },
          {
            id: "ideal",
            data: ideal,
            label: "Ideal Burndown",
            curve: "linear",
            showMark: false,
            color: t.inkSoft,
            area: true,
          },
        ]}
        sx={{
          "& .MuiLineElement-series-ideal": {
            strokeDasharray: "10 6",
            strokeOpacity: 0.6,
          },
          "& .MuiAreaElement-series-ideal": {
            fill: t.palette[0],
            fillOpacity: 0.07,
          },
          "& .MuiLineElement-series-actual": {
            strokeWidth: 3,
          },
          "& .MuiMarkElement-series-actual": {
            strokeWidth: 2,
          },
        }}
        slotProps={{
          legend: {
            itemMarkWidth: 20,
            itemMarkHeight: 3,
            markGap: 8,
            itemGap: 24,
            labelStyle: { fontSize: 14, fill: t.ink },
          },
        }}
      >
        {/* Weekend shading: straddled rect at Fri→Mon discontinuity */}
        <WeekendBand />

        <ChartsReferenceLine
          x="Thu 4"
          label="Scope +8 pts"
          labelAlign="start"
          lineStyle={{
            stroke: t.palette[3],
            strokeWidth: 2,
            strokeDasharray: "5 4",
          }}
          labelStyle={{
            fill: t.palette[3],
            fontSize: 13,
            fontWeight: 500,
          }}
        />
      </LineChart>
    </div>
  );
}
Runnable source as JSON, for any HTTP client: https://api.anyplot.ai/specs/burndown-sprint/muix/code. Any spec id and library id listed in llms-full.txt fit the same URL shape; every URL below is complete and callable.
{
  "spec_id": "burndown-sprint",
  "language": "javascript",
  "library": "muix",
  "page": "https://anyplot.ai/burndown-sprint/javascript/muix",
  "hub": "https://anyplot.ai/burndown-sprint",
  "code_json": "https://api.anyplot.ai/specs/burndown-sprint/muix/code",
  "spec_json": "https://api.anyplot.ai/specs/burndown-sprint",
  "render_light_png": "https://storage.googleapis.com/anyplot-images/plots/burndown-sprint/javascript/muix/plot-light.png",
  "render_dark_png": "https://storage.googleapis.com/anyplot-images/plots/burndown-sprint/javascript/muix/plot-dark.png",
  "interactive_light_html": "https://storage.googleapis.com/anyplot-images/plots/burndown-sprint/javascript/muix/plot-light.html",
  "interactive_dark_html": "https://storage.googleapis.com/anyplot-images/plots/burndown-sprint/javascript/muix/plot-dark.html",
  "quality_score": 91.0,
  "license": "MIT",
  "guide": "https://anyplot.ai/llms.txt"
}
Part of Agile Sprint Burndown Chart on anyplot.ai.