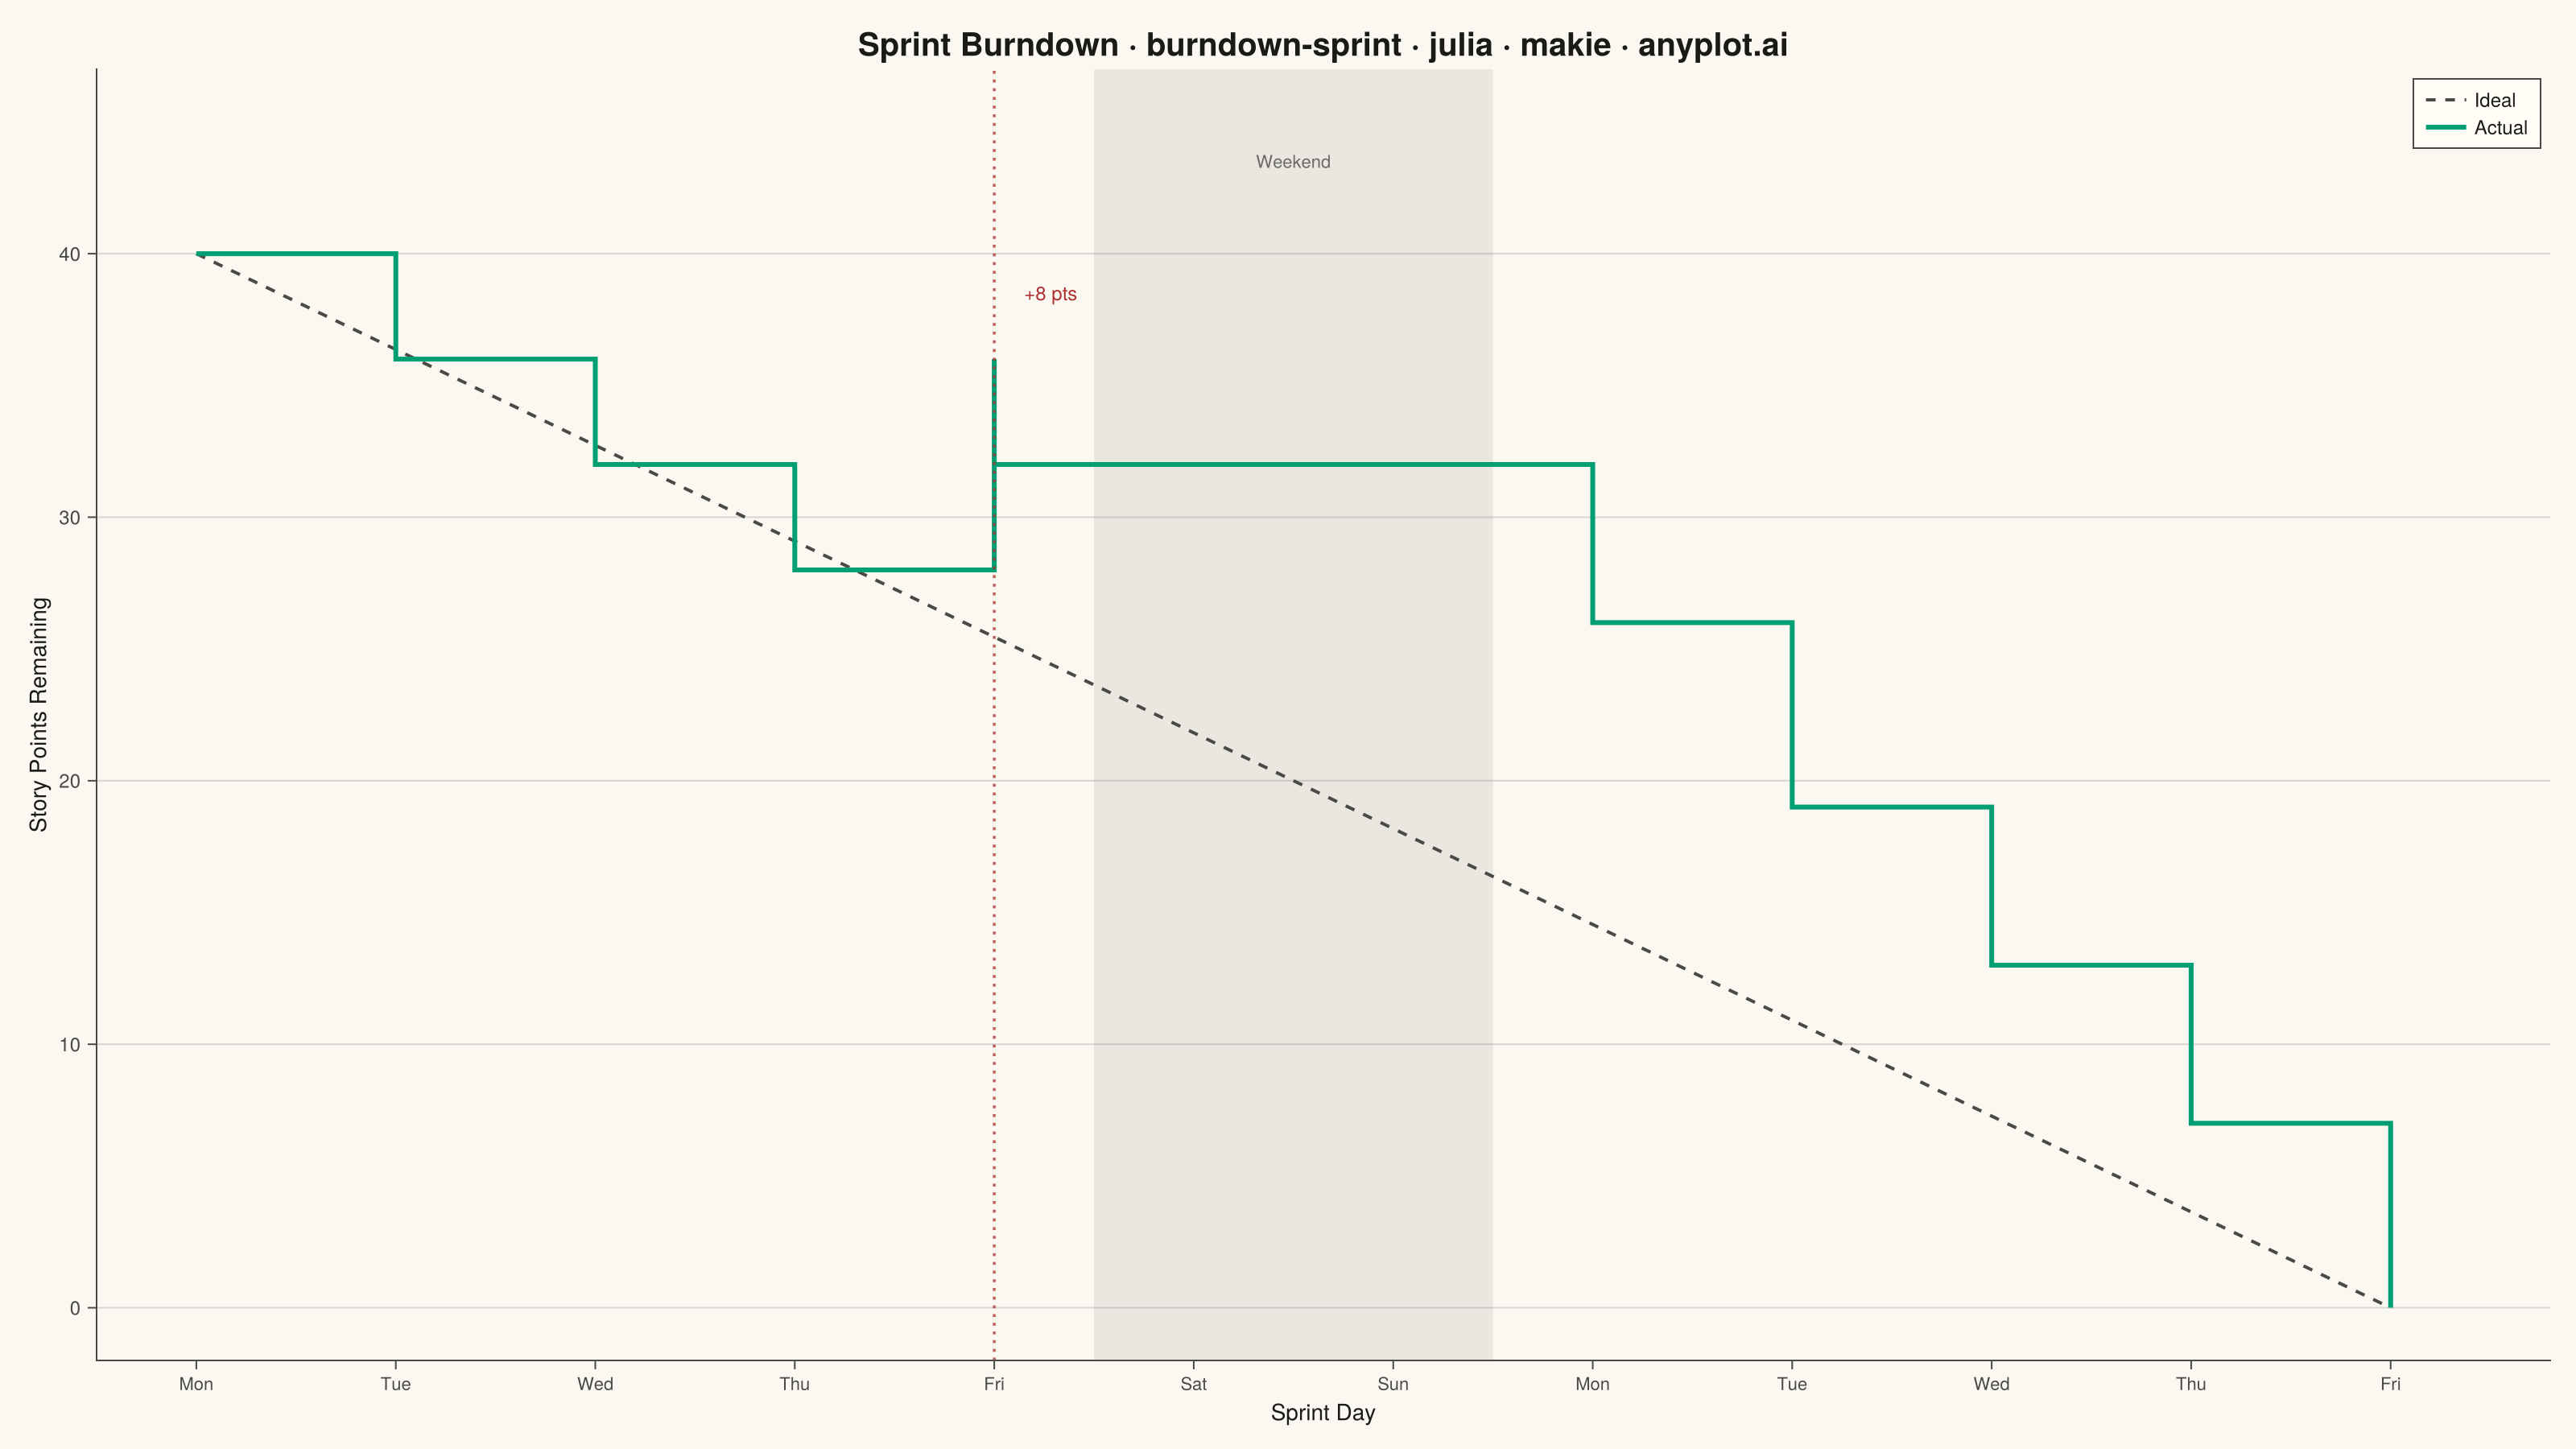
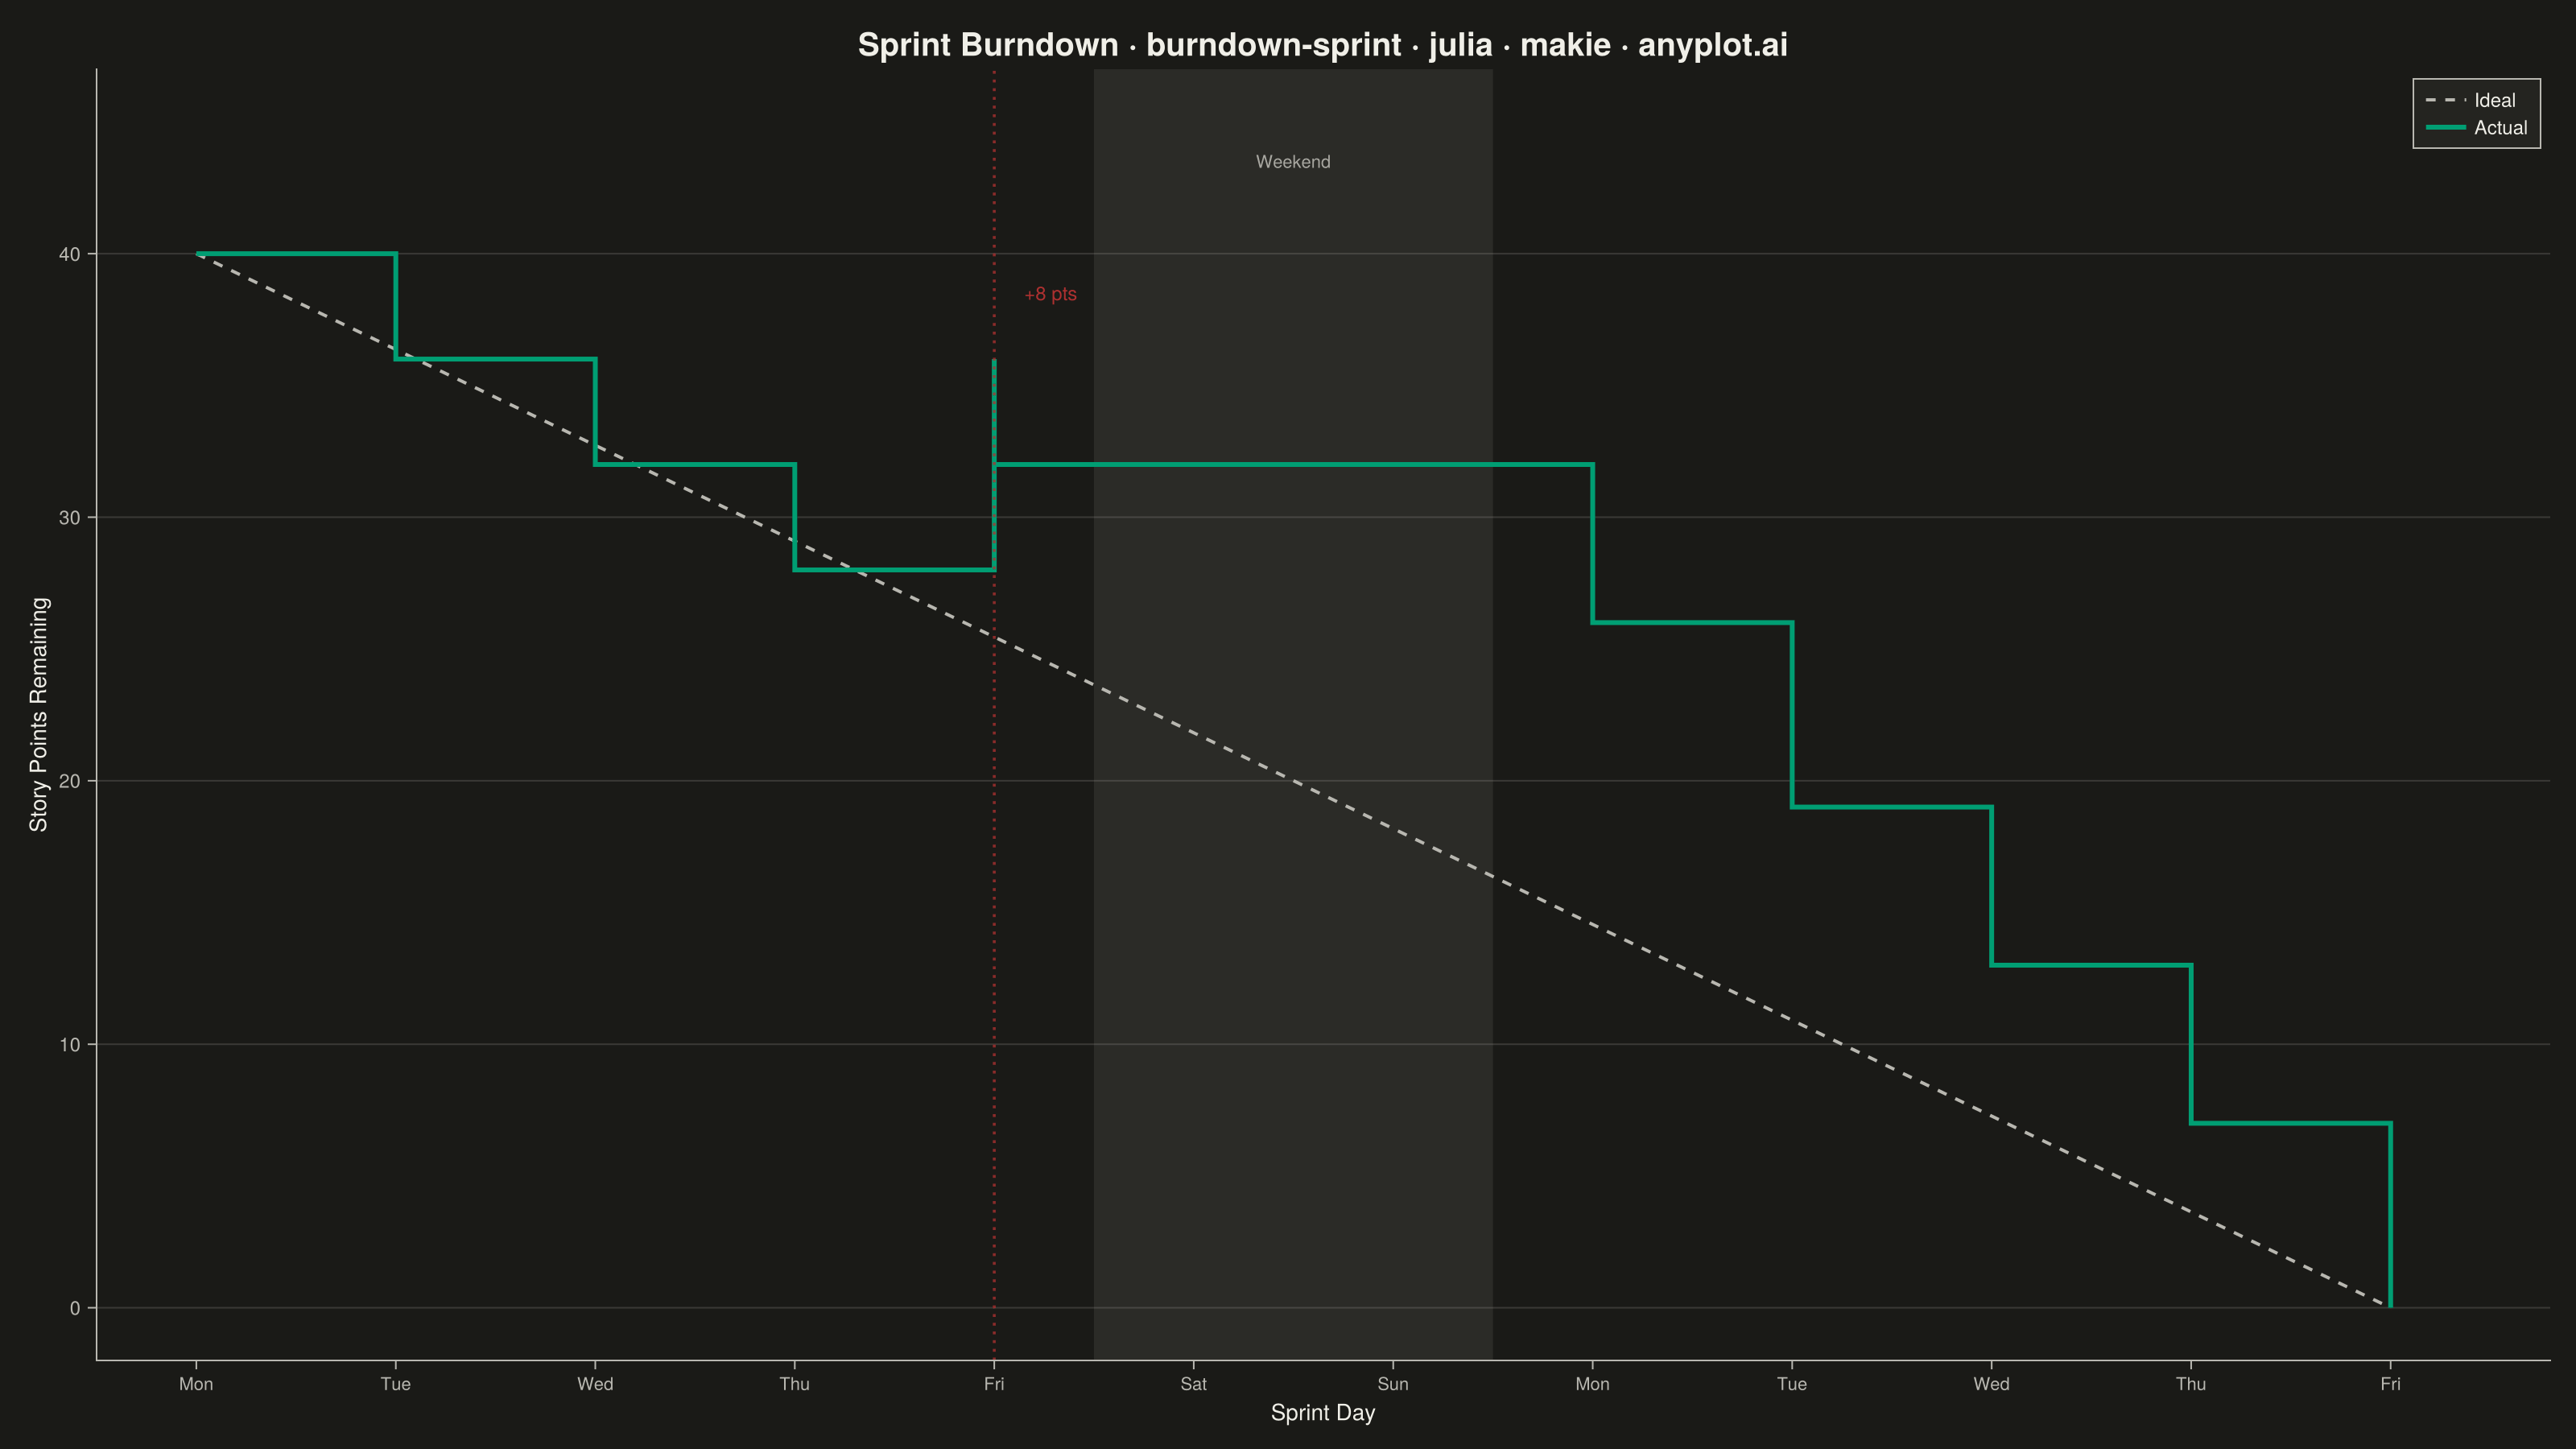
A sprint burndown chart tracks the amount of remaining work in an agile sprint over time, plotted as a step (or line) series that descends as tasks are completed. A straight ideal-burndown guideline runs diagonally from the total committed scope on day one down to zero on the final day, giving the team an at-a-glance reference for whether they are ahead of or behind schedule. It is one of the most widely used project-management visualizations in software development, surfacing scope creep, stalled progress, and end-of-sprint risk early enough to act on.
# anyplot.ai
# burndown-sprint: Agile Sprint Burndown Chart
# Library: makie 0.22.10 | Julia 1.11.9
# Quality: 90/100 | Created: 2026-06-14

using CairoMakie
using Colors
using Random

Random.seed!(42)

# Theme tokens (Imprint palette — see prompts/default-style-guide.md)
const THEME       = get(ENV, "ANYPLOT_THEME", "light")
const PAGE_BG     = THEME == "light" ? colorant"#FAF8F1" : colorant"#1A1A17"
const ELEVATED_BG = THEME == "light" ? colorant"#FFFDF6" : colorant"#242420"
const INK         = THEME == "light" ? colorant"#1A1A17" : colorant"#F0EFE8"
const INK_SOFT    = THEME == "light" ? colorant"#4A4A44" : colorant"#B8B7B0"
const INK_MUTED   = THEME == "light" ? colorant"#6B6A63" : colorant"#A8A79F"
const IMPRINT_PALETTE = [
    colorant"#009E73",  # 1 brand green (Imprint palette — always first series)
    colorant"#C475FD",  # 2 lavender
    colorant"#4467A3",  # 3 blue
    colorant"#BD8233",  # 4 ochre
    colorant"#AE3030",  # 5 matte red (semantic anchor: bad / scope risk)
    colorant"#2ABCCD",  # 6 cyan
    colorant"#954477",  # 7 rose
    colorant"#99B314",  # 8 lime
]

# Sprint data: 10 working days (Mon-Fri × 2 weeks), 40 initial story points.
# Calendar days: 0=Mon 1=Tue 2=Wed 3=Thu 4=Fri 5=Sat 6=Sun 7=Mon … 11=Fri
# Scope change (+8 pts) added on day 4 (Friday, week 1) — visible as upward jump.
days_raw      = [0,  1,  2,  3,  4,  4,  7,  8,  9, 10, 11]
remaining_raw = [40, 36, 32, 28, 36, 32, 26, 19, 13,  7,  0]

# Build step-function from sprint data (pre-step: each value holds until the next x)
step_x = Float64[]
step_y = Float64[]
for i in eachindex(days_raw)
    push!(step_x, Float64(days_raw[i]))
    push!(step_y, Float64(remaining_raw[i]))
    if i < length(days_raw)
        push!(step_x, Float64(days_raw[i + 1]))
        push!(step_y, Float64(remaining_raw[i]))
    end
end

# Ideal burndown: straight diagonal from (0, 40) to (11, 0)
ideal_x = [0.0, 11.0]
ideal_y  = [40.0, 0.0]

# Title — includes descriptive prefix so "burndown-sprint" reads unambiguously
title_str = "Sprint Burndown · burndown-sprint · julia · makie · anyplot.ai"
n_chars   = length(title_str)
ratio     = n_chars > 67 ? 67.0 / n_chars : 1.0
title_fs  = max(14, round(Int, 20 * ratio))

# X-axis tick labels — weekday names for the 12 calendar days (0–11)
day_labels = ["Mon", "Tue", "Wed", "Thu", "Fri", "Sat", "Sun",
              "Mon", "Tue", "Wed", "Thu", "Fri"]

fig = Figure(
    size            = (1600, 900),
    fontsize        = 14,
    backgroundcolor = PAGE_BG,
)

ax = Axis(
    fig[1, 1];
    title             = title_str,
    titlesize         = title_fs,
    titlecolor        = INK,
    xlabel            = "Sprint Day",
    ylabel            = "Story Points Remaining",
    xlabelsize        = 14,
    ylabelsize        = 14,
    xticklabelsize    = 11,
    yticklabelsize    = 12,
    xlabelcolor       = INK,
    ylabelcolor       = INK,
    xticklabelcolor   = INK_SOFT,
    yticklabelcolor   = INK_SOFT,
    xtickcolor        = INK_SOFT,
    ytickcolor        = INK_SOFT,
    backgroundcolor   = PAGE_BG,
    topspinevisible   = false,
    rightspinevisible = false,
    leftspinecolor    = INK_SOFT,
    bottomspinecolor  = INK_SOFT,
    xgridvisible      = false,
    ygridcolor        = RGBAf(Float32(INK.r), Float32(INK.g), Float32(INK.b), 0.15f0),
    yminorgridvisible = false,
    xminorgridvisible = false,
    xticks            = (0:11, day_labels),
)

# Weekend band — calendar days 5 (Sat) and 6 (Sun)
vspan!(ax, 4.5, 6.5; color = (INK_MUTED, 0.12))

# Ideal burndown reference (dashed, muted — below ideal means ahead of schedule)
lines!(ax, ideal_x, ideal_y;
    color     = INK_SOFT,
    linewidth = 2.0,
    linestyle = :dash,
    label     = "Ideal")

# Actual burndown step chart (Imprint brand green — first categorical series)
lines!(ax, step_x, step_y;
    color     = IMPRINT_PALETTE[1],
    linewidth = 3.0,
    label     = "Actual")

# Scope change marker — dotted vertical at day 4 (matte red semantic anchor)
vlines!(ax, [4.0];
    color     = (IMPRINT_PALETTE[5], 0.75),
    linewidth = 1.8,
    linestyle = :dot)

# Scope change annotation
text!(ax, 4.15, 38.5;
    text     = "+8 pts",
    color    = IMPRINT_PALETTE[5],
    fontsize = 12,
    align    = (:left, :center))

# Weekend label
text!(ax, 5.5, 43.5;
    text     = "Weekend",
    color    = INK_MUTED,
    fontsize = 11,
    align    = (:center, :center))

xlims!(ax, -0.5, 11.8)
ylims!(ax, -2.0, 47.0)

# Legend — top-right, below/ahead of schedule reading clear from colors
axislegend(ax;
    position        = :rt,
    framecolor      = INK_SOFT,
    backgroundcolor = ELEVATED_BG,
    labelcolor      = INK,
    labelsize       = 12,
    patchsize       = (25, 3),
    padding         = (8, 8, 6, 6))

save("plot-$(THEME).png", fig; px_per_unit = 2)
Runnable source as JSON, for any HTTP client: https://api.anyplot.ai/specs/burndown-sprint/makie/code. Any spec id and library id listed in llms-full.txt fit the same URL shape; every URL below is complete and callable.
{
  "spec_id": "burndown-sprint",
  "language": "julia",
  "library": "makie",
  "page": "https://anyplot.ai/burndown-sprint/julia/makie",
  "hub": "https://anyplot.ai/burndown-sprint",
  "code_json": "https://api.anyplot.ai/specs/burndown-sprint/makie/code",
  "spec_json": "https://api.anyplot.ai/specs/burndown-sprint",
  "render_light_png": "https://storage.googleapis.com/anyplot-images/plots/burndown-sprint/julia/makie/plot-light.png",
  "render_dark_png": "https://storage.googleapis.com/anyplot-images/plots/burndown-sprint/julia/makie/plot-dark.png",
  "quality_score": 90.0,
  "license": "MIT",
  "guide": "https://anyplot.ai/llms.txt"
}
Part of Agile Sprint Burndown Chart on anyplot.ai.