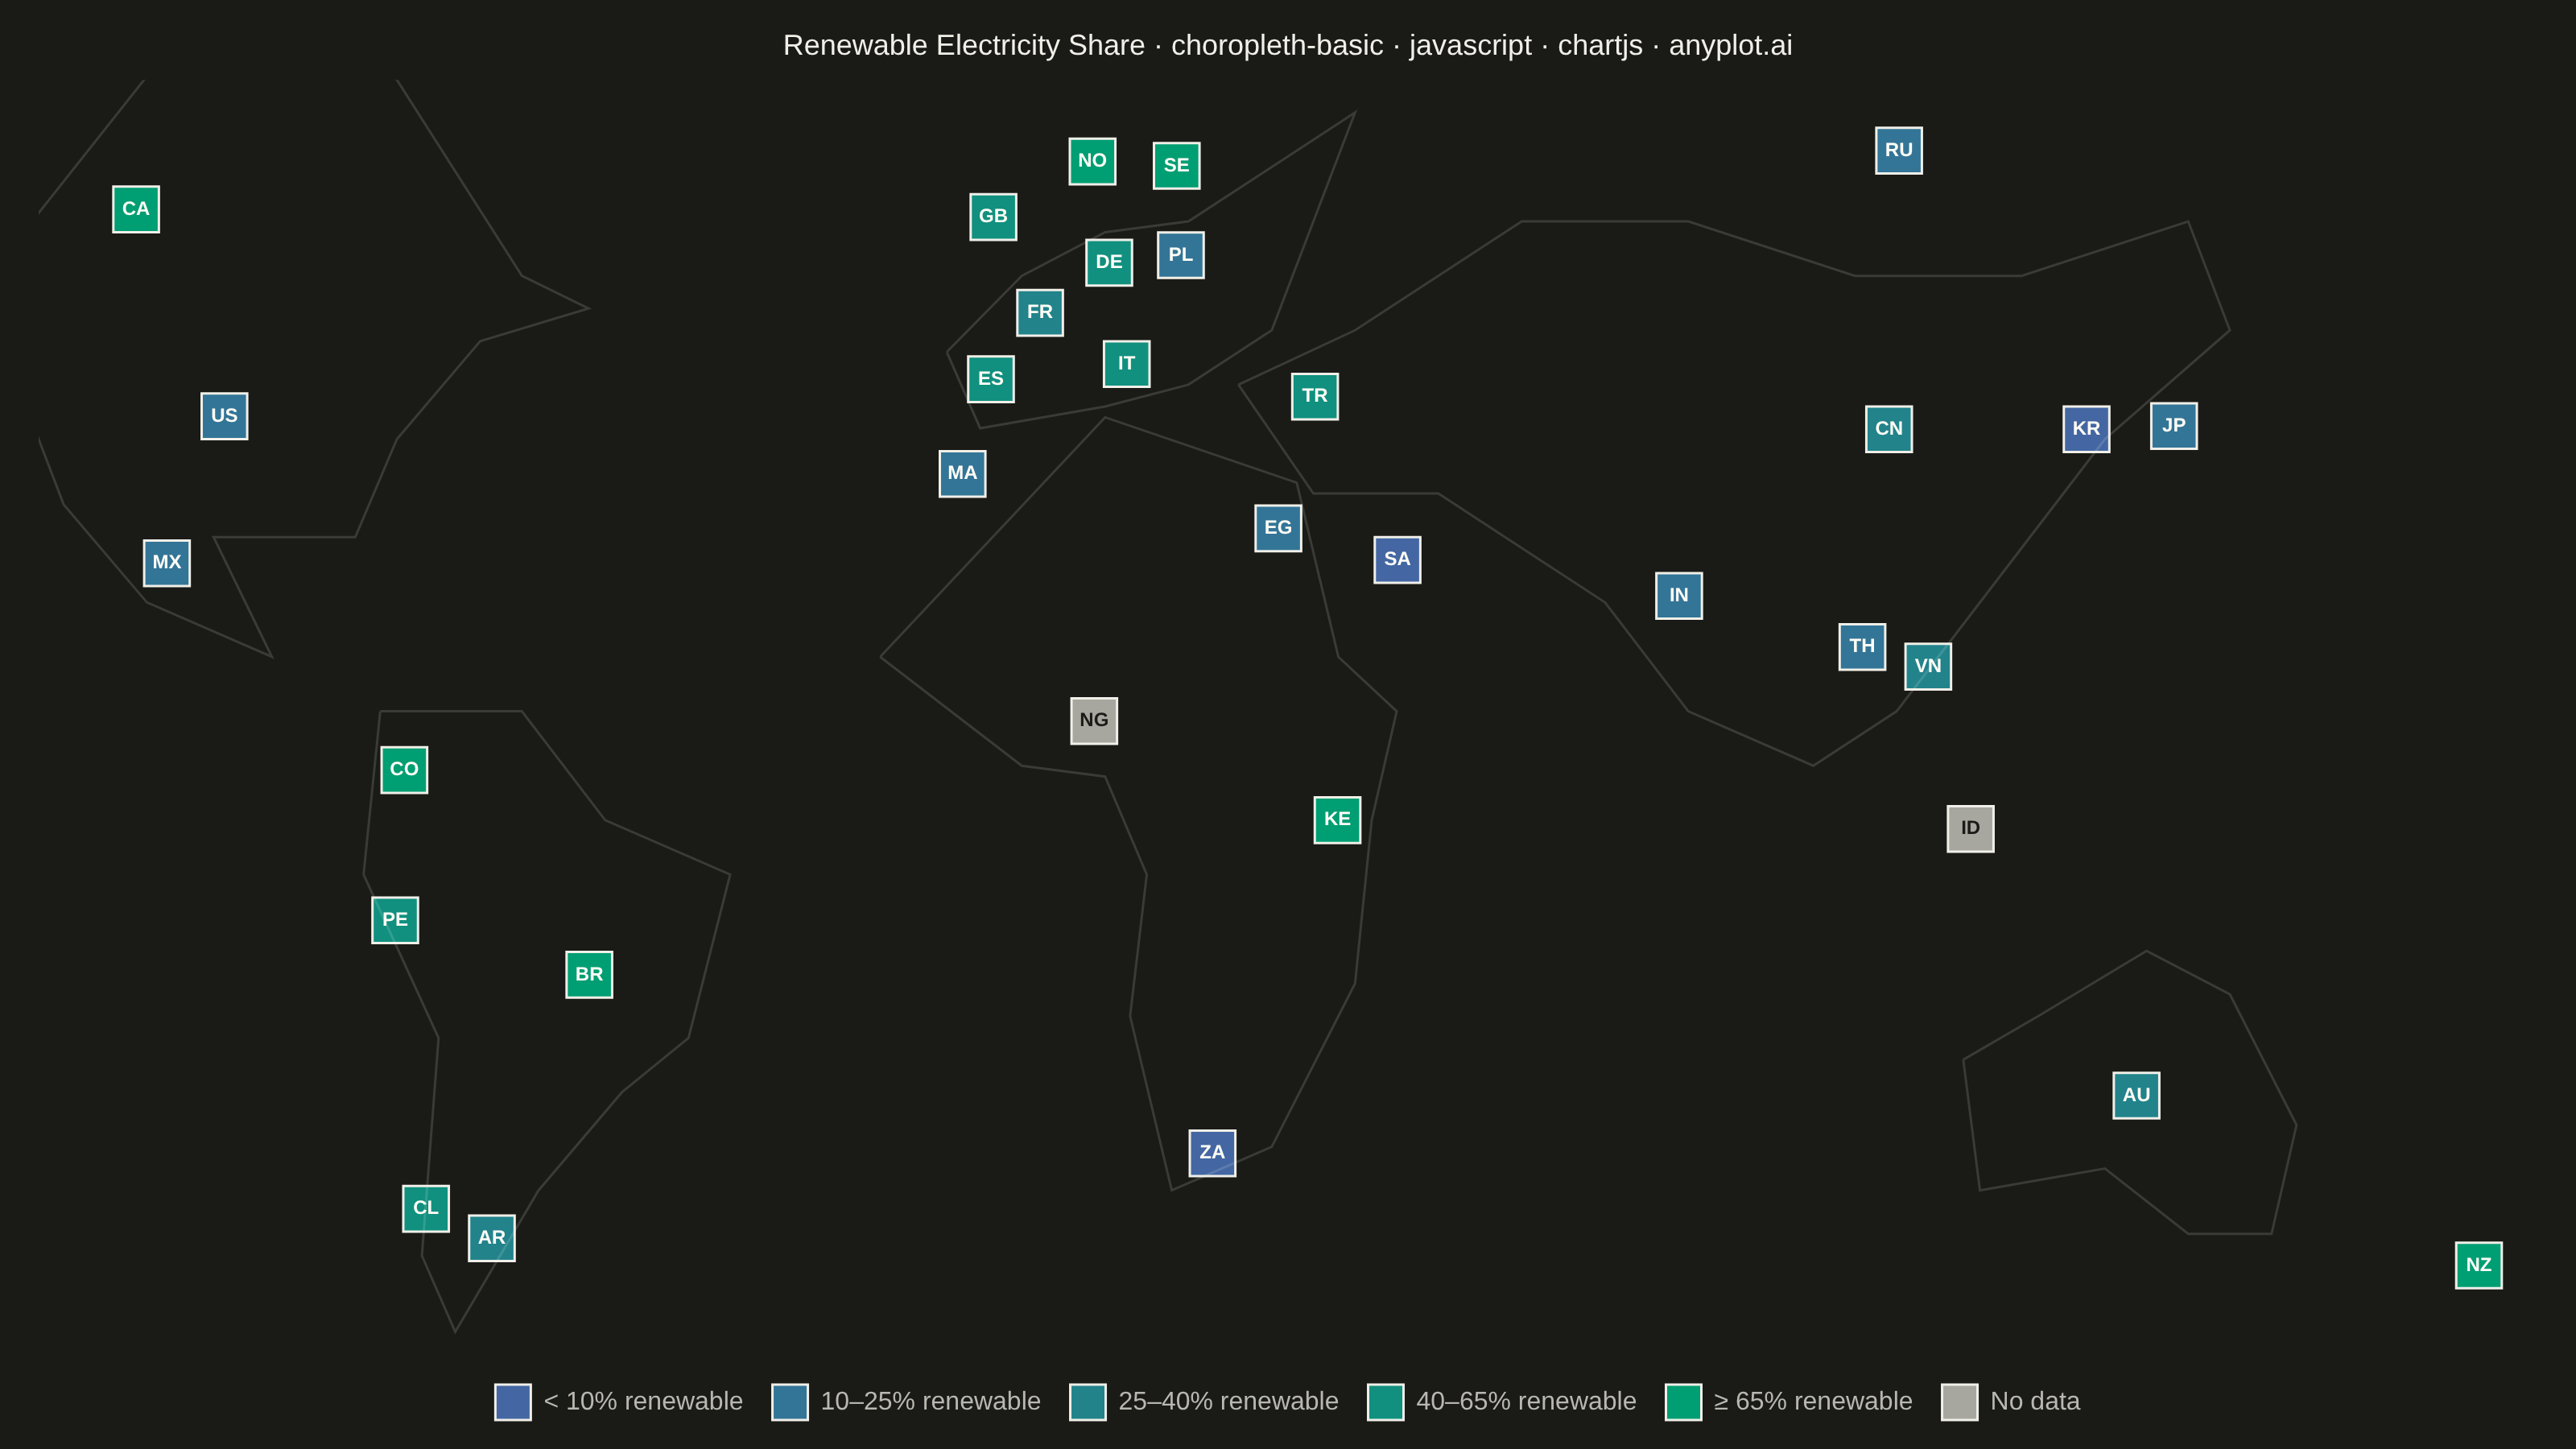
The same plot in 13 other libraries — JavaScript: D3.js, Apache ECharts, Highcharts; Python: Altair, Bokeh, lets-plot, Matplotlib, Plotly, plotnine, Pygal, Seaborn; R: ggplot2; Julia: Makie.jl. Compare all 14 side by side: Choropleth Map with Regional Coloring in Python, R, Julia and JavaScript.
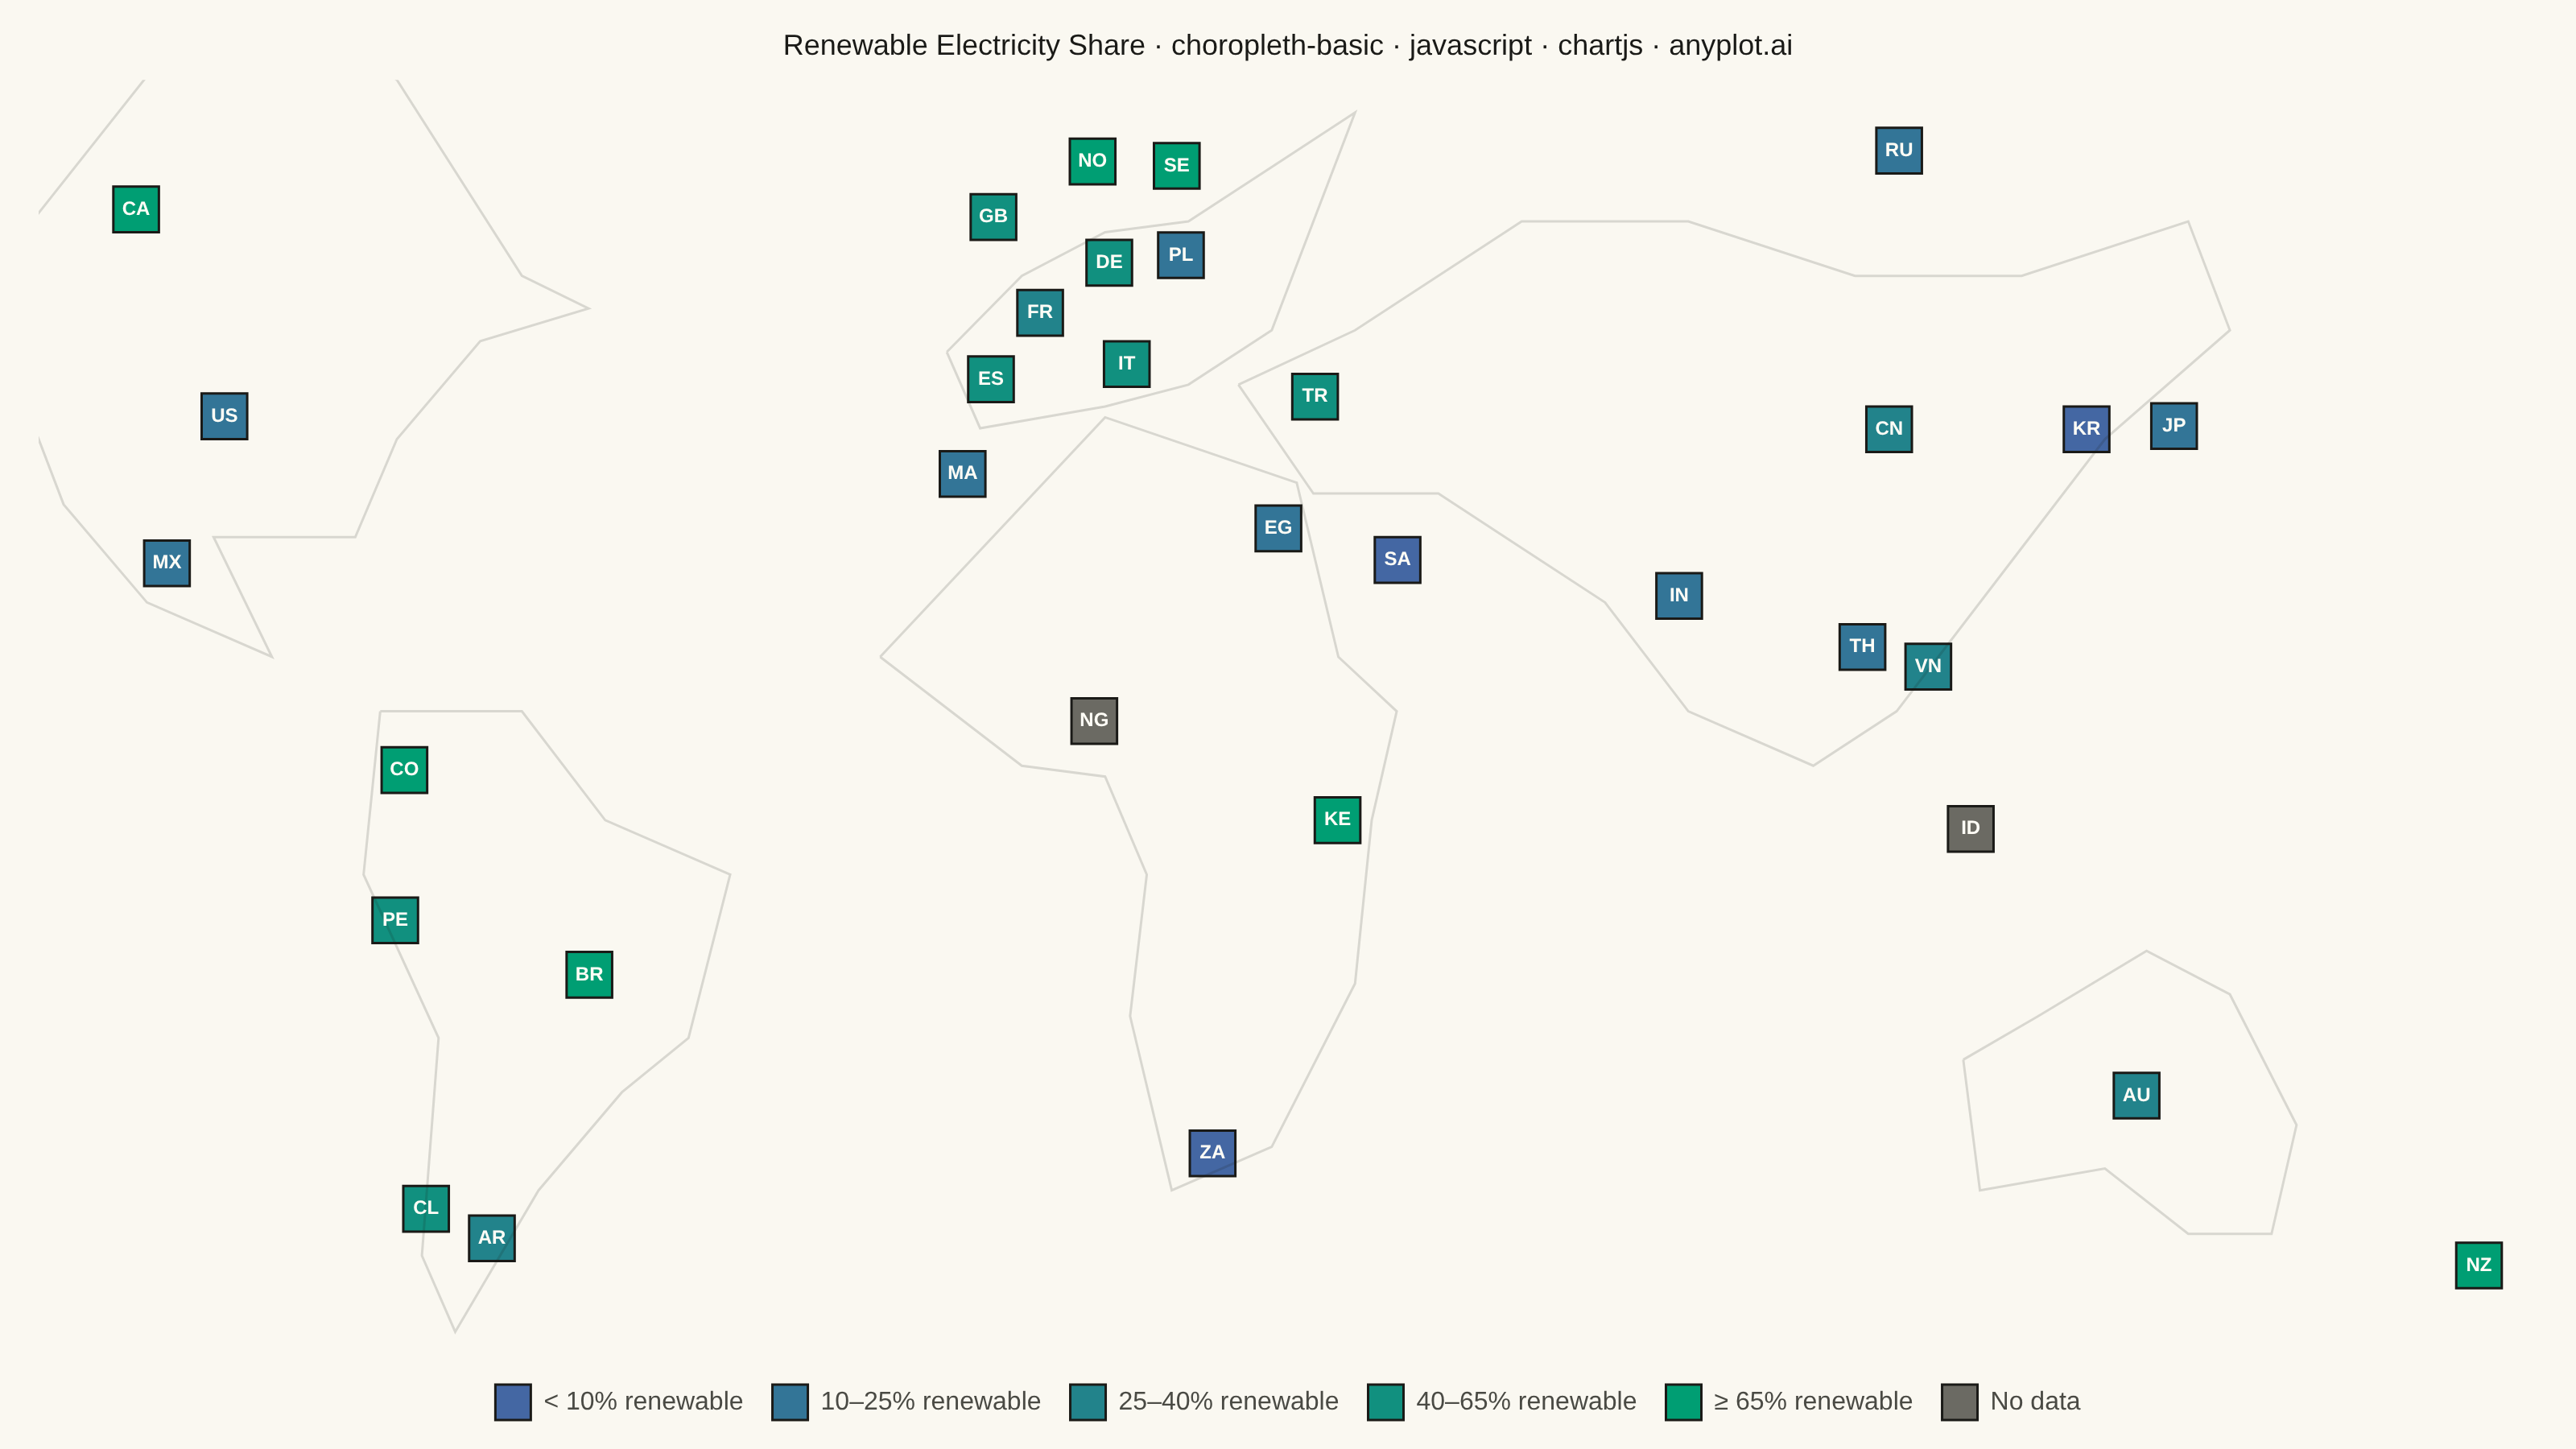
A choropleth map visualizes data by shading geographic regions (countries, states, or counties) according to a measured variable. This technique is ideal for showing regional patterns and spatial distributions, making it easy to identify areas with high or low values at a glance. The color intensity represents the data magnitude, creating an intuitive way to understand geographic variation.
// anyplot.ai
// choropleth-basic: Choropleth Map with Regional Coloring
// Library: chartjs 4.4.7 | JavaScript 22.23.2
// Quality: 85/100 | Created: 2026-09-02

// Chart.js has no built-in geographic/shape geometry (that lives only in the
// chartjs-chart-geo plugin, which is not installed in this runtime — see
// prompts/library/chartjs.md "No Workarounds"). This renders the same
// region -> value story as a tile map: one square per region, positioned by
// its real-world longitude/latitude, colored on the Imprint sequential scale.
// Region "boundaries" are the square's stroke; missing data renders as a
// muted gray tile, per the specification's data-handling note.
const t = window.ANYPLOT_TOKENS;
const MUTED = t.theme === "dark" ? "#A8A79F" : "#6B6A63";

// --- Data (in-memory, deterministic) ----------------------------------------
// Renewable share of electricity generation (%) by country, with approximate
// centroid coordinates. Two countries carry no reading to demonstrate the
// missing-data handling the spec calls for.
const countries = [
  { code: "CA", lon: -106.3, lat: 56.1, value: 68 },
  { code: "US", lon: -95.7, lat: 37.1, value: 21 },
  { code: "MX", lon: -102.6, lat: 23.6, value: 24 },
  { code: "BR", lon: -51.9, lat: -14.2, value: 84 },
  { code: "AR", lon: -63.6, lat: -38.4, value: 33 },
  { code: "CO", lon: -74.1, lat: 4.6, value: 70 },
  { code: "PE", lon: -75.2, lat: -9.2, value: 60 },
  { code: "CL", lon: -71.5, lat: -35.7, value: 46 },
  { code: "GB", lon: -3.4, lat: 55.4, value: 43 },
  { code: "FR", lon: 2.2, lat: 46.6, value: 27 },
  { code: "DE", lon: 10.5, lat: 51.2, value: 46 },
  { code: "ES", lon: -3.7, lat: 40.5, value: 50 },
  { code: "IT", lon: 12.6, lat: 41.9, value: 41 },
  { code: "NO", lon: 8.5, lat: 60.5, value: 98 },
  { code: "SE", lon: 18.6, lat: 60.1, value: 68 },
  { code: "PL", lon: 19.1, lat: 51.9, value: 17 },
  { code: "RU", lon: 105.3, lat: 61.5, value: 20 },
  { code: "TR", lon: 35.2, lat: 38.9, value: 44 },
  { code: "EG", lon: 30.8, lat: 26.8, value: 12 },
  { code: "NG", lon: 8.7, lat: 9.1, value: null },
  { code: "ZA", lon: 22.9, lat: -30.6, value: 9 },
  { code: "KE", lon: 37.9, lat: -0.0, value: 90 },
  { code: "MA", lon: -7.1, lat: 31.8, value: 20 },
  { code: "SA", lon: 45.1, lat: 23.9, value: 1 },
  { code: "IN", lon: 78.9, lat: 20.6, value: 23 },
  { code: "CN", lon: 104.1, lat: 35.9, value: 31 },
  { code: "JP", lon: 138.3, lat: 36.2, value: 22 },
  { code: "KR", lon: 127.8, lat: 35.9, value: 9 },
  { code: "ID", lon: 113.9, lat: -0.8, value: null },
  { code: "TH", lon: 100.9, lat: 15.9, value: 18 },
  { code: "VN", lon: 108.8, lat: 14.1, value: 40 },
  { code: "AU", lon: 133.8, lat: -25.3, value: 32 },
  { code: "NZ", lon: 174.9, lat: -40.9, value: 87 },
];

// --- Imprint sequential scale (green -> blue), binned for a readable legend
const hexToRgb = (hex) => ({
  r: parseInt(hex.slice(1, 3), 16),
  g: parseInt(hex.slice(3, 5), 16),
  b: parseInt(hex.slice(5, 7), 16),
});
const lerp = (a, b, f) => Math.round(a + (b - a) * f);
const seqRgb = (frac) => {
  const c0 = hexToRgb(t.seq[0]);
  const c1 = hexToRgb(t.seq[1]);
  return { r: lerp(c0.r, c1.r, frac), g: lerp(c0.g, c1.g, frac), b: lerp(c0.b, c1.b, frac) };
};
const toCss = ({ r, g, b }) => `rgb(${r}, ${g}, ${b})`;
// WCAG-ish relative luminance so a code label always reads against its own tile,
// regardless of theme (tile fill colors are identical across themes).
const luminance = ({ r, g, b }) => 0.299 * r + 0.587 * g + 0.114 * b;
const LABEL_LIGHT = "#FFFDF6";
const LABEL_DARK = "#1A1A17";

const bins = [
  { label: "< 10%", max: 10 },
  { label: "10–25%", max: 25 },
  { label: "25–40%", max: 40 },
  { label: "40–65%", max: 65 },
  { label: "≥ 65%", max: Infinity },
].map((bin, i, arr) => {
  // Highest-renewable bins read as brand green, lowest as blue, so the color
  // story matches the metric (more green = more renewable).
  const rgb = seqRgb(1 - i / (arr.length - 1));
  return { ...bin, color: toCss(rgb), textColor: luminance(rgb) > 140 ? LABEL_DARK : LABEL_LIGHT };
});

const binIndex = (value) => bins.findIndex((bin) => value <= bin.max);
const mutedTextColor = luminance(hexToRgb(MUTED)) > 140 ? LABEL_DARK : LABEL_LIGHT;

// --- Basemap -----------------------------------------------------------------
// Chart.js core has no polygon-fill geometry, so this draws a lightweight
// continent-outline graticule (stroked line datasets, no fill) behind the
// tiles purely for geographic orientation — it is not a projected basemap.
const CONTINENTS = [
  [
    [-125, 49], [-95, 78], [-75, 68], [-60, 50], [-52, 47], [-65, 44],
    [-75, 35], [-80, 26], [-97, 26], [-90, 15], [-105, 20], [-115, 29], [-125, 49],
  ],
  [
    [-77, 10], [-60, 10], [-50, 0], [-35, -5], [-40, -20], [-48, -25],
    [-58, -34], [-68, -47], [-72, -40], [-70, -20], [-79, -5], [-77, 10],
  ],
  [
    [-17, 15], [0, 5], [10, 4], [15, -5], [13, -18], [18, -34], [30, -30],
    [40, -15], [42, 0], [45, 10], [38, 15], [33, 31], [10, 37], [-17, 15],
  ],
  [
    [-9, 43], [0, 50], [10, 54], [20, 55], [30, 60], [40, 65], [30, 45],
    [20, 40], [10, 38], [-5, 36], [-9, 43],
  ],
  [
    [26, 40], [40, 45], [60, 55], [80, 55], [100, 50], [120, 50], [140, 55],
    [145, 45], [130, 35], [120, 25], [105, 10], [95, 5], [80, 10], [70, 20],
    [60, 25], [50, 30], [35, 30], [26, 40],
  ],
  [
    [113, -22], [122, -18], [135, -12], [145, -16], [153, -28], [150, -38],
    [140, -38], [130, -32], [115, -34], [113, -22],
  ],
];
const basemapDatasets = CONTINENTS.map((outline, i) => ({
  type: "line",
  label: `basemap-${i}`,
  skipLegend: true,
  data: outline.map(([lon, lat]) => ({ x: lon, y: lat })),
  borderColor: t.grid,
  backgroundColor: "transparent",
  borderWidth: 1.5,
  pointRadius: 0,
  pointHoverRadius: 0,
  fill: false,
  tension: 0,
}));

// --- Mount -------------------------------------------------------------------
const canvas = document.createElement("canvas");
document.getElementById("container").appendChild(canvas);

// A tile-map has no room for chartjs-chart-geo's boundary shapes (not
// installed — see prompts/library/chartjs.md), so region codes are drawn
// directly onto each square with a plain Chart.js plugin (native canvas
// access, no external package) instead.
const regionLabelPlugin = {
  id: "regionLabels",
  afterDatasetsDraw(chart) {
    const { ctx } = chart;
    chart.data.datasets.forEach((dataset, dsIndex) => {
      if (dataset.skipLegend) return; // basemap outline, not a data tile
      const meta = chart.getDatasetMeta(dsIndex);
      meta.data.forEach((point, i) => {
        const raw = dataset.data[i];
        ctx.save();
        ctx.font = "600 12px -apple-system, BlinkMacSystemFont, 'Segoe UI', Roboto, Helvetica, Arial, sans-serif";
        ctx.fillStyle = dataset.textColor;
        ctx.textAlign = "center";
        ctx.textBaseline = "middle";
        ctx.fillText(raw.code, point.x, point.y);
        ctx.restore();
      });
    });
  },
};

// --- Chart ---------------------------------------------------------------
const datasets = bins.map((bin, i) => ({
  label: `${bin.label} renewable`,
  data: countries.filter((c) => c.value !== null && binIndex(c.value) === i),
  backgroundColor: bin.color,
  textColor: bin.textColor,
  borderColor: t.ink,
  borderWidth: 1.5,
  pointStyle: "rect",
  pointRadius: 20,
  pointHoverRadius: 22,
}));
datasets.push({
  label: "No data",
  data: countries.filter((c) => c.value === null),
  backgroundColor: MUTED,
  textColor: mutedTextColor,
  borderColor: t.ink,
  borderWidth: 1.5,
  pointStyle: "rect",
  pointRadius: 20,
  pointHoverRadius: 22,
});

const title = "Renewable Electricity Share · choropleth-basic · javascript · chartjs · anyplot.ai";
const titleFontSize = Math.round(22 * Math.min(1, 67 / title.length));

new Chart(canvas, {
  type: "scatter",
  data: {
    // Basemap outlines first so tile squares draw on top of them.
    datasets: [
      ...basemapDatasets,
      ...datasets.map((d) => ({
        ...d,
        data: d.data.map((c) => ({ x: c.lon, y: c.lat, code: c.code, value: c.value })),
      })),
    ],
  },
  plugins: [regionLabelPlugin],
  options: {
    responsive: true,
    maintainAspectRatio: false,
    animation: false,
    layout: { padding: { top: 8, bottom: 8, left: 16, right: 16 } },
    plugins: {
      title: { display: true, text: title, color: t.ink, font: { size: titleFontSize, weight: "500" } },
      legend: {
        position: "bottom",
        labels: {
          color: t.inkSoft,
          font: { size: 16 },
          boxWidth: 22,
          boxHeight: 22,
          padding: 18,
          filter: (item, data) => !data.datasets[item.datasetIndex].skipLegend,
        },
      },
      tooltip: {
        filter: (item) => !item.dataset.skipLegend,
        callbacks: {
          title: () => "",
          label: (ctx) =>
            ctx.raw.value === null || ctx.raw.value === undefined
              ? `${ctx.raw.code}: no data`
              : `${ctx.raw.code}: ${ctx.raw.value}% renewable`,
        },
      },
    },
    scales: {
      // Tightened to the real longitude/latitude extent of the 32 countries
      // (plus a small margin) rather than the full -180..180/-90..90 globe,
      // so the canvas isn't dominated by empty ocean.
      x: {
        type: "linear",
        min: -118,
        max: 182,
        display: true,
        border: { display: false },
        ticks: { display: false },
        grid: { display: false },
      },
      y: {
        type: "linear",
        min: -48,
        max: 68,
        display: true,
        border: { display: false },
        ticks: { display: false },
        grid: { display: false },
      },
    },
  },
});
Runnable source as JSON, for any HTTP client: https://api.anyplot.ai/specs/choropleth-basic/chartjs/code. Any spec id and library id listed in llms-full.txt fit the same URL shape; every URL below is complete and callable.
{
  "spec_id": "choropleth-basic",
  "language": "javascript",
  "library": "chartjs",
  "page": "https://anyplot.ai/choropleth-basic/javascript/chartjs",
  "hub": "https://anyplot.ai/choropleth-basic",
  "code_json": "https://api.anyplot.ai/specs/choropleth-basic/chartjs/code",
  "spec_json": "https://api.anyplot.ai/specs/choropleth-basic",
  "render_light_png": "https://storage.googleapis.com/anyplot-images/plots/choropleth-basic/javascript/chartjs/plot-light.png",
  "render_dark_png": "https://storage.googleapis.com/anyplot-images/plots/choropleth-basic/javascript/chartjs/plot-dark.png",
  "interactive_light_html": "https://storage.googleapis.com/anyplot-images/plots/choropleth-basic/javascript/chartjs/plot-light.html",
  "interactive_dark_html": "https://storage.googleapis.com/anyplot-images/plots/choropleth-basic/javascript/chartjs/plot-dark.html",
  "quality_score": 85.0,
  "license": "MIT",
  "guide": "https://anyplot.ai/llms.txt"
}
Part of Choropleth Map with Regional Coloring on anyplot.ai.