The same plot in 13 other libraries — JavaScript: Chart.js, Apache ECharts, Highcharts; Python: Altair, Bokeh, lets-plot, Matplotlib, Plotly, plotnine, Pygal, Seaborn; R: ggplot2; Julia: Makie.jl. Compare all 14 side by side: Choropleth Map with Regional Coloring in Python, R, Julia and JavaScript.
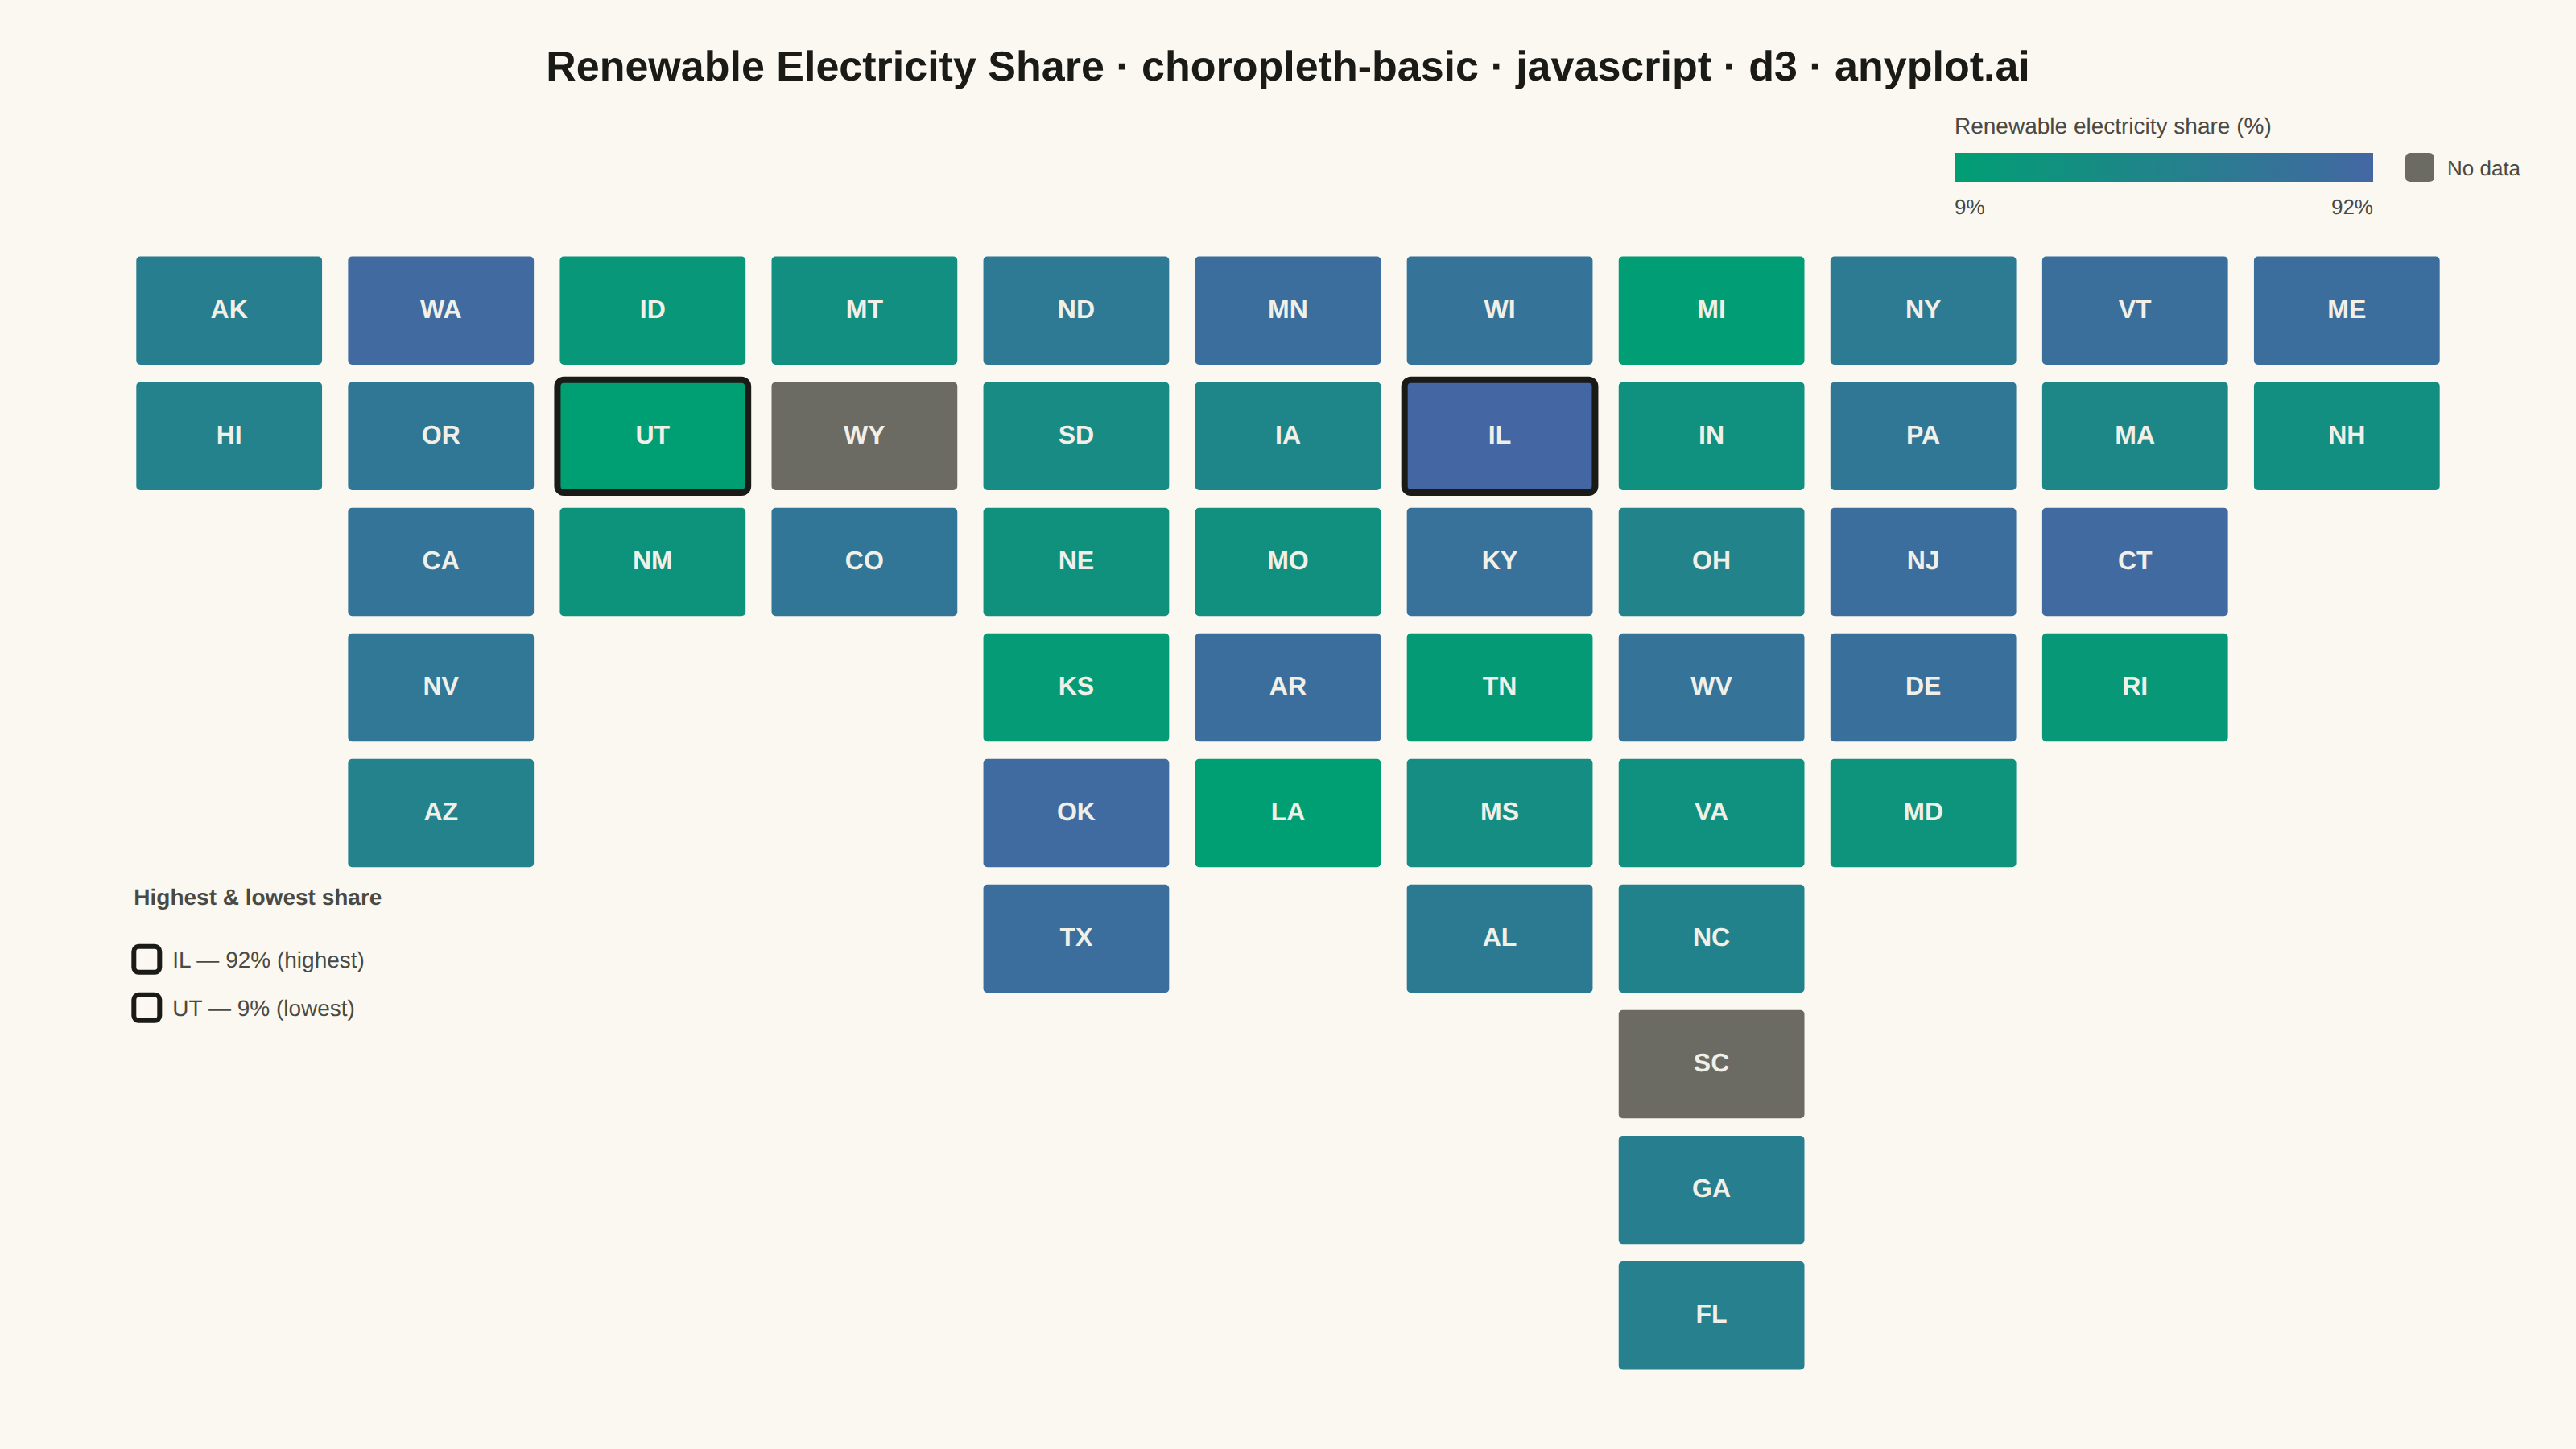
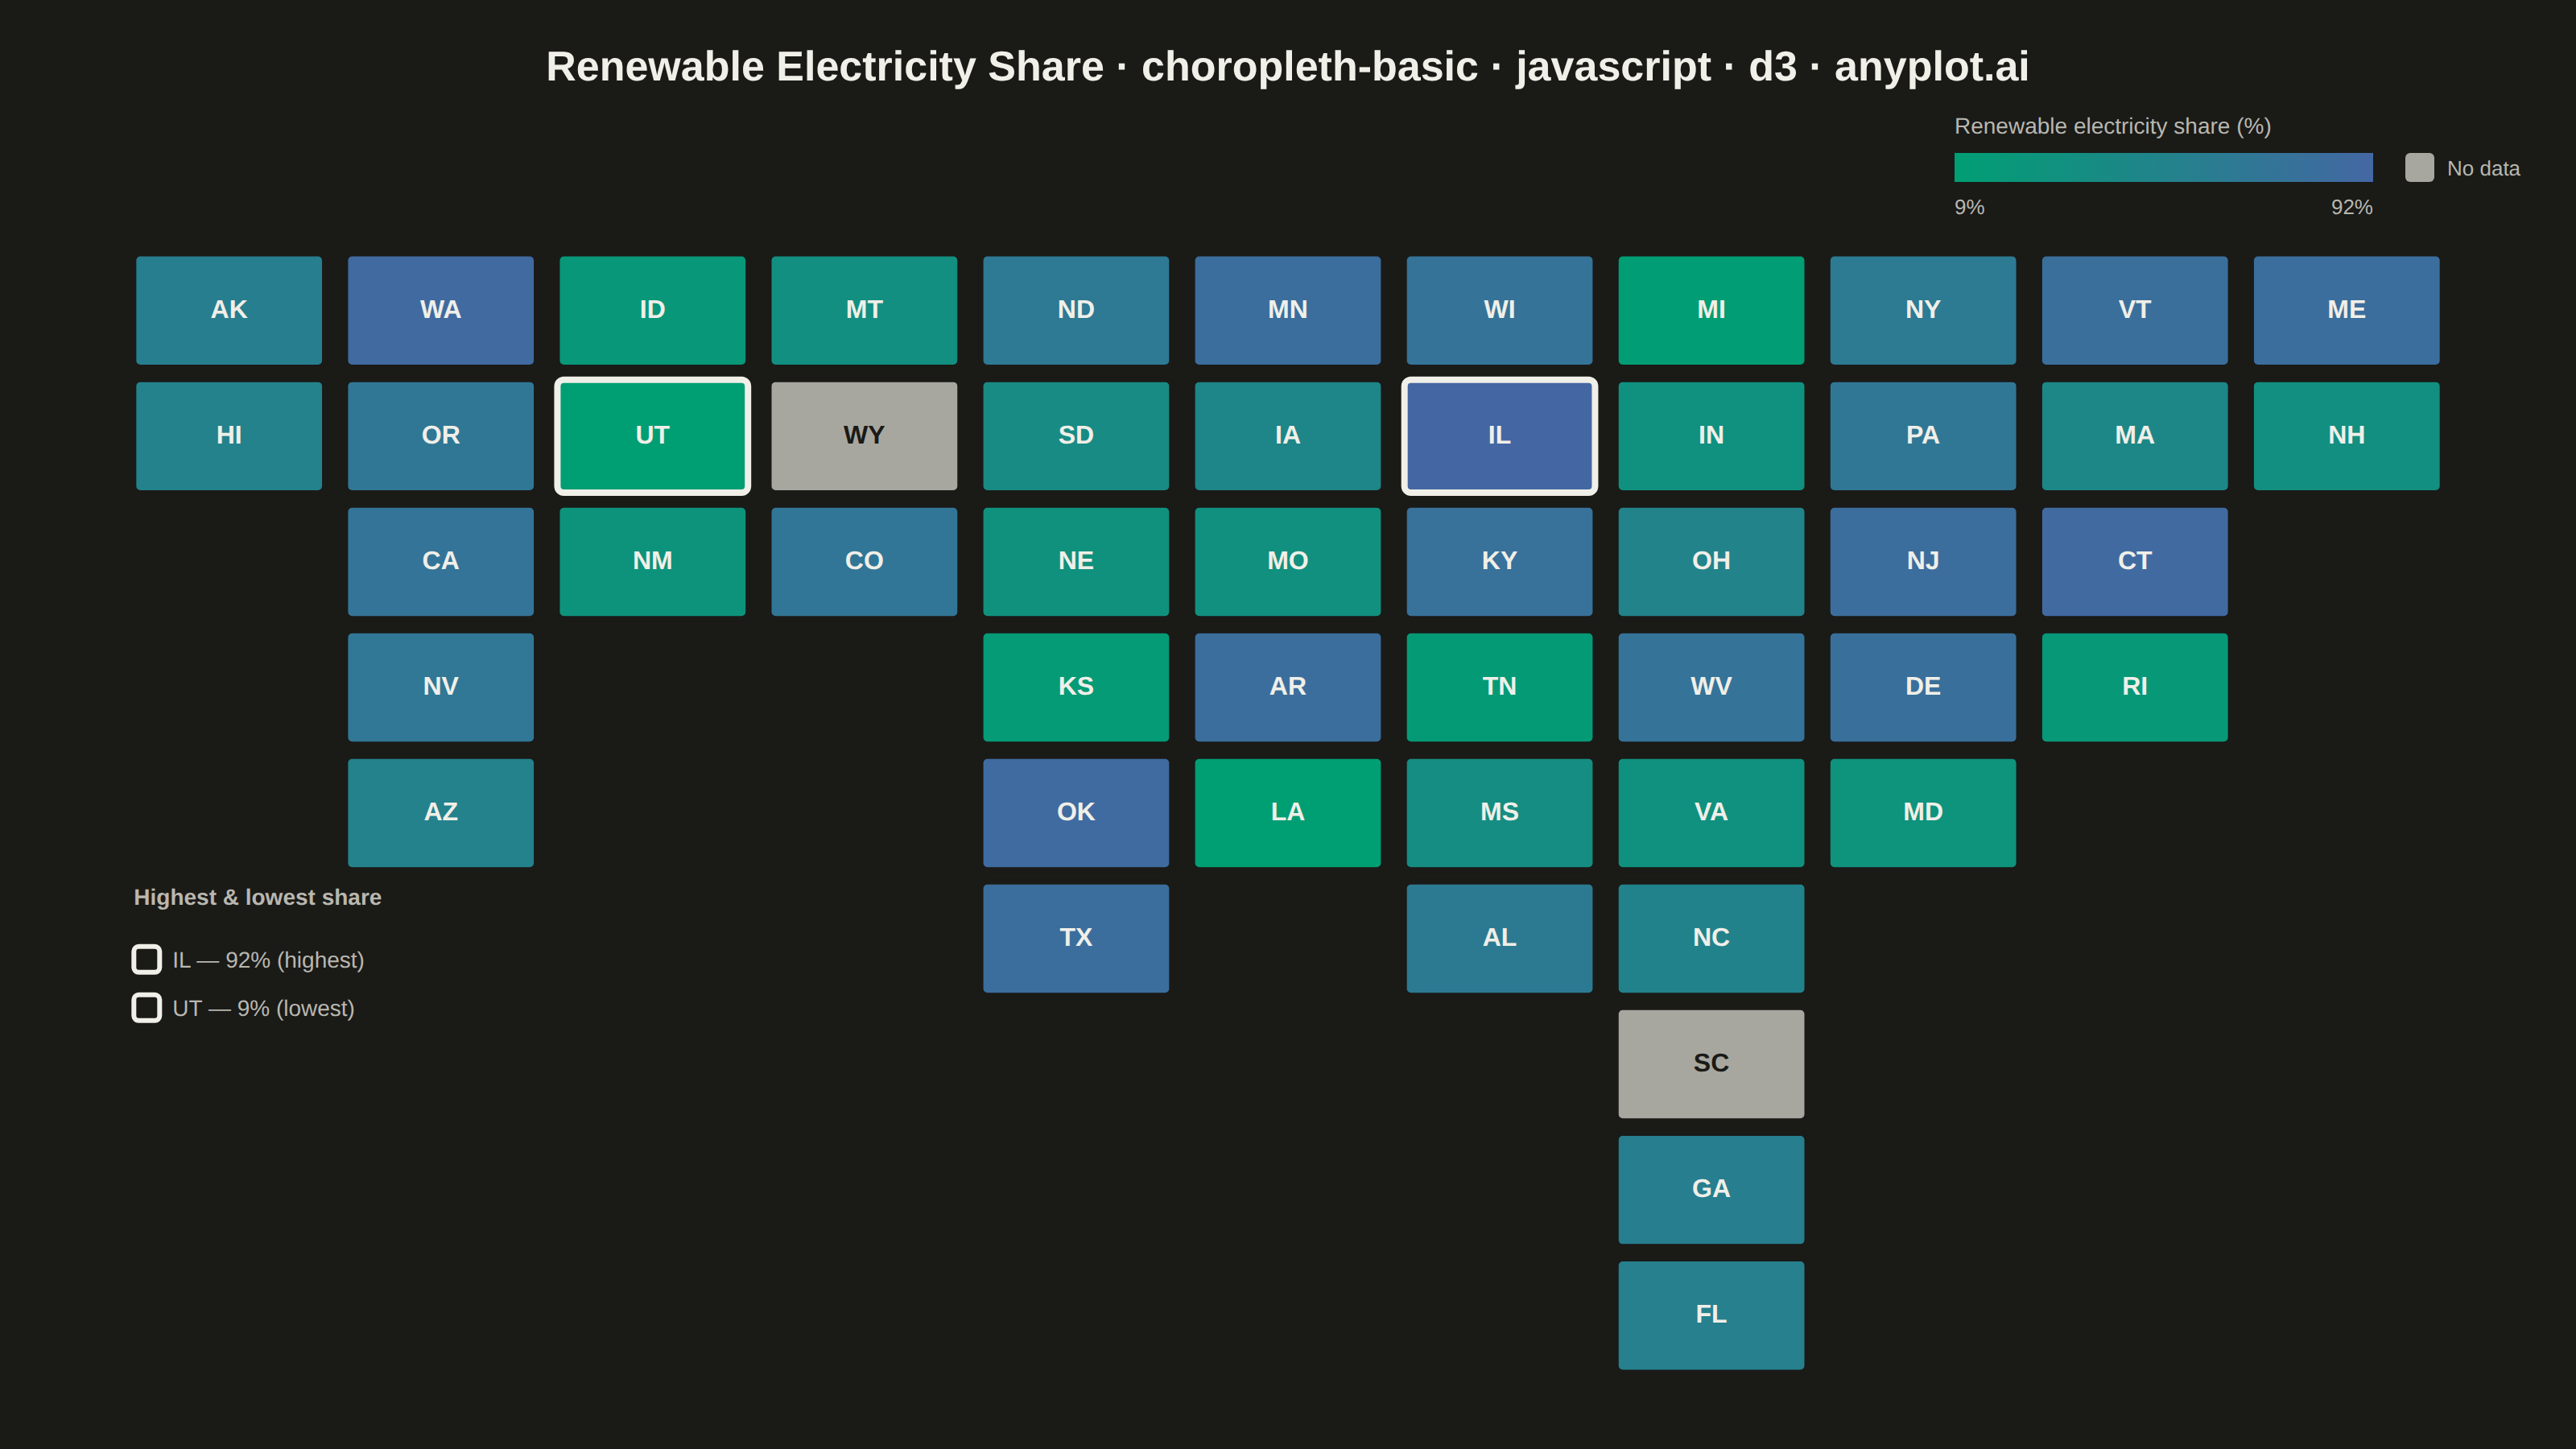
A choropleth map visualizes data by shading geographic regions (countries, states, or counties) according to a measured variable. This technique is ideal for showing regional patterns and spatial distributions, making it easy to identify areas with high or low values at a glance. The color intensity represents the data magnitude, creating an intuitive way to understand geographic variation.
// anyplot.ai
// choropleth-basic: Choropleth Map with Regional Coloring
// Library: d3 7.9.0 | JavaScript 22.23.2
// Quality: 88/100 | Created: 2026-09-02

const t = window.ANYPLOT_TOKENS;
const { width, height } = window.ANYPLOT_SIZE;
// `muted` isn't part of ANYPLOT_TOKENS — derive it from the theme, matching
// the Imprint semantic anchor in prompts/default-style-guide.md.
const MUTED = t.theme === "dark" ? "#A8A79F" : "#6B6A63";

// --- Data (in-memory, deterministic) ----------------------------------------
// Illustrative renewable-electricity share (%) of generation, one synthetic
// value per U.S. state. Laid out as an equal-area tile grid ("state grid
// map" cartogram) rather than literal shapefile boundaries — the renderer
// runs offline with no network/topojson access, and every state keeps the
// same visual weight regardless of its true land area, a well-established
// choropleth variant for all-state comparisons (e.g. NPR's state grid maps).
let seed = 42;
function nextRandom() {
  seed = (1103515245 * seed + 12345) % 2147483648;
  return seed / 2147483648;
}

const regions = [
  { abbr: "AK", col: -1, row: 0 }, { abbr: "HI", col: -1, row: 1 },
  { abbr: "WA", col: 0, row: 0 }, { abbr: "OR", col: 0, row: 1 }, { abbr: "CA", col: 0, row: 2 },
  { abbr: "NV", col: 0, row: 3 }, { abbr: "AZ", col: 0, row: 4 },
  { abbr: "ID", col: 1, row: 0 }, { abbr: "UT", col: 1, row: 1 }, { abbr: "NM", col: 1, row: 2 },
  { abbr: "MT", col: 2, row: 0 }, { abbr: "WY", col: 2, row: 1 }, { abbr: "CO", col: 2, row: 2 },
  { abbr: "ND", col: 3, row: 0 }, { abbr: "SD", col: 3, row: 1 }, { abbr: "NE", col: 3, row: 2 },
  { abbr: "KS", col: 3, row: 3 }, { abbr: "OK", col: 3, row: 4 }, { abbr: "TX", col: 3, row: 5 },
  { abbr: "MN", col: 4, row: 0 }, { abbr: "IA", col: 4, row: 1 }, { abbr: "MO", col: 4, row: 2 },
  { abbr: "AR", col: 4, row: 3 }, { abbr: "LA", col: 4, row: 4 },
  { abbr: "WI", col: 5, row: 0 }, { abbr: "IL", col: 5, row: 1 }, { abbr: "KY", col: 5, row: 2 },
  { abbr: "TN", col: 5, row: 3 }, { abbr: "MS", col: 5, row: 4 }, { abbr: "AL", col: 5, row: 5 },
  { abbr: "MI", col: 6, row: 0 }, { abbr: "IN", col: 6, row: 1 }, { abbr: "OH", col: 6, row: 2 },
  { abbr: "WV", col: 6, row: 3 }, { abbr: "VA", col: 6, row: 4 }, { abbr: "NC", col: 6, row: 5 },
  { abbr: "SC", col: 6, row: 6 }, { abbr: "GA", col: 6, row: 7 }, { abbr: "FL", col: 6, row: 8 },
  { abbr: "NY", col: 7, row: 0 }, { abbr: "PA", col: 7, row: 1 }, { abbr: "NJ", col: 7, row: 2 },
  { abbr: "DE", col: 7, row: 3 }, { abbr: "MD", col: 7, row: 4 },
  { abbr: "VT", col: 8, row: 0 }, { abbr: "MA", col: 8, row: 1 }, { abbr: "CT", col: 8, row: 2 },
  { abbr: "RI", col: 8, row: 3 },
  { abbr: "ME", col: 9, row: 0 }, { abbr: "NH", col: 9, row: 1 },
].map((d) => ({ ...d, value: Math.round(5 + nextRandom() * 90) }));

// Two states illustrate graceful handling of missing data (spec requirement).
const noDataStates = new Set(["WY", "SC"]);
for (const region of regions) {
  if (noDataStates.has(region.abbr)) region.value = null;
}

// Highest/lowest extremes, called out below to sharpen the story beyond the
// base color encoding and to give the map's empty southwest corner a job.
const validRegions = regions.filter((d) => d.value != null);
const maxRegion = validRegions.reduce((a, b) => (b.value > a.value ? b : a));
const minRegion = validRegions.reduce((a, b) => (b.value < a.value ? b : a));
const highlightAbbrs = new Set([maxRegion.abbr, minRegion.abbr]);

// --- Layout -------------------------------------------------------------
const margin = { top: 150, right: 70, bottom: 40, left: 70 };
const iw = width - margin.left - margin.right;
const ih = height - margin.top - margin.bottom;

const x = d3.scaleBand().domain(d3.range(-1, 10)).range([0, iw]).padding(0.1);
const y = d3.scaleBand().domain(d3.range(0, 9)).range([0, ih]).padding(0.1);

const valueExtent = d3.extent(regions.filter((d) => d.value != null), (d) => d.value);
const color = d3.scaleSequential(d3.interpolateRgbBasis(t.seq)).domain(valueExtent);

// Pick dark or light label ink from the tile's own fill luminance, independent
// of page theme — a pale tile needs dark text even on the dark surface.
function labelInk(hex) {
  const c = d3.rgb(hex);
  const luminance = 0.299 * c.r + 0.587 * c.g + 0.114 * c.b;
  return luminance > 150 ? "#1A1A17" : "#F0EFE8";
}

// --- SVG mount ----------------------------------------------------------
const svg = d3.select("#container").append("svg").attr("width", width).attr("height", height);
const g = svg.append("g").attr("transform", `translate(${margin.left},${margin.top})`);

// --- Tiles ----------------------------------------------------------------
const tile = g
  .selectAll("g.tile")
  .data(regions)
  .join("g")
  .attr("class", "tile")
  .attr("transform", (d) => `translate(${x(d.col)},${y(d.row)})`);

tile
  .append("rect")
  .attr("width", x.bandwidth())
  .attr("height", y.bandwidth())
  .attr("rx", 4)
  .attr("fill", (d) => (d.value == null ? MUTED : color(d.value)))
  .attr("stroke", (d) => (highlightAbbrs.has(d.abbr) ? t.ink : t.pageBg))
  .attr("stroke-width", (d) => (highlightAbbrs.has(d.abbr) ? 4 : 3));

tile
  .append("text")
  .attr("x", x.bandwidth() / 2)
  .attr("y", y.bandwidth() / 2)
  .attr("text-anchor", "middle")
  .attr("dominant-baseline", "central")
  .style("font-size", "16px")
  .style("font-weight", "600")
  .attr("fill", (d) => labelInk(d.value == null ? MUTED : color(d.value)))
  .text((d) => d.abbr);

// --- Highest/lowest callout --------------------------------------------------
// The tile-grid's true US shape leaves cols -1..2 empty below row 5 (nothing
// west of Texas reaches that far south) — use that void for a data-storytelling
// callout instead of leaving it dead space, and echo the ink-stroke swatches
// against the two highlighted tiles above.
const calloutX = x(-1);
const calloutRowY = y(5);
const calloutEntries = [
  { region: maxRegion, label: "highest" },
  { region: minRegion, label: "lowest" },
];
g.append("text")
  .attr("x", calloutX)
  .attr("y", calloutRowY + 14)
  .attr("fill", t.inkSoft)
  .style("font-size", "14px")
  .style("font-weight", "600")
  .text("Highest & lowest share");
calloutEntries.forEach((entry, i) => {
  const rowY = calloutRowY + 40 + i * 30;
  g.append("rect")
    .attr("x", calloutX)
    .attr("y", rowY)
    .attr("width", 16)
    .attr("height", 16)
    .attr("rx", 3)
    .attr("fill", "none")
    .attr("stroke", t.ink)
    .attr("stroke-width", 3);
  g.append("text")
    .attr("x", calloutX + 24)
    .attr("y", rowY + 13)
    .attr("fill", t.inkSoft)
    .style("font-size", "14px")
    .text(`${entry.region.abbr} — ${entry.region.value}% (${entry.label})`);
});

// --- Title ------------------------------------------------------------------
const title = "Renewable Electricity Share · choropleth-basic · javascript · d3 · anyplot.ai";
// Default bumped from the style-guide's 22px baseline: at the formula's 19px
// result this title measured only ~42% of canvas width (below the ~50-70%
// comfort range) per AI review — 30px recalibrates for this title's actual
// rendered character width while the 67-char linear taper still guards long
// titles from overflow.
const titleFontSize = Math.round(30 * Math.min(1, 67 / title.length));
svg
  .append("text")
  .attr("x", width / 2)
  .attr("y", 50)
  .attr("text-anchor", "middle")
  .attr("fill", t.ink)
  .style("font-size", `${titleFontSize}px`)
  .style("font-weight", "600")
  .text(title);

// --- Legend (sequential gradient + no-data swatch) --------------------------
const legendWidth = 260;
const legendHeight = 18;
const noDataSwatchGap = 20;
const noDataLabelWidth = 60;
const legendTotalWidth = legendWidth + noDataSwatchGap + legendHeight + 8 + noDataLabelWidth;
const legendX = width - 20 - legendTotalWidth;
const legendY = 95;

const gradientId = "choropleth-legend-gradient";
const gradient = svg
  .append("defs")
  .append("linearGradient")
  .attr("id", gradientId)
  .attr("x1", "0%")
  .attr("x2", "100%")
  .attr("y1", "0%")
  .attr("y2", "0%");
d3.range(0, 1.001, 0.1).forEach((stop) => {
  gradient
    .append("stop")
    .attr("offset", `${stop * 100}%`)
    .attr("stop-color", color(valueExtent[0] + stop * (valueExtent[1] - valueExtent[0])));
});

svg
  .append("text")
  .attr("x", legendX)
  .attr("y", legendY - 12)
  .attr("fill", t.inkSoft)
  .style("font-size", "14px")
  .text("Renewable electricity share (%)");

svg
  .append("rect")
  .attr("x", legendX)
  .attr("y", legendY)
  .attr("width", legendWidth)
  .attr("height", legendHeight)
  .attr("fill", `url(#${gradientId})`);

svg
  .append("text")
  .attr("x", legendX)
  .attr("y", legendY + legendHeight + 20)
  .attr("fill", t.inkSoft)
  .style("font-size", "13px")
  .text(`${valueExtent[0]}%`);

svg
  .append("text")
  .attr("x", legendX + legendWidth)
  .attr("y", legendY + legendHeight + 20)
  .attr("text-anchor", "end")
  .attr("fill", t.inkSoft)
  .style("font-size", "13px")
  .text(`${valueExtent[1]}%`);

svg
  .append("rect")
  .attr("x", legendX + legendWidth + noDataSwatchGap)
  .attr("y", legendY)
  .attr("width", legendHeight)
  .attr("height", legendHeight)
  .attr("rx", 3)
  .attr("fill", MUTED);

svg
  .append("text")
  .attr("x", legendX + legendWidth + noDataSwatchGap + legendHeight + 8)
  .attr("y", legendY + legendHeight - 4)
  .attr("fill", t.inkSoft)
  .style("font-size", "13px")
  .text("No data");
Runnable source as JSON, for any HTTP client: https://api.anyplot.ai/specs/choropleth-basic/d3/code. Any spec id and library id listed in llms-full.txt fit the same URL shape; every URL below is complete and callable.
{
  "spec_id": "choropleth-basic",
  "language": "javascript",
  "library": "d3",
  "page": "https://anyplot.ai/choropleth-basic/javascript/d3",
  "hub": "https://anyplot.ai/choropleth-basic",
  "code_json": "https://api.anyplot.ai/specs/choropleth-basic/d3/code",
  "spec_json": "https://api.anyplot.ai/specs/choropleth-basic",
  "render_light_png": "https://storage.googleapis.com/anyplot-images/plots/choropleth-basic/javascript/d3/plot-light.png",
  "render_dark_png": "https://storage.googleapis.com/anyplot-images/plots/choropleth-basic/javascript/d3/plot-dark.png",
  "interactive_light_html": "https://storage.googleapis.com/anyplot-images/plots/choropleth-basic/javascript/d3/plot-light.html",
  "interactive_dark_html": "https://storage.googleapis.com/anyplot-images/plots/choropleth-basic/javascript/d3/plot-dark.html",
  "quality_score": 88.0,
  "license": "MIT",
  "guide": "https://anyplot.ai/llms.txt"
}
Part of Choropleth Map with Regional Coloring on anyplot.ai.