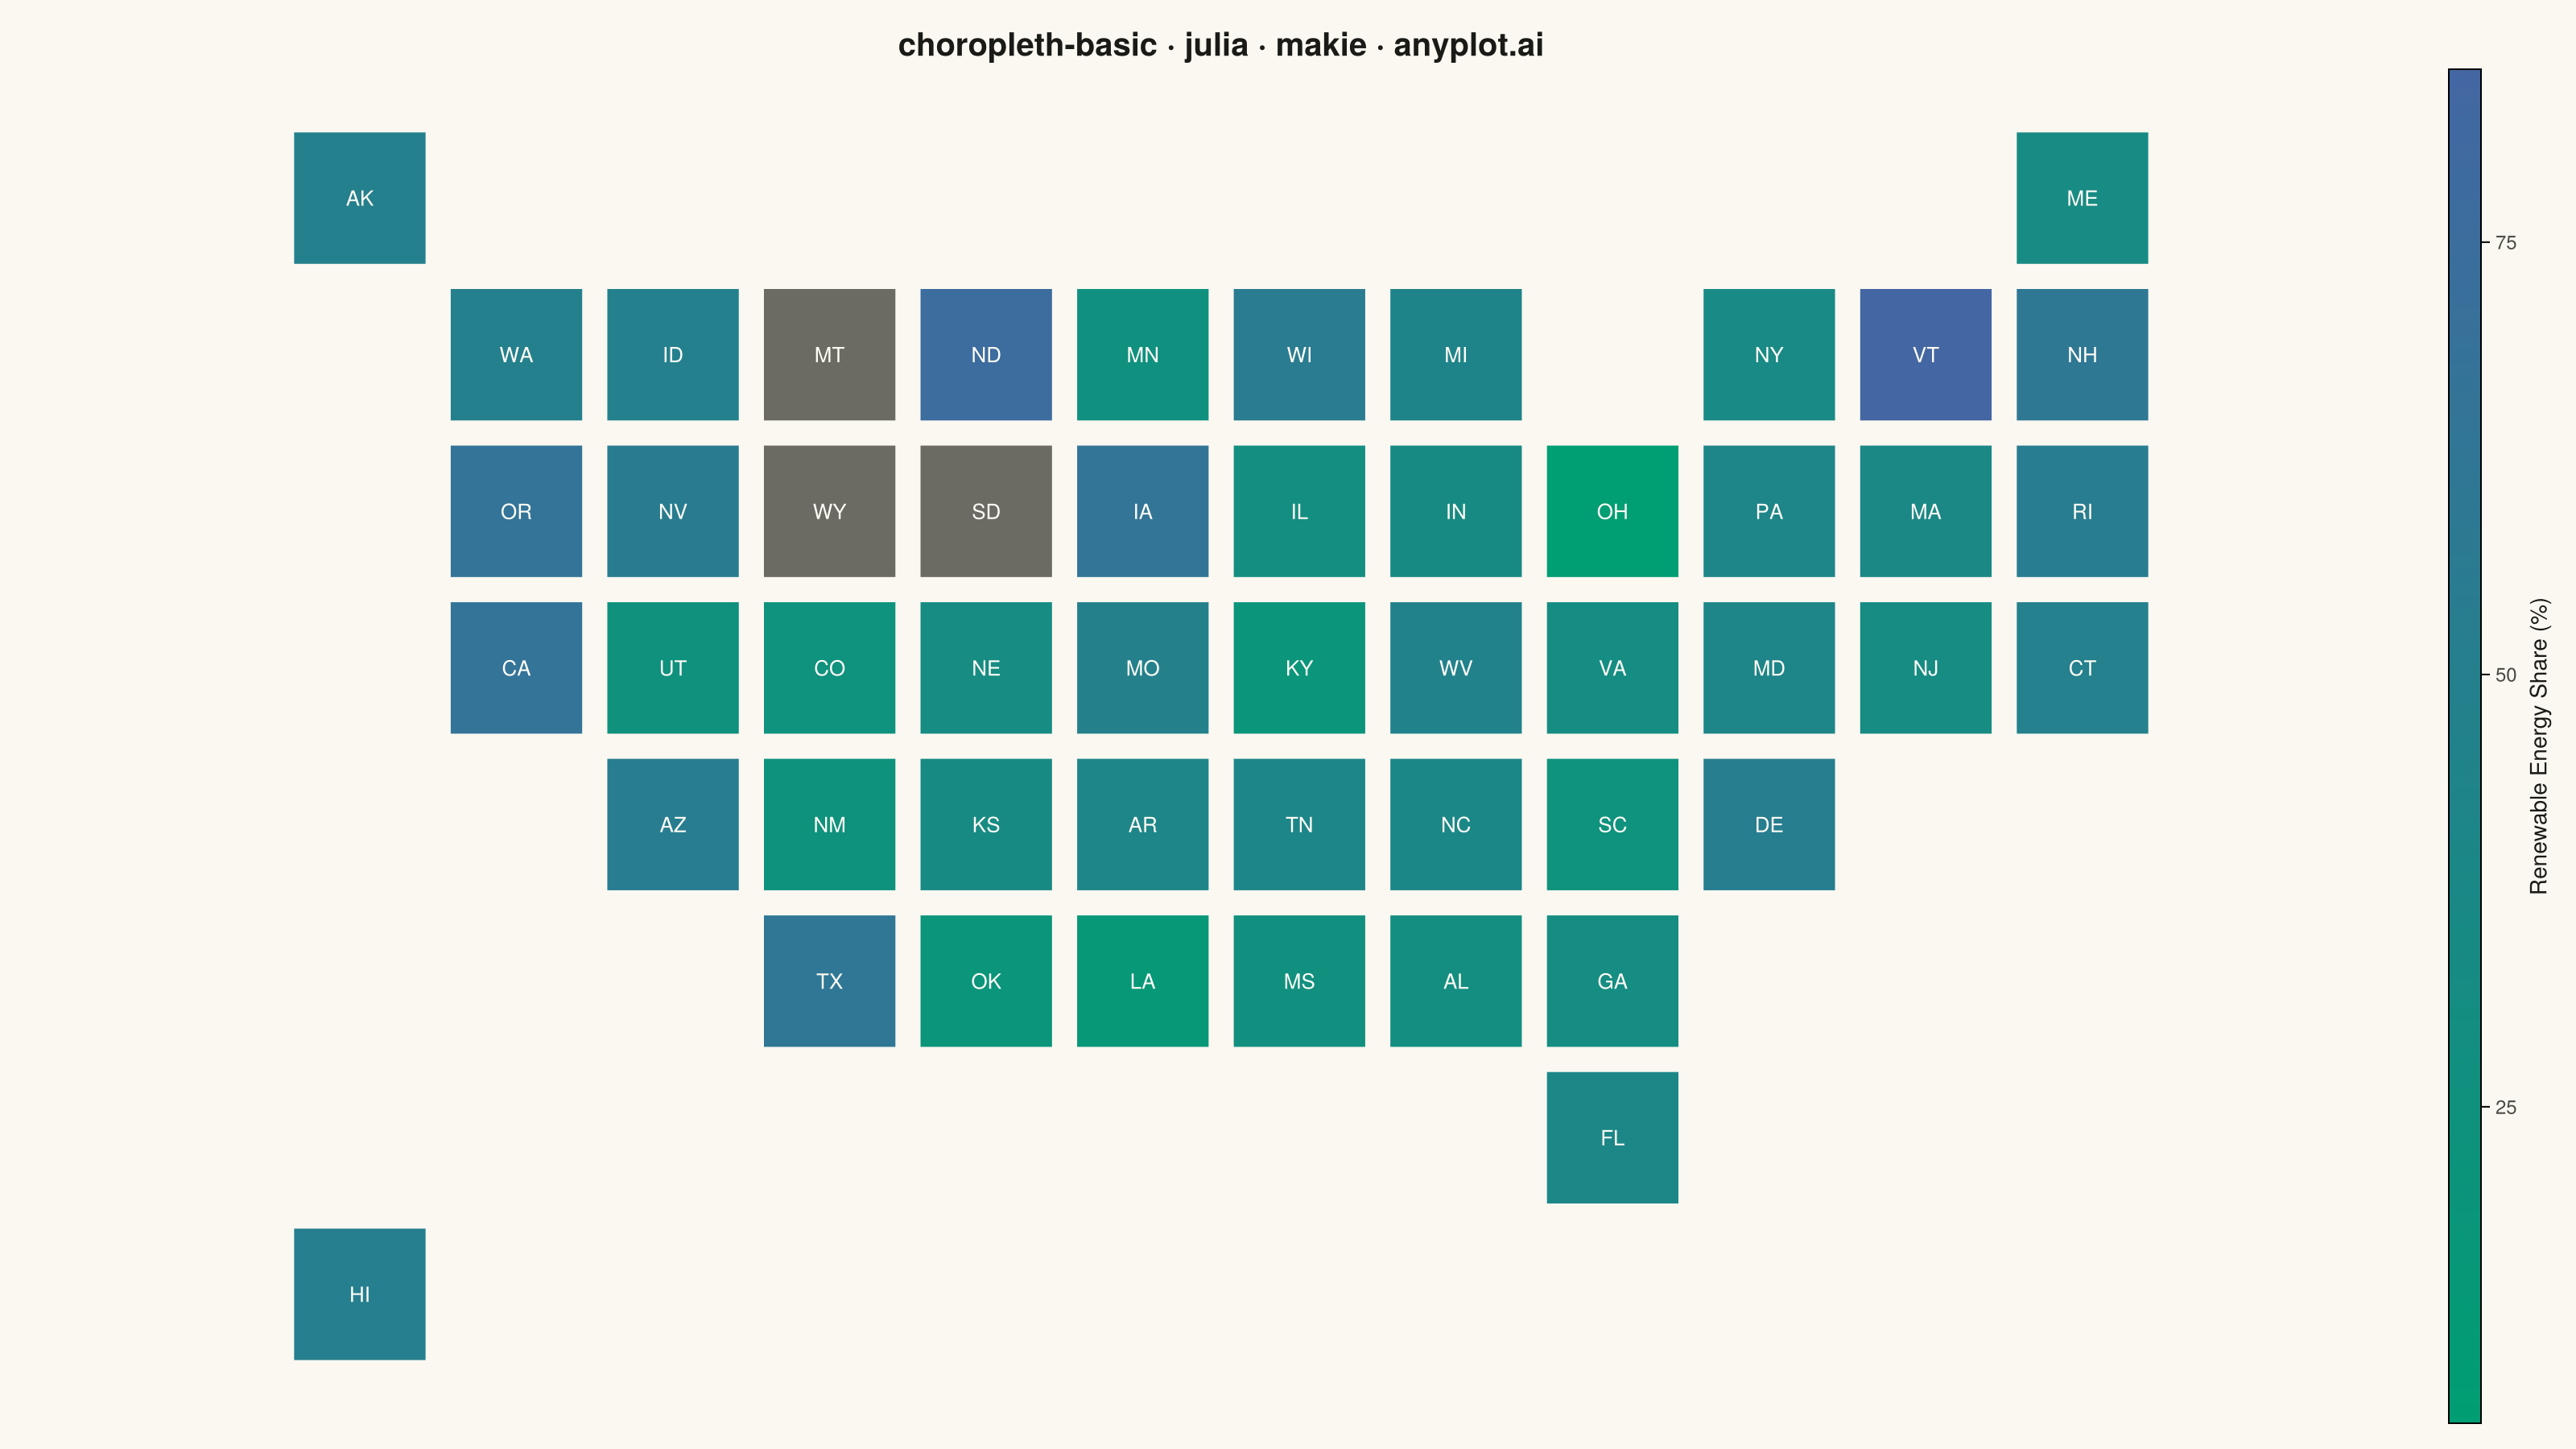
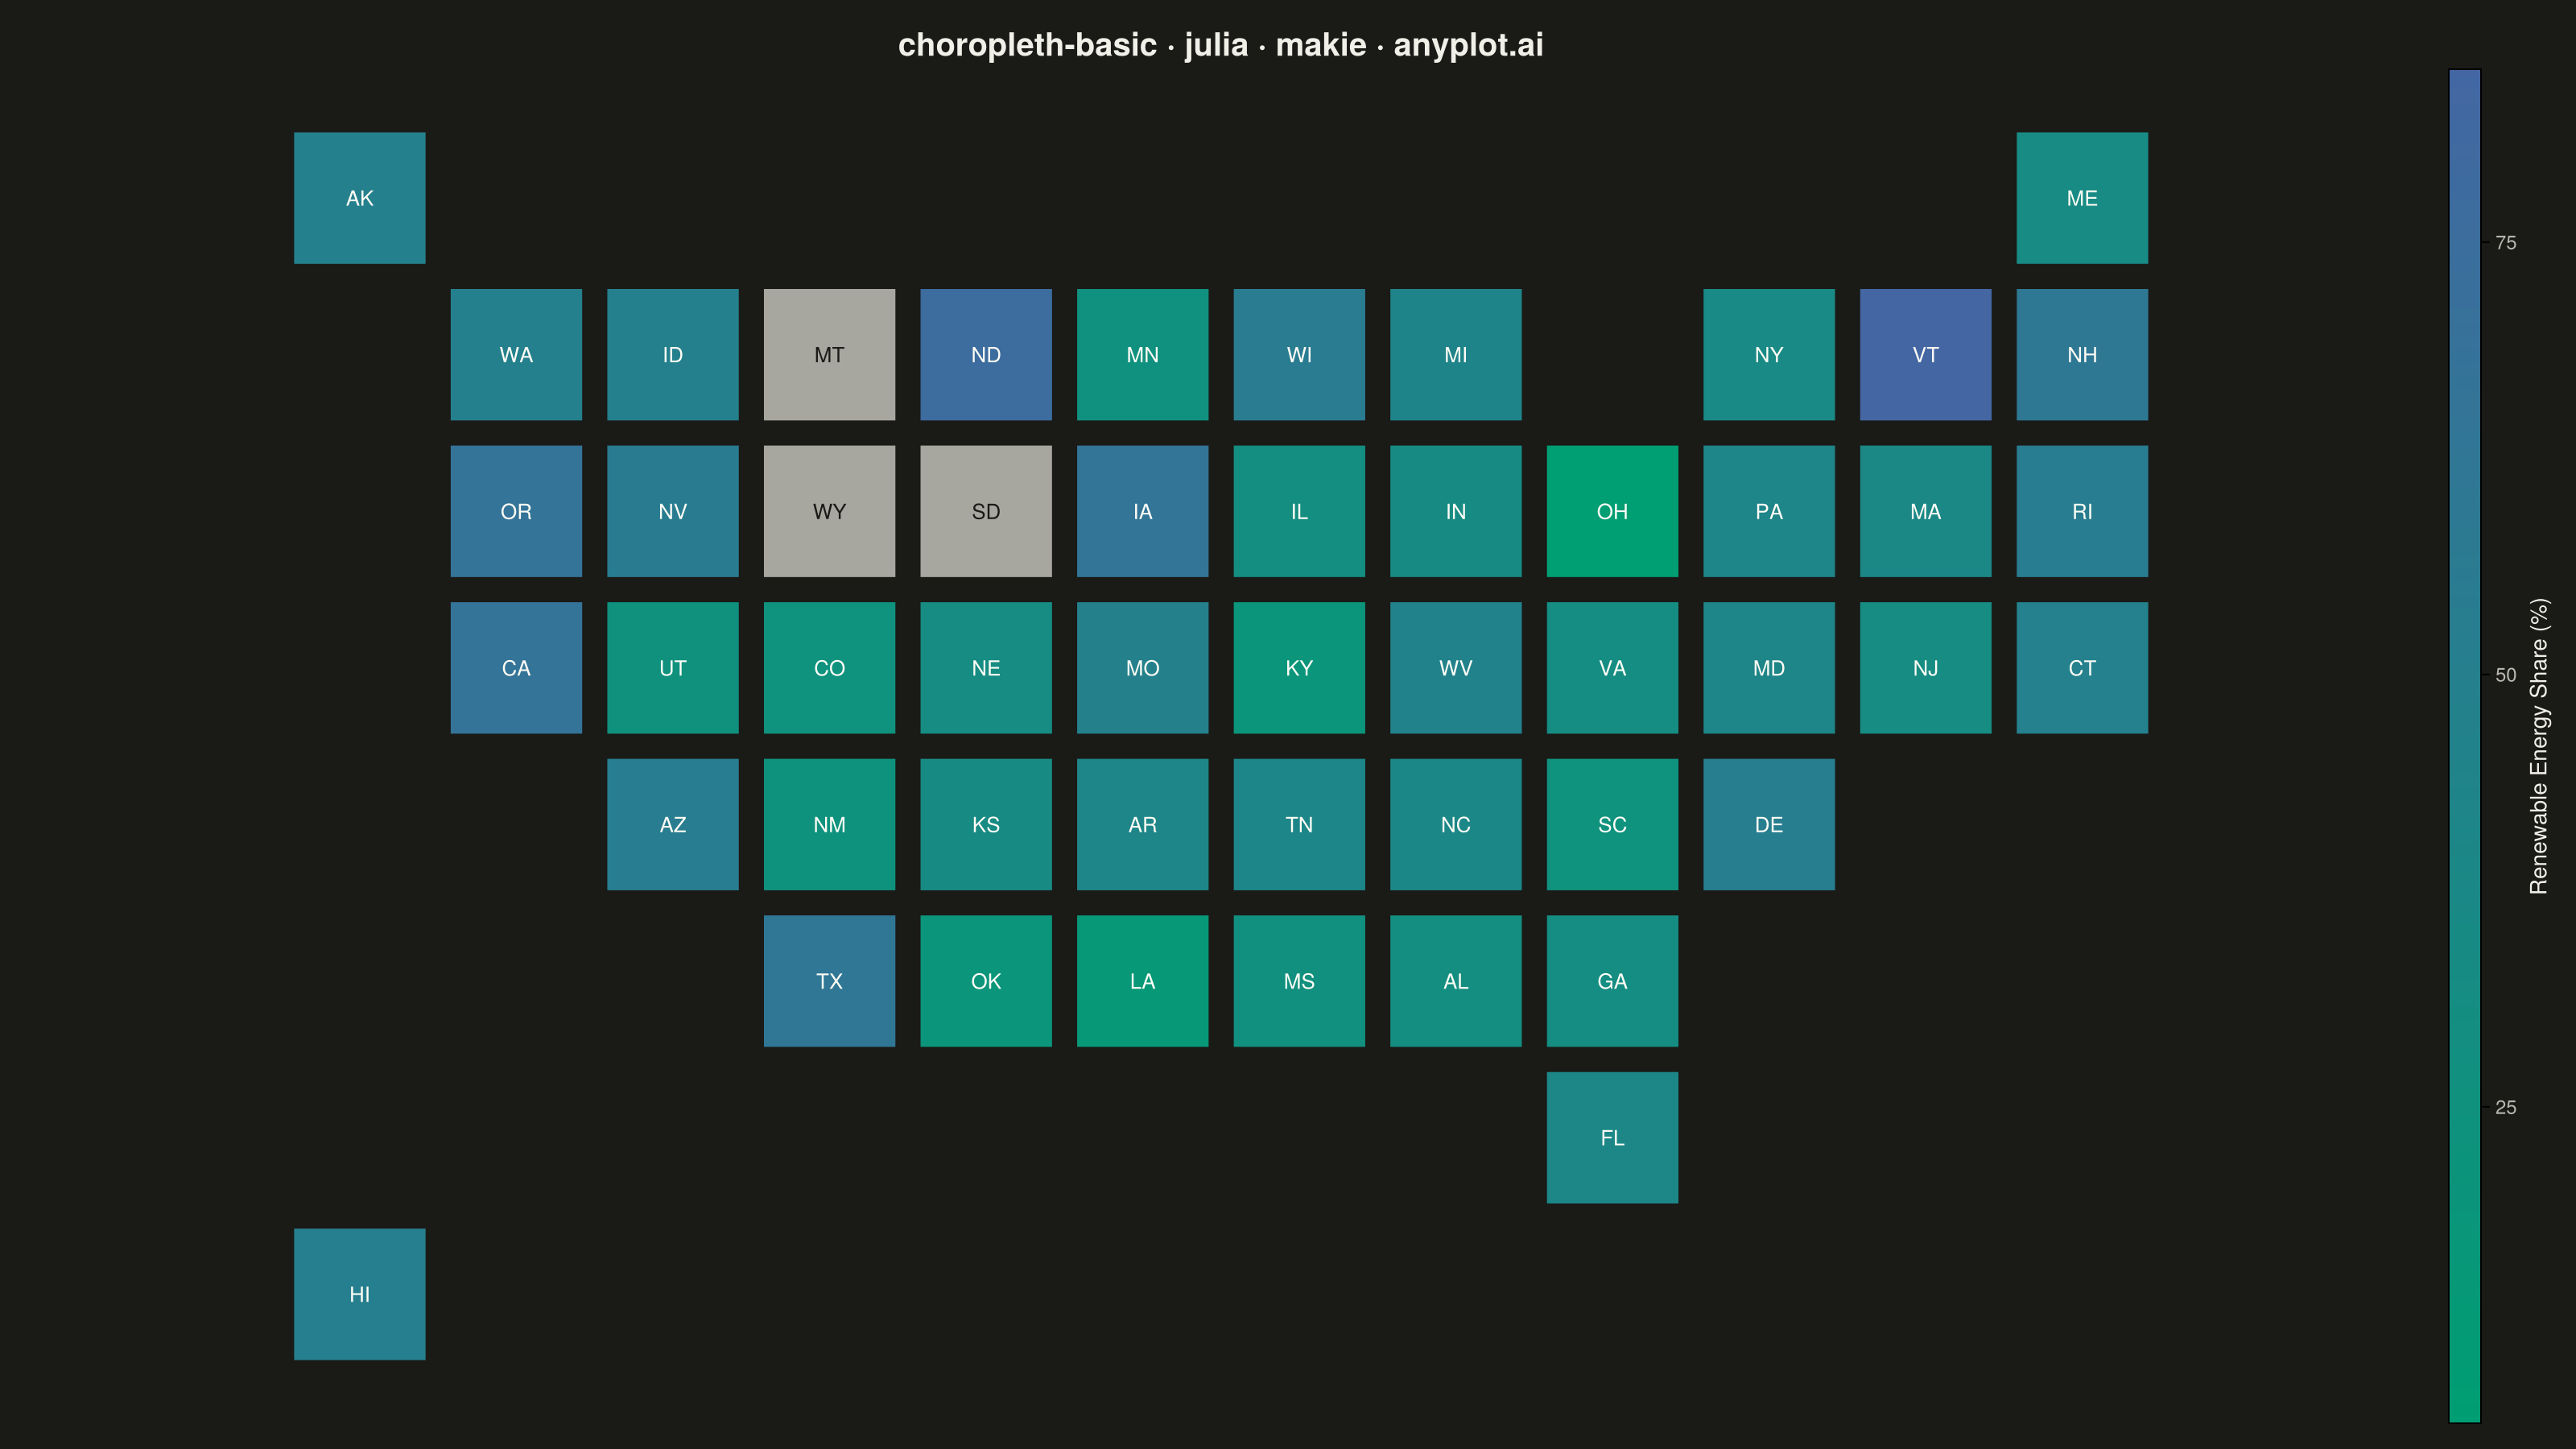
The same plot in 13 other libraries — Python: Altair, Bokeh, lets-plot, Matplotlib, Plotly, plotnine, Pygal, Seaborn; R: ggplot2; JavaScript: Chart.js, D3.js, Apache ECharts, Highcharts. Compare all 14 side by side: Choropleth Map with Regional Coloring in Python, R, Julia and JavaScript.
A choropleth map visualizes data by shading geographic regions (countries, states, or counties) according to a measured variable. This technique is ideal for showing regional patterns and spatial distributions, making it easy to identify areas with high or low values at a glance. The color intensity represents the data magnitude, creating an intuitive way to understand geographic variation.
# anyplot.ai
# choropleth-basic: Choropleth Map with Regional Coloring
# Library: makie 0.21.9 | Julia 1.11.9
# Quality: 88/100 | Created: 2026-09-02

using CairoMakie
using Colors
using ColorSchemes
using Random

Random.seed!(42)

# --- Theme tokens (see prompts/default-style-guide.md "Theme-adaptive Chrome")
const THEME    = get(ENV, "ANYPLOT_THEME", "light")
const PAGE_BG  = THEME == "light" ? colorant"#FAF8F1" : colorant"#1A1A17"
const ELEVATED = THEME == "light" ? colorant"#FFFDF6" : colorant"#242420"
const INK      = THEME == "light" ? colorant"#1A1A17" : colorant"#F0EFE8"
const INK_SOFT = THEME == "light" ? colorant"#4A4A44" : colorant"#B8B7B0"
const MUTED    = THEME == "light" ? colorant"#6B6A63" : colorant"#A8A79F"
# Data tiles keep the same green/blue fill in both themes, so the label ink
# drawn on top of them must stay fixed too — it must NOT follow a
# theme-adaptive chrome token like ELEVATED, which is for callout-box
# backgrounds and correctly flips dark in dark mode (wrong here).
const DATA_TILE_INK = colorant"#FFFDF6"

# Imprint sequential colormap — single-polarity continuous data
const IMPRINT_SEQ = cgrad([colorant"#009E73", colorant"#4467A3"])

# --- Data: renewable-energy share by U.S. state (%) -------------------------
# CairoMakie has no geographic-projection support in this runtime (no
# GeoMakie / shapefile access), so states are laid out on a schematic
# west-to-east, north-to-south grid instead of true polygon boundaries —
# a standard "tile grid map" technique for choropleth-style regional
# shading that needs no shapefile dependency. Each cell holds (col, row).
const STATE_GRID = Dict(
    "AK" => (0, 0), "ME" => (11, 0),
    "WA" => (1, 1), "ID" => (2, 1), "MT" => (3, 1), "ND" => (4, 1),
    "MN" => (5, 1), "WI" => (6, 1), "MI" => (7, 1), "NY" => (9, 1),
    "VT" => (10, 1), "NH" => (11, 1),
    "OR" => (1, 2), "NV" => (2, 2), "WY" => (3, 2), "SD" => (4, 2),
    "IA" => (5, 2), "IL" => (6, 2), "IN" => (7, 2), "OH" => (8, 2),
    "PA" => (9, 2), "MA" => (10, 2), "RI" => (11, 2),
    "CA" => (1, 3), "UT" => (2, 3), "CO" => (3, 3), "NE" => (4, 3),
    "MO" => (5, 3), "KY" => (6, 3), "WV" => (7, 3), "VA" => (8, 3),
    "MD" => (9, 3), "NJ" => (10, 3), "CT" => (11, 3),
    "AZ" => (2, 4), "NM" => (3, 4), "KS" => (4, 4), "AR" => (5, 4),
    "TN" => (6, 4), "NC" => (7, 4), "SC" => (8, 4), "DE" => (9, 4),
    "TX" => (3, 5), "OK" => (4, 5), "LA" => (5, 5), "MS" => (6, 5),
    "AL" => (7, 5), "GA" => (8, 5),
    "FL" => (8, 6),
    "HI" => (0, 7),
)

states = sort(collect(keys(STATE_GRID)))

# Illustrative/synthetic values (not sourced from real generation
# statistics). A mild regional bias is layered on top of the random
# baseline — Pacific/Mountain/Plains states lean higher (wind + hydro
# capacity), a few coal-belt Southeast/Midwest states lean lower — so the
# map reads as a plausible spatial pattern rather than pure noise.
const HIGH_RENEWABLE_STATES = Set(["WA", "OR", "CA", "ID", "IA", "KS", "ND", "VT", "ME", "NH"])
const LOW_RENEWABLE_STATES  = Set(["WV", "KY", "IN", "OH", "MS", "AL", "LA"])

renewable_share = Dict{String, Float64}()
for s in states
    bias = s in HIGH_RENEWABLE_STATES ? 15.0 : (s in LOW_RENEWABLE_STATES ? -10.0 : 0.0)
    renewable_share[s] = clamp(round(15 + 55 * rand() + bias, digits=1), 5.0, 92.0)
end

# A few states have not reported yet — rendered as muted "no data" tiles
for s in ("MT", "SD", "WY")
    renewable_share[s] = NaN
end

data_values = [v for v in values(renewable_share) if !isnan(v)]
vmin, vmax = extrema(data_values)

# --- Plot ---------------------------------------------------------------
fig = Figure(
    resolution      = (1600, 900),
    fontsize        = 14,
    backgroundcolor = PAGE_BG,
)

ax = Axis(
    fig[1, 1];
    title           = "choropleth-basic · julia · makie · anyplot.ai",
    titlesize       = 20,
    titlecolor      = INK,
    backgroundcolor = PAGE_BG,
    aspect          = DataAspect(),
)
hidedecorations!(ax)
hidespines!(ax)

tile = 0.86  # tile side length; the 0.14 gap reads as grid seams between states

for s in states
    col, row = STATE_GRID[s]
    x, y = Float64(col), -Float64(row)
    v = renewable_share[s]
    missing_data = isnan(v)
    fill_color = missing_data ? MUTED : IMPRINT_SEQ[(v - vmin) / (vmax - vmin)]
    # MUTED flips from medium-dark (light theme) to medium-light (dark theme),
    # so the "no data" tile needs the opposite text tone from data tiles.
    text_color = missing_data ? (THEME == "light" ? ELEVATED : colorant"#1A1A17") : DATA_TILE_INK

    poly!(ax, Rect2f(x - tile / 2, y - tile / 2, tile, tile);
          color = fill_color, strokewidth = 2, strokecolor = PAGE_BG)
    text!(ax, Point2f(x, y); text = s, align = (:center, :center),
          fontsize = 13, color = text_color)
end

Colorbar(fig[1, 2];
    limits         = (vmin, vmax),
    colormap       = IMPRINT_SEQ,
    label          = "Renewable Energy Share (%)",
    labelcolor     = INK,
    ticklabelcolor = INK_SOFT,
    labelsize      = 14,
    ticklabelsize  = 12,
    width          = 20,
)
colgap!(fig.layout, 20)

# --- Save -------------------------------------------------------------------
save("plot-$(THEME).png", fig; px_per_unit = 2)
Runnable source as JSON, for any HTTP client: https://api.anyplot.ai/specs/choropleth-basic/makie/code. Any spec id and library id listed in llms-full.txt fit the same URL shape; every URL below is complete and callable.
{
  "spec_id": "choropleth-basic",
  "language": "julia",
  "library": "makie",
  "page": "https://anyplot.ai/choropleth-basic/julia/makie",
  "hub": "https://anyplot.ai/choropleth-basic",
  "code_json": "https://api.anyplot.ai/specs/choropleth-basic/makie/code",
  "spec_json": "https://api.anyplot.ai/specs/choropleth-basic",
  "render_light_png": "https://storage.googleapis.com/anyplot-images/plots/choropleth-basic/julia/makie/plot-light.png",
  "render_dark_png": "https://storage.googleapis.com/anyplot-images/plots/choropleth-basic/julia/makie/plot-dark.png",
  "quality_score": 88.0,
  "license": "MIT",
  "guide": "https://anyplot.ai/llms.txt"
}
Part of Choropleth Map with Regional Coloring on anyplot.ai.