The same plot in 13 other libraries — JavaScript: Chart.js, D3.js, Apache ECharts; Python: Altair, Bokeh, lets-plot, Matplotlib, Plotly, plotnine, Pygal, Seaborn; R: ggplot2; Julia: Makie.jl. Compare all 14 side by side: Choropleth Map with Regional Coloring in Python, R, Julia and JavaScript.
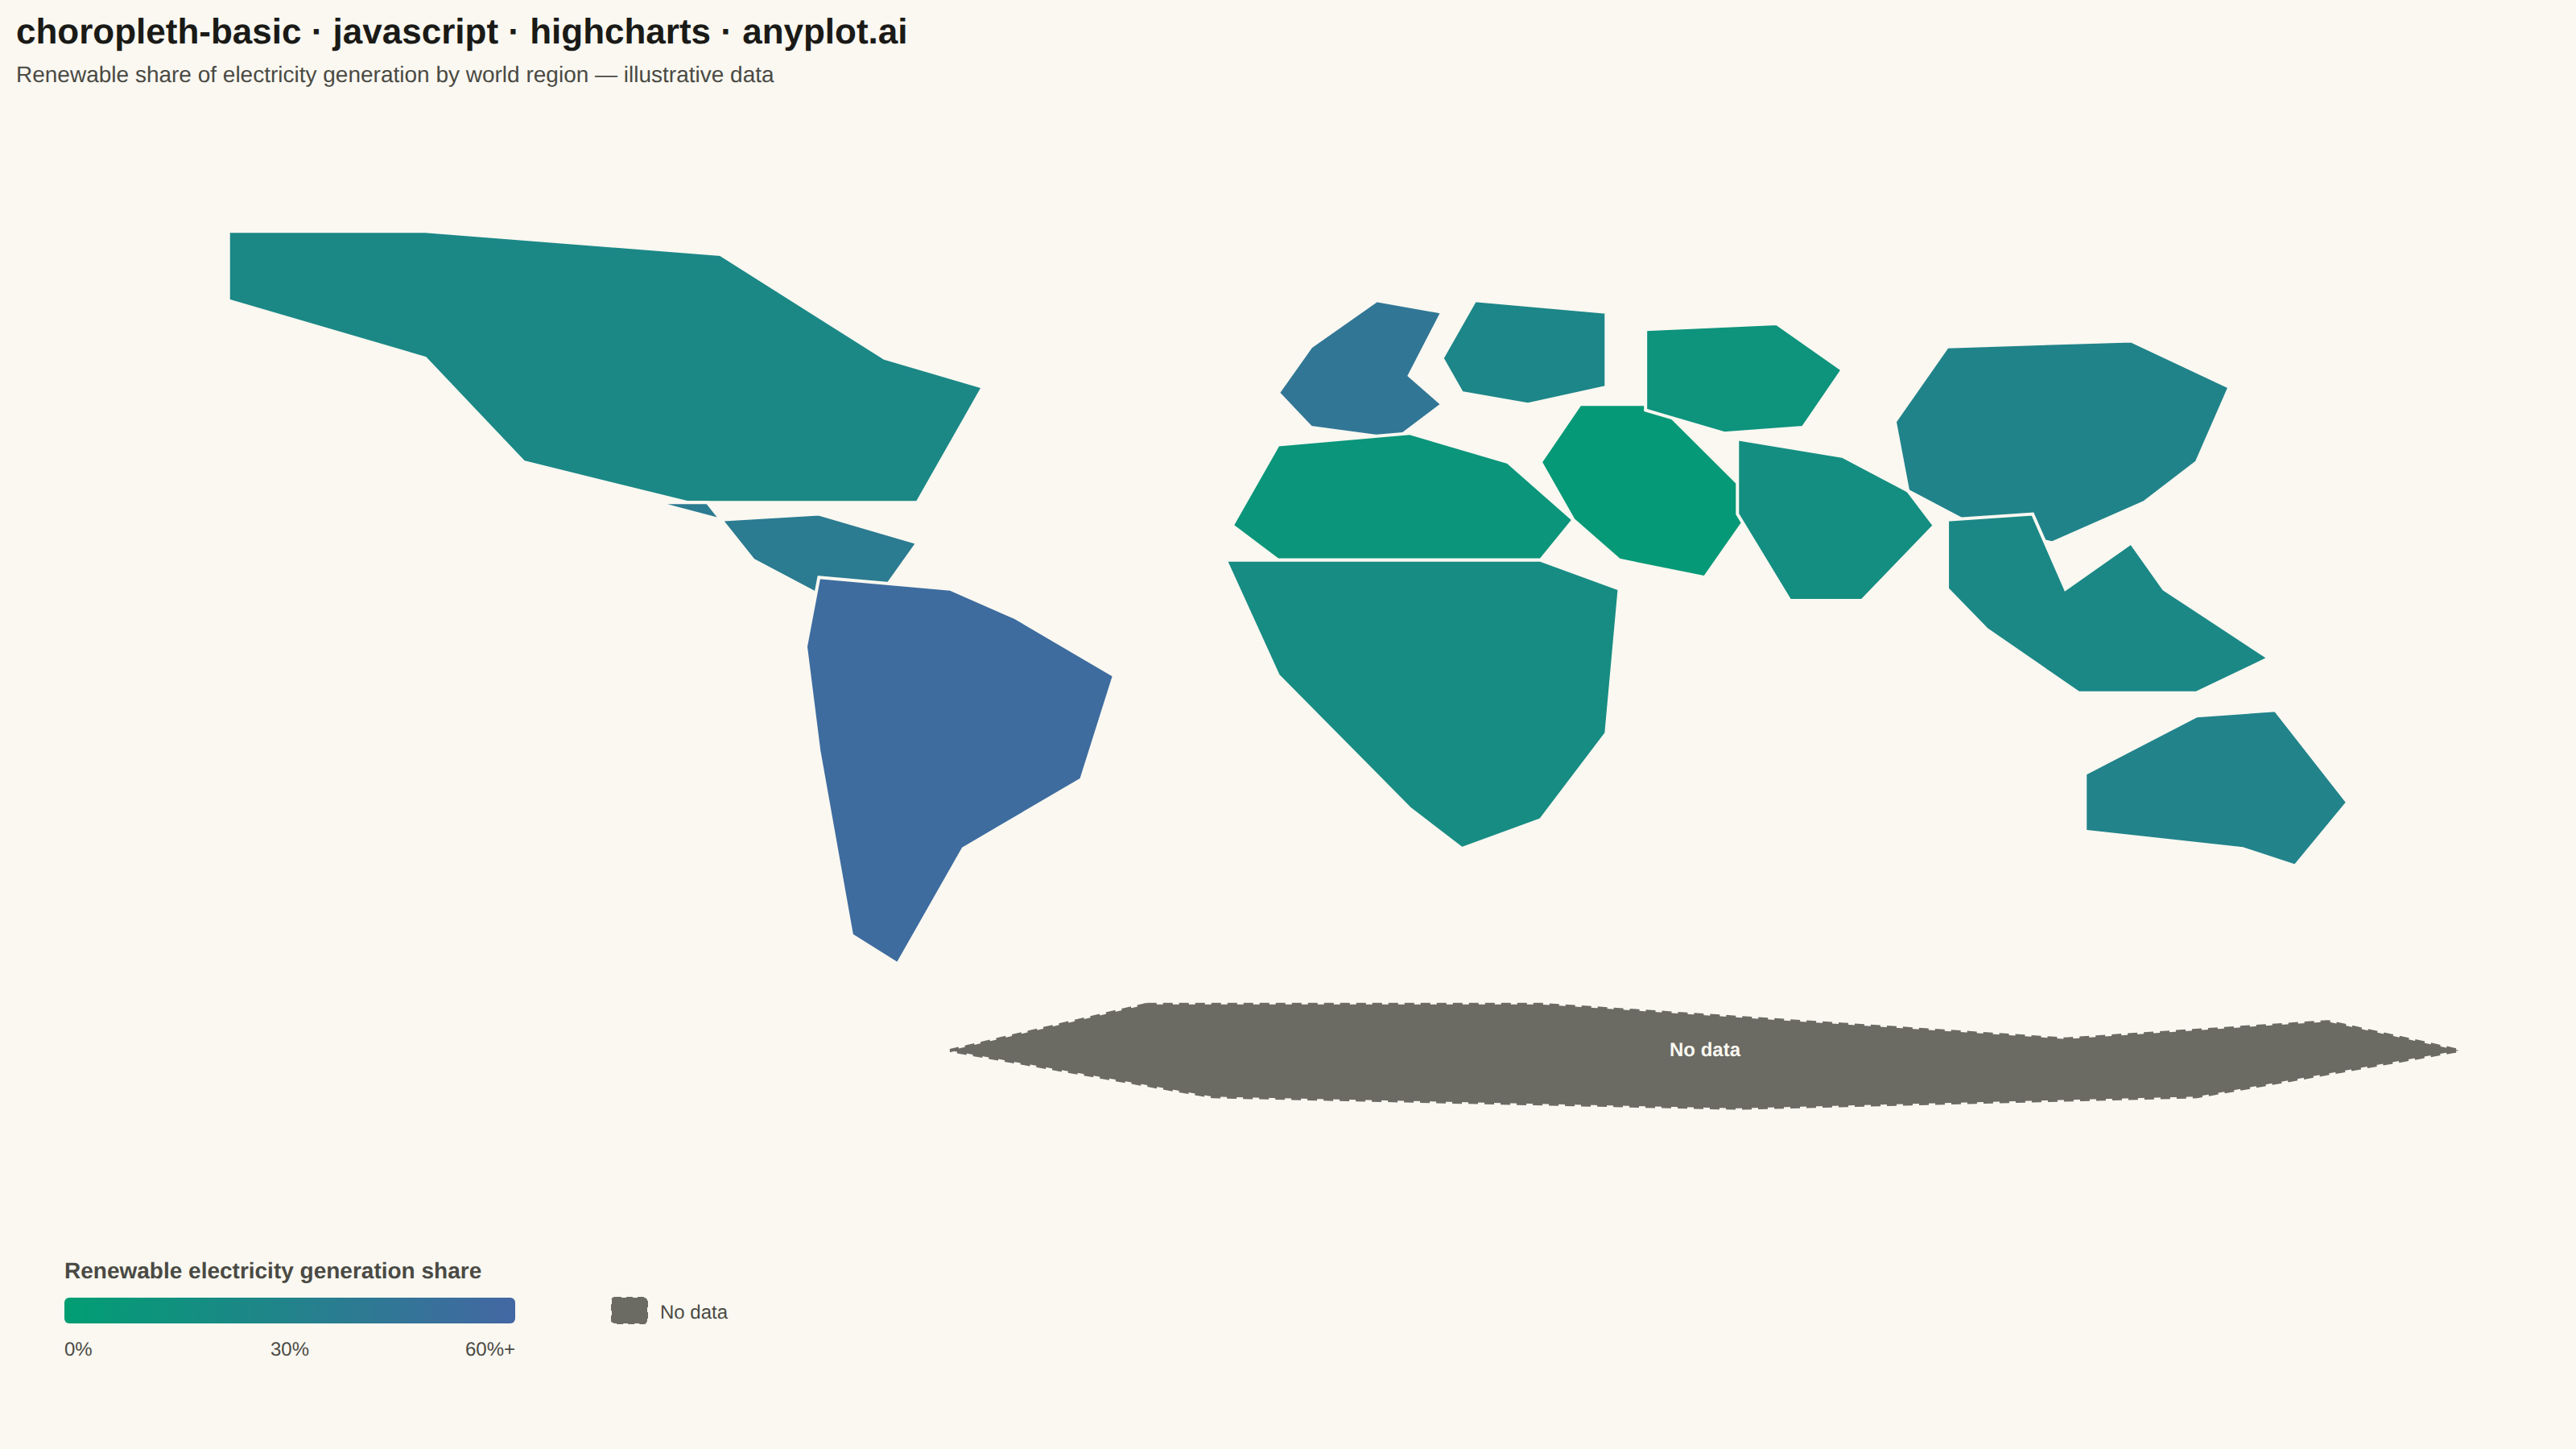
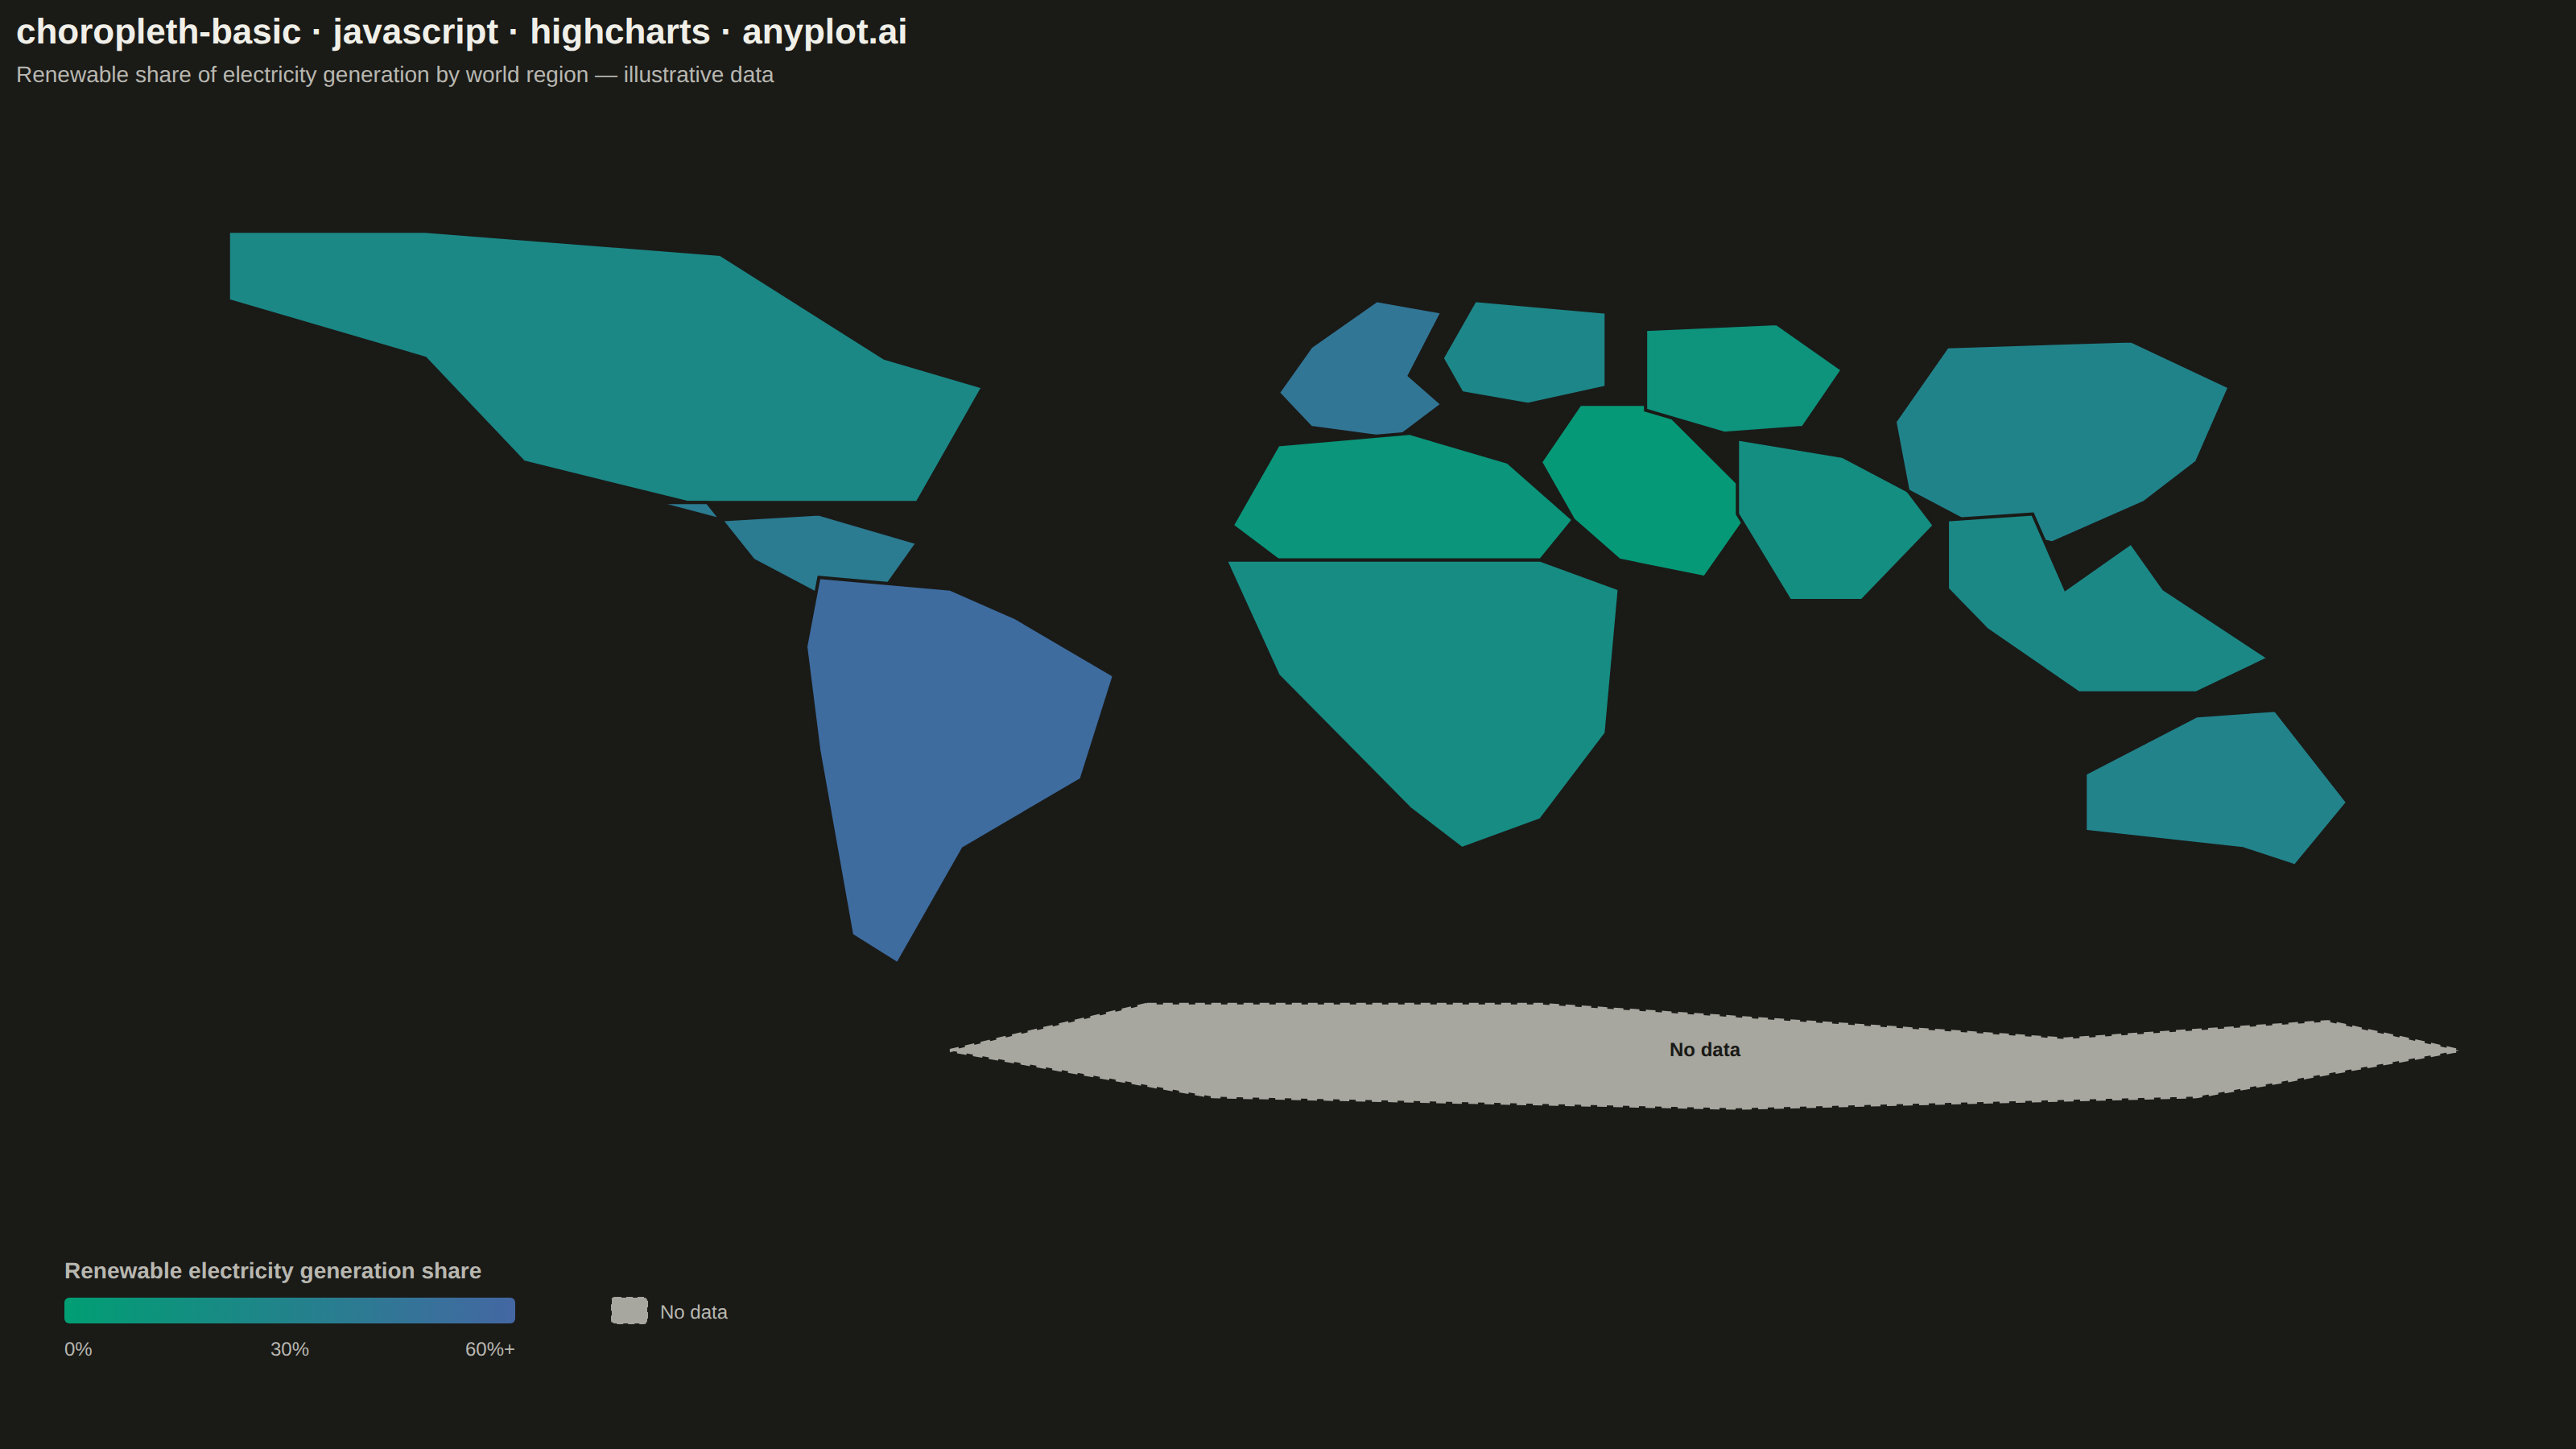
A choropleth map visualizes data by shading geographic regions (countries, states, or counties) according to a measured variable. This technique is ideal for showing regional patterns and spatial distributions, making it easy to identify areas with high or low values at a glance. The color intensity represents the data magnitude, creating an intuitive way to understand geographic variation.
// anyplot.ai
// choropleth-basic: Choropleth Map with Regional Coloring
// Library: highcharts 12.6.0 | JavaScript 22.23.2
// Quality: 86/100 | Created: 2026-09-02

const t = window.ANYPLOT_TOKENS;
const MUTED = t.theme === "dark" ? "#A8A79F" : "#6B6A63"; // adaptive "other / no data" anchor — not in ANYPLOT_TOKENS, mirrors default-style-guide.md

// --- Layout constants --------------------------------------------------------
// Only the core Highcharts bundle is loaded (no highmaps / mapChart series —
// see prompts/library/highcharts.md), so there is no built-in geographic
// projection or country topology to draw from. Region outlines below are
// hand-authored, deliberately coarse polygons (world-region silhouettes, not
// surveyed coastlines) plotted through ordinary linear lon/lat axes — a simple
// equirectangular-style projection — and filled with SVGRenderer paths. This
// mirrors the technique already used by this library's own
// scatter-map-geographic and heatmap-geographic implementations for the same
// "no highmaps module" constraint.
const MOUNT_WIDTH = 1600;
const MOUNT_HEIGHT = 900;
const MARGIN_LEFT = 40;
const MARGIN_RIGHT = 40;
const MARGIN_TOP = 115;
const MARGIN_BOTTOM = 140;
const PLOT_WIDTH = MOUNT_WIDTH - MARGIN_LEFT - MARGIN_RIGHT;
const PLOT_HEIGHT = MOUNT_HEIGHT - MARGIN_TOP - MARGIN_BOTTOM;

// LON_MIN/LON_MAX are asymmetric on purpose: the visible region mass (North
// America through Oceania) spans roughly lon -170..153, not a symmetric
// -170..170 — Antarctica's single eastward vertex at lon 170 is a thin sliver
// that barely registers visually. Padding both edges by the same 25° keeps
// the *content* horizontally centered instead of the raw coordinate extremes.
const LON_MIN = -195;
const LON_MAX = 178;
const LAT_MIN = -85;
const LAT_MAX = 80;
const PX_PER_LON = PLOT_WIDTH / (LON_MAX - LON_MIN);
const PX_PER_LAT = PLOT_HEIGHT / (LAT_MAX - LAT_MIN);

// --- Data: renewable share of electricity generation by world region (%) ---
// Illustrative figures (not sourced from a specific publication) chosen to
// respect real-world ordering: hydro-heavy South America highest, oil/gas
// exporting Middle East lowest. `value: null` demonstrates the spec's
// "handle missing data gracefully" requirement (Antarctica has no grid).
const REGIONS = [
  {
    name: "North America",
    value: 24,
    poly: [[-170, 72], [-140, 72], [-95, 68], [-70, 50], [-55, 45], [-65, 25], [-100, 25], [-125, 32], [-140, 50], [-170, 60]],
  },
  {
    name: "Central America & Caribbean",
    value: 38,
    poly: [[-105, 25], [-97, 25], [-90, 15], [-80, 9], [-77, 8], [-70, 10], [-65, 18], [-80, 23], [-95, 22]],
  },
  {
    name: "South America",
    value: 55,
    poly: [[-80, 12], [-60, 10], [-50, 5], [-35, -5], [-40, -23], [-58, -35], [-68, -55], [-75, -50], [-80, -18], [-82, 0]],
  },
  {
    name: "Western Europe",
    value: 44,
    poly: [[-10, 44], [-5, 52], [5, 60], [15, 58], [10, 47], [15, 42], [8, 36], [-5, 38]],
  },
  {
    name: "Eastern Europe",
    value: 26,
    poly: [[15, 50], [20, 60], [40, 58], [40, 45], [28, 42], [18, 44]],
  },
  {
    name: "North Africa",
    value: 10,
    poly: [[-17, 21], [-10, 35], [10, 37], [25, 32], [35, 22], [30, 15], [10, 15], [-10, 15]],
  },
  {
    name: "Sub-Saharan Africa",
    value: 20,
    poly: [[-18, 15], [10, 15], [30, 15], [42, 10], [40, -15], [30, -30], [18, -35], [10, -28], [-10, -5]],
  },
  {
    name: "Middle East",
    value: 5,
    poly: [[30, 32], [36, 42], [48, 42], [63, 25], [55, 12], [42, 15], [35, 22]],
  },
  {
    name: "Central Asia",
    value: 12,
    poly: [[46, 55], [66, 56], [76, 48], [70, 38], [58, 37], [46, 41]],
  },
  {
    name: "South Asia",
    value: 18,
    poly: [[60, 36], [76, 33], [86, 27], [90, 21], [79, 8], [68, 8], [60, 23]],
  },
  {
    name: "East Asia",
    value: 29,
    poly: [[84, 39], [92, 52], [120, 53], [135, 45], [130, 32], [122, 25], [108, 18], [96, 21], [86, 27]],
  },
  {
    name: "Southeast Asia",
    value: 24,
    poly: [[92, 22], [105, 23], [110, 10], [120, 18], [125, 10], [141, -2], [130, -8], [112, -8], [98, 3], [92, 10]],
  },
  {
    name: "Oceania",
    value: 30,
    poly: [[113, -22], [130, -12], [142, -11], [153, -27], [145, -38], [137, -35], [113, -32]],
  },
  {
    name: "Antarctica",
    value: null,
    poly: [[-30, -62], [30, -62], [70, -65], [110, -68], [150, -65], [170, -70], [130, -78], [60, -80], [-20, -78], [-60, -70]],
  },
];

const VALUE_MIN = 0;
const VALUE_MAX = 60;

// --- Helpers: sequential color scale + geometry ------------------------------
function hexToRgb(hex) {
  const n = parseInt(hex.slice(1), 16);
  return [(n >> 16) & 255, (n >> 8) & 255, n & 255];
}
function lerpColor(hexA, hexB, frac) {
  const a = hexToRgb(hexA);
  const b = hexToRgb(hexB);
  const rgb = a.map((c, i) => Math.round(c + (b[i] - c) * frac));
  return `#${rgb.map((v) => v.toString(16).padStart(2, "0")).join("")}`;
}
function colorForValue(value) {
  const frac = Math.min(1, Math.max(0, (value - VALUE_MIN) / (VALUE_MAX - VALUE_MIN)));
  return lerpColor(t.seq[0], t.seq[1], frac);
}
// Precompute centroid + a hover hit-radius (px) sized to fit inside each
// region's bounding box, so the invisible tooltip marker (below) never spills
// past its own polygon into a neighbor.
REGIONS.forEach((region) => {
  const lons = region.poly.map((p) => p[0]);
  const lats = region.poly.map((p) => p[1]);
  const minLon = Math.min(...lons);
  const maxLon = Math.max(...lons);
  const minLat = Math.min(...lats);
  const maxLat = Math.max(...lats);
  region.centroidLon = (minLon + maxLon) / 2;
  region.centroidLat = (minLat + maxLat) / 2;
  region.hitRadius = 0.42 * Math.min((maxLon - minLon) * PX_PER_LON, (maxLat - minLat) * PX_PER_LAT);
  region.fill = region.value === null ? MUTED : colorForValue(region.value);
});

// --- Region fills + boundaries (SVGRenderer, since highmaps is off-limits) --
function drawChoropleth(chart) {
  const xAxis = chart.xAxis[0];
  const yAxis = chart.yAxis[0];
  const toPath = (poly) =>
    poly.map((pt, i) => (i === 0 ? ["M", xAxis.toPixels(pt[0]), yAxis.toPixels(pt[1])] : ["L", xAxis.toPixels(pt[0]), yAxis.toPixels(pt[1])])).concat([["Z"]]);

  REGIONS.forEach((region) => {
    const attrs = {
      fill: region.fill,
      stroke: t.pageBg,
      "stroke-width": 2,
      zIndex: 1,
    };
    if (region.value === null) {
      attrs["stroke-dasharray"] = "6,4";
      attrs.stroke = MUTED;
    }
    chart.renderer.path(toPath(region.poly)).attr(attrs).add();
  });

  // "No data" label sits inside Antarctica's own silhouette — factual chrome
  // identifying the missing-data region, not a storytelling callout.
  const noData = REGIONS.find((r) => r.value === null);
  chart.renderer
    .text("No data", xAxis.toPixels(noData.centroidLon), yAxis.toPixels(noData.centroidLat))
    .attr({ align: "center", zIndex: 2 })
    .css({ color: t.pageBg, fontSize: "12px", fontWeight: "600" })
    .add();
}

// --- Manual color-scale legend (no colorAxis module in the core bundle) -----
function drawLegend(chart) {
  const r = chart.renderer;
  const x0 = chart.plotLeft;
  const y0 = chart.plotTop + chart.plotHeight + 46;
  const barWidth = 280;
  const barHeight = 16;

  r.text("Renewable electricity generation share", x0, y0 - 12)
    .css({ color: t.inkSoft, fontSize: "14px", fontWeight: "600" })
    .add();

  r.rect(x0, y0, barWidth, barHeight, 3)
    .attr({
      fill: { linearGradient: { x1: 0, y1: 0, x2: 1, y2: 0 }, stops: [[0, t.seq[0]], [1, t.seq[1]]] },
      "stroke-width": 0,
    })
    .add();
  [
    [0, `${VALUE_MIN}%`],
    [0.5, `${(VALUE_MIN + VALUE_MAX) / 2}%`],
    [1, `${VALUE_MAX}%+`],
  ].forEach(([frac, label]) => {
    r.text(label, x0 + frac * barWidth, y0 + barHeight + 20)
      .attr({ align: frac === 0 ? "left" : frac === 1 ? "right" : "center" })
      .css({ color: t.inkSoft, fontSize: "12px" })
      .add();
  });

  // "No data" swatch, matching the dashed Antarctica boundary style.
  const swatchX = x0 + barWidth + 60;
  r.rect(swatchX, y0, 22, barHeight, 2).attr({ fill: MUTED, stroke: MUTED, "stroke-width": 1, "stroke-dasharray": "4,3" }).add();
  r.text("No data", swatchX + 30, y0 + barHeight - 3).css({ color: t.inkSoft, fontSize: "12px" }).add();
}

// --- Chart -------------------------------------------------------------------
Highcharts.chart(
  "container",
  {
    chart: {
      type: "scatter",
      backgroundColor: "transparent",
      animation: false,
      style: { fontFamily: "inherit" },
      marginLeft: MARGIN_LEFT,
      marginRight: MARGIN_RIGHT,
      marginTop: MARGIN_TOP,
      marginBottom: MARGIN_BOTTOM,
    },
    credits: { enabled: false },
    colors: t.palette,
    title: {
      text: "choropleth-basic · javascript · highcharts · anyplot.ai",
      align: "left",
      style: { color: t.ink, fontSize: "22px", fontWeight: "600" },
    },
    subtitle: {
      text: "Renewable share of electricity generation by world region — illustrative data",
      align: "left",
      style: { color: t.inkSoft, fontSize: "14px" },
    },
    xAxis: {
      min: LON_MIN,
      max: LON_MAX,
      visible: false,
    },
    yAxis: {
      min: LAT_MIN,
      max: LAT_MAX,
      visible: false,
      title: { text: null },
    },
    legend: { enabled: false },
    tooltip: {
      backgroundColor: t.elevatedBg,
      borderColor: t.inkSoft,
      style: { color: t.ink, fontSize: "13px" },
      pointFormatter: function () {
        return this.custom.value === null ? `<b>${this.custom.name}</b><br/>No data available` : `<b>${this.custom.name}</b><br/>Renewable share: ${this.custom.value}%`;
      },
    },
    plotOptions: {
      series: { animation: false },
      scatter: { enableMouseTracking: true, states: { hover: { enabled: false } } },
    },
    series: [
      {
        name: "Regions",
        type: "scatter",
        showInLegend: false,
        zIndex: 3,
        data: REGIONS.map((region) => ({
          x: region.centroidLon,
          y: region.centroidLat,
          custom: { name: region.name, value: region.value },
          marker: { radius: region.hitRadius, fillColor: "rgba(0,0,0,0)", lineWidth: 0 },
        })),
      },
    ],
  },
  function (chart) {
    drawChoropleth(chart);
    drawLegend(chart);
  },
);
Runnable source as JSON, for any HTTP client: https://api.anyplot.ai/specs/choropleth-basic/highcharts/code. Any spec id and library id listed in llms-full.txt fit the same URL shape; every URL below is complete and callable.
{
  "spec_id": "choropleth-basic",
  "language": "javascript",
  "library": "highcharts",
  "page": "https://anyplot.ai/choropleth-basic/javascript/highcharts",
  "hub": "https://anyplot.ai/choropleth-basic",
  "code_json": "https://api.anyplot.ai/specs/choropleth-basic/highcharts/code",
  "spec_json": "https://api.anyplot.ai/specs/choropleth-basic",
  "render_light_png": "https://storage.googleapis.com/anyplot-images/plots/choropleth-basic/javascript/highcharts/plot-light.png",
  "render_dark_png": "https://storage.googleapis.com/anyplot-images/plots/choropleth-basic/javascript/highcharts/plot-dark.png",
  "interactive_light_html": "https://storage.googleapis.com/anyplot-images/plots/choropleth-basic/javascript/highcharts/plot-light.html",
  "interactive_dark_html": "https://storage.googleapis.com/anyplot-images/plots/choropleth-basic/javascript/highcharts/plot-dark.html",
  "quality_score": 86.0,
  "license": "MIT",
  "guide": "https://anyplot.ai/llms.txt"
}
Part of Choropleth Map with Regional Coloring on anyplot.ai.