The same plot in 13 other libraries — JavaScript: Chart.js, D3.js, Highcharts; Python: Altair, Bokeh, lets-plot, Matplotlib, Plotly, plotnine, Pygal, Seaborn; R: ggplot2; Julia: Makie.jl. Compare all 14 side by side: Choropleth Map with Regional Coloring in Python, R, Julia and JavaScript.
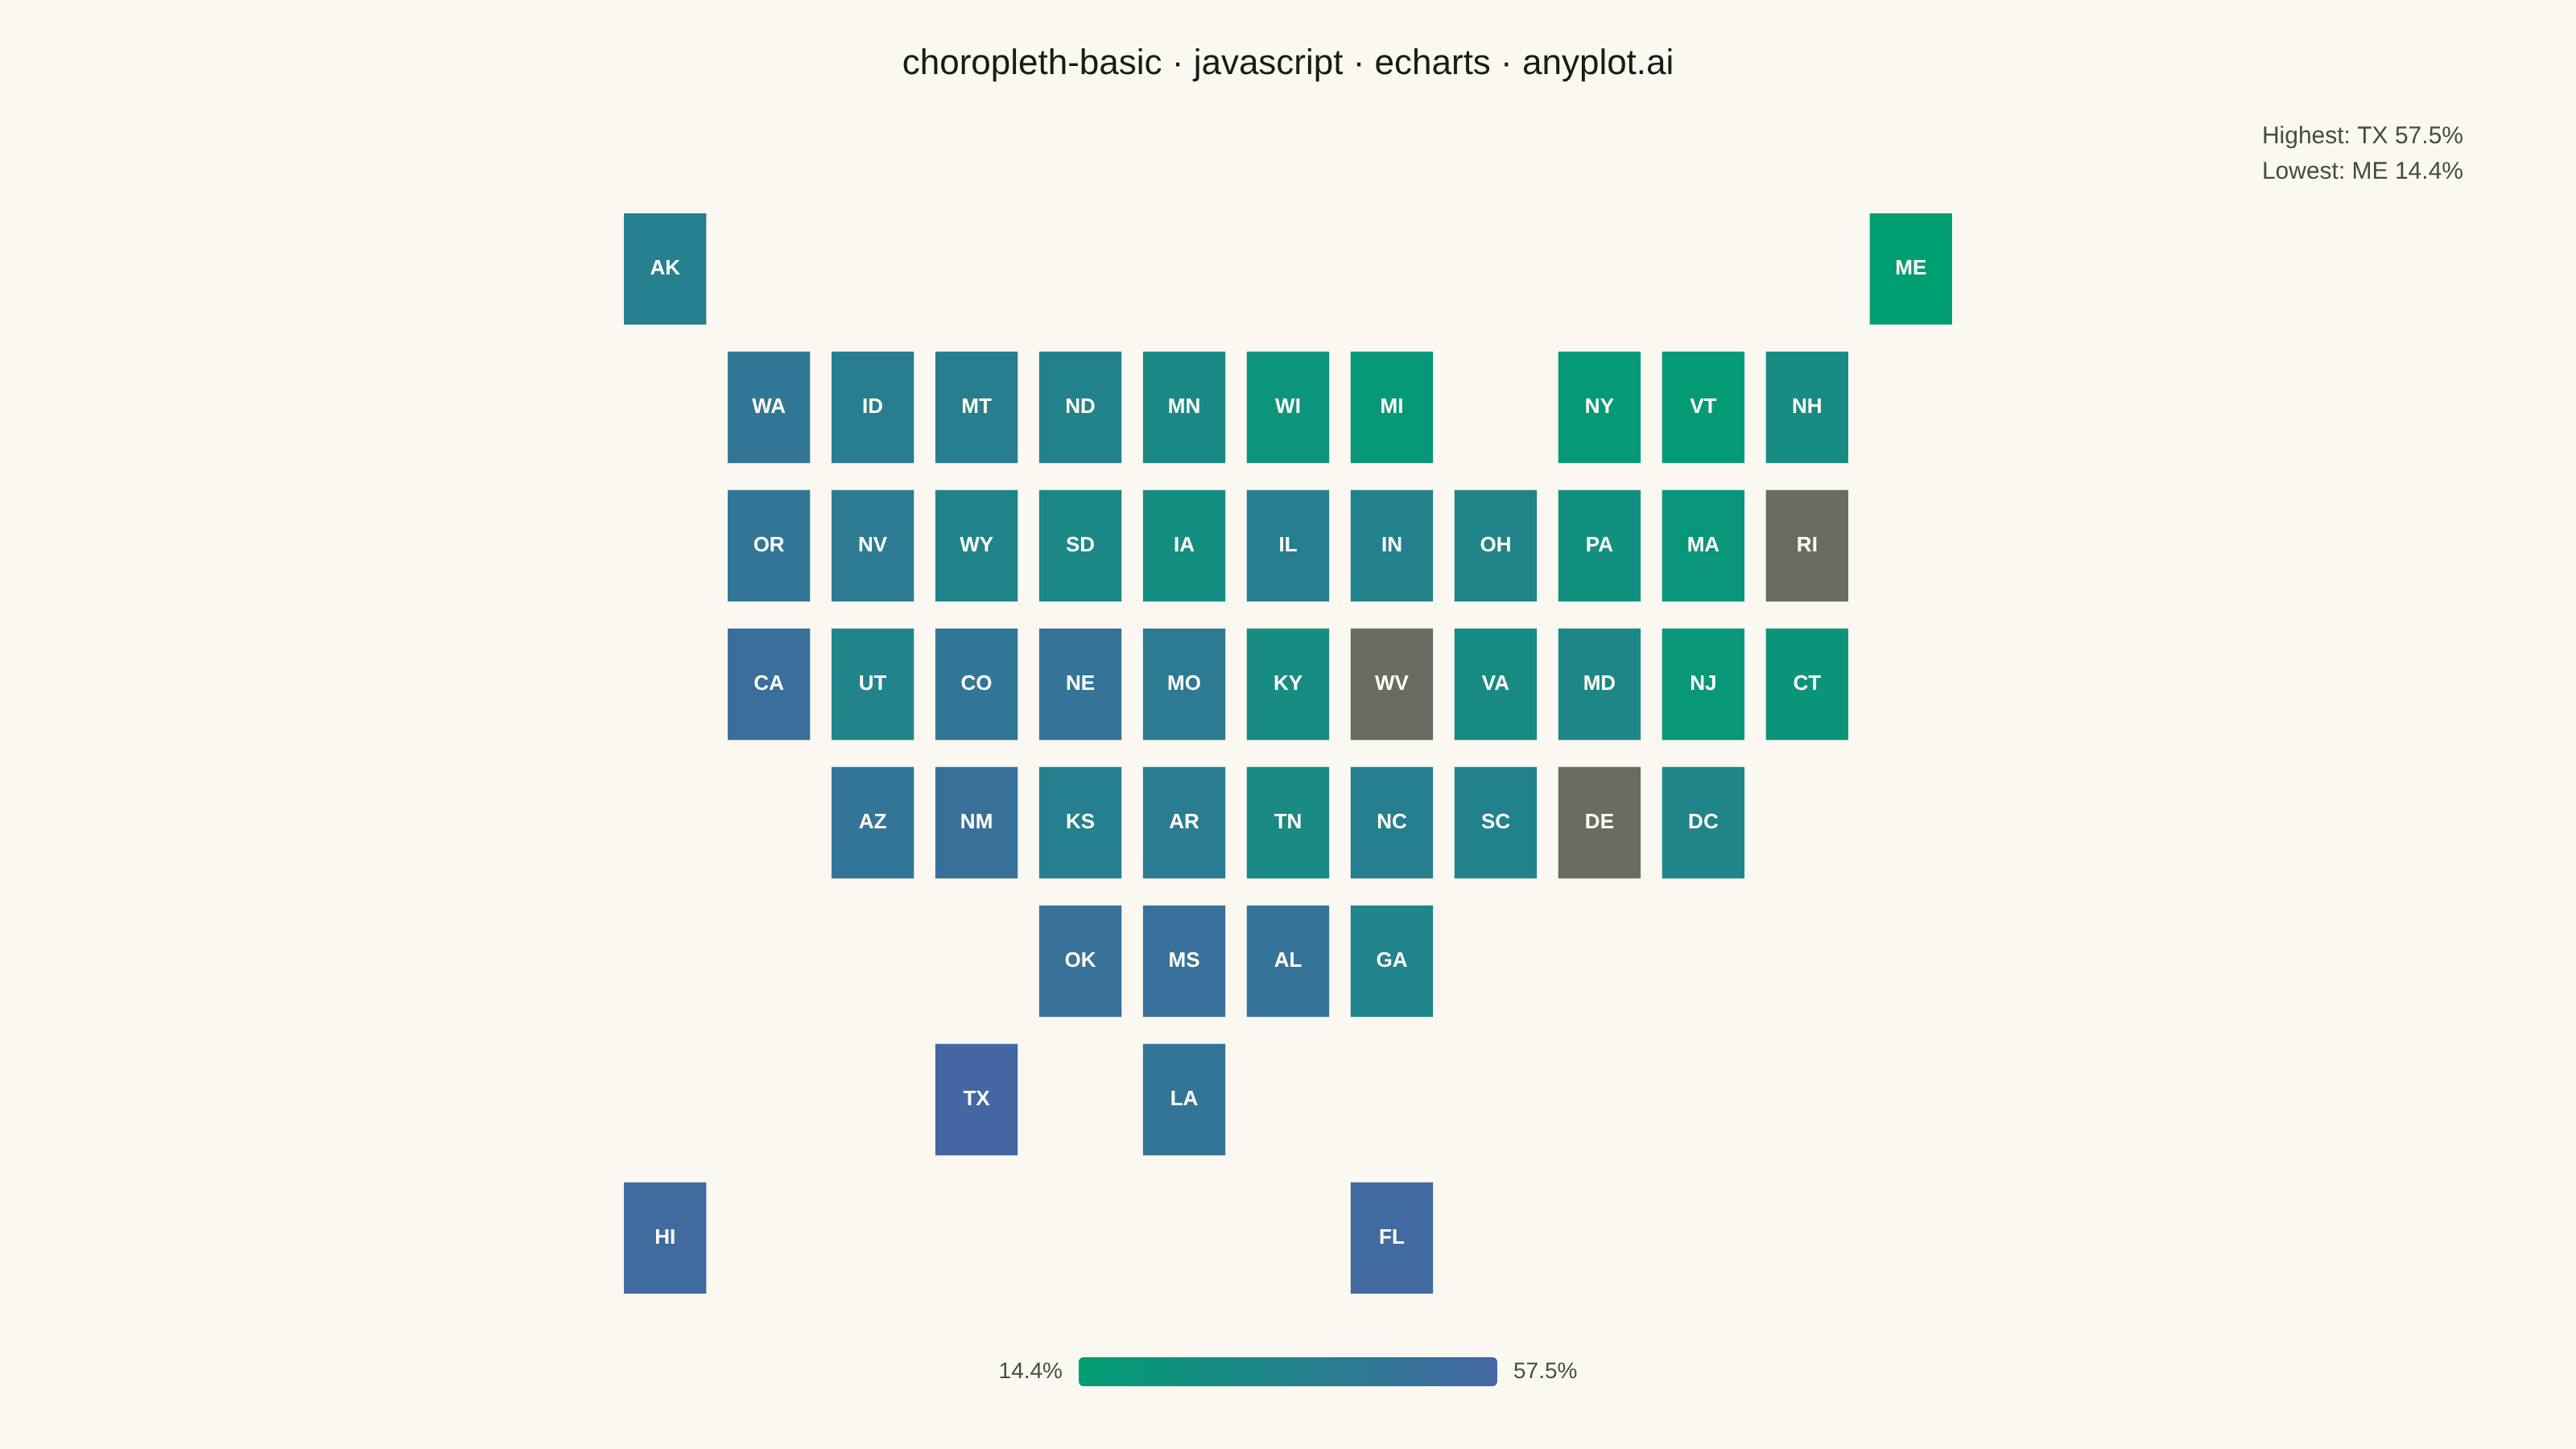
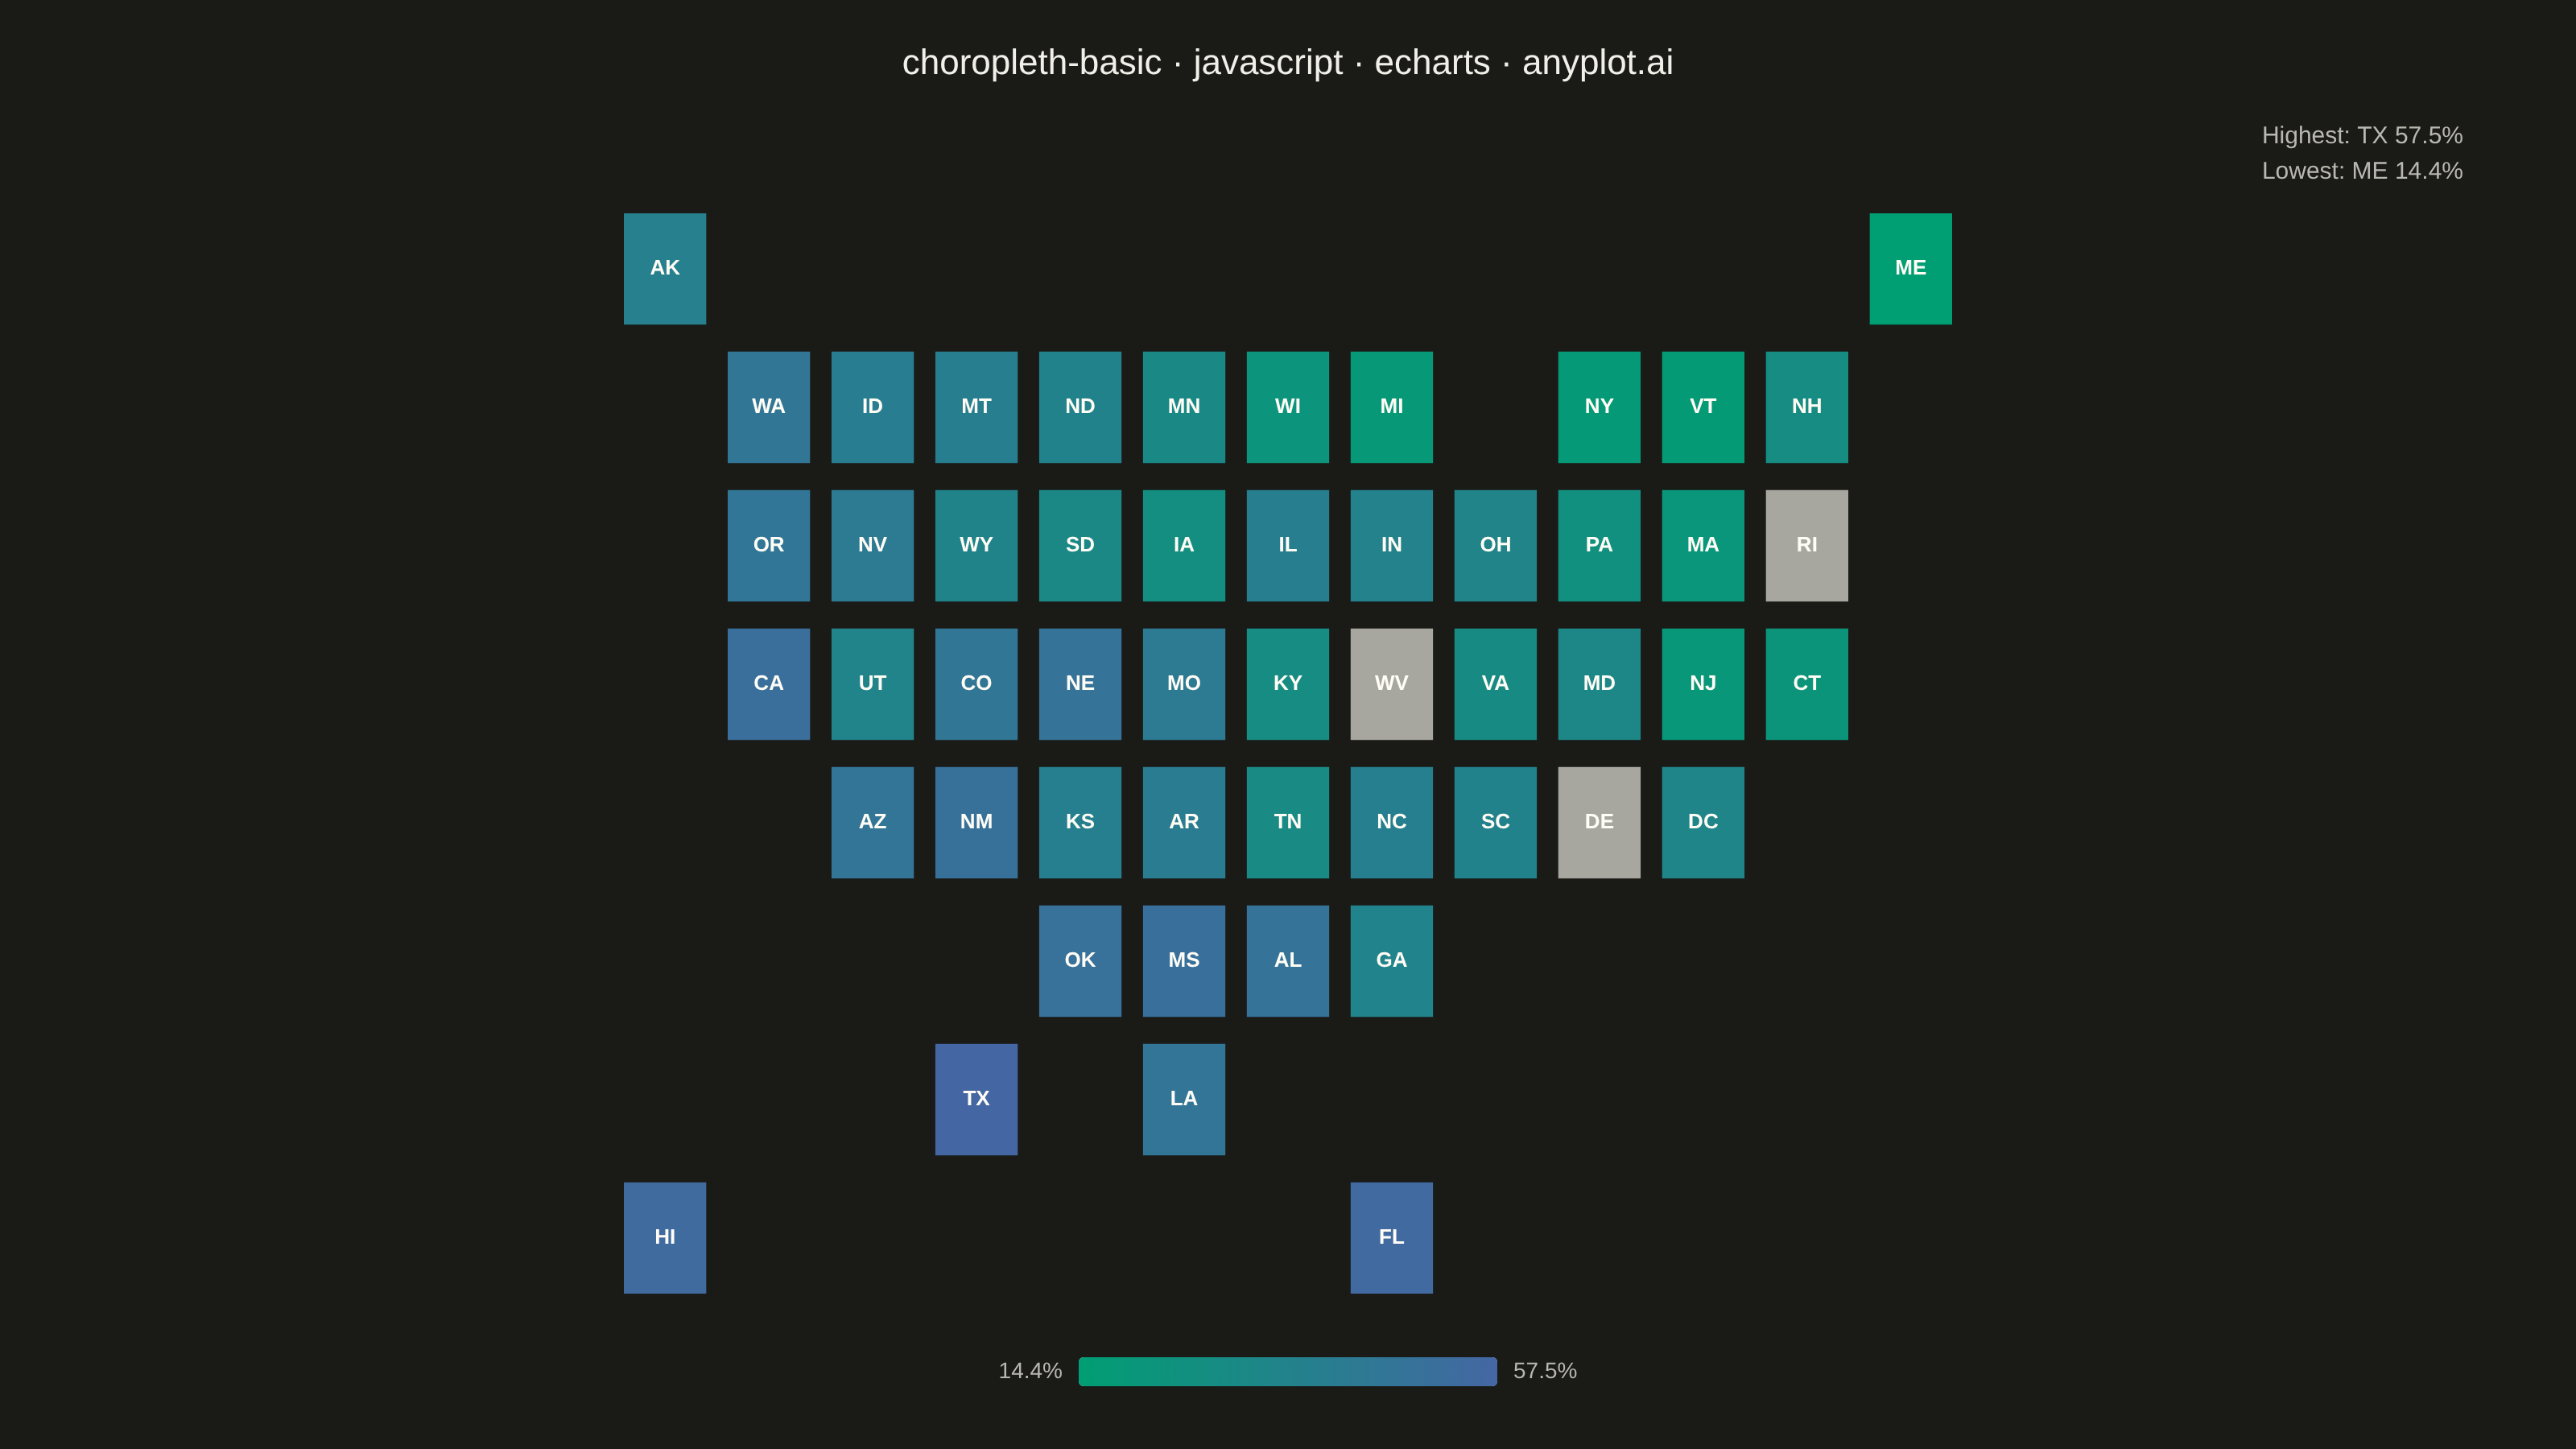
A choropleth map visualizes data by shading geographic regions (countries, states, or counties) according to a measured variable. This technique is ideal for showing regional patterns and spatial distributions, making it easy to identify areas with high or low values at a glance. The color intensity represents the data magnitude, creating an intuitive way to understand geographic variation.
// anyplot.ai
// choropleth-basic: Choropleth Map with Regional Coloring
// Library: echarts 6.1.0 | JavaScript 22.23.2
// Quality: 89/100 | Created: 2026-09-02
//# anyplot-orientation: landscape

const t = window.ANYPLOT_TOKENS;
// ANYPLOT_TOKENS has no "muted" entry — derive it the same way the Python/R
// implementations do (default-style-guide.md "Theme-adaptive Chrome").
const MUTED = t.theme === "light" ? "#6B6A63" : "#A8A79F";

// --- Data: renewable electricity share (%) by U.S. state -------------------
// No real GeoJSON boundaries are available offline, so states are laid out as
// a tile-grid cartogram (a standard choropleth variant that keeps every state
// equally legible regardless of its real land area). A small fixed-seed LCG
// stands in for Math.random(), which is not reproducible in the browser.
let seed = 42;
function nextRandom() {
  seed = (seed * 1103515245 + 12345) & 0x7fffffff;
  return seed / 0x7fffffff;
}

// [abbr, full name, grid row (0 = north), grid col (0 = west)]
const STATE_GRID = [
  ["AK", "Alaska", 0, 0], ["ME", "Maine", 0, 12],
  ["WA", "Washington", 1, 1], ["ID", "Idaho", 1, 2], ["MT", "Montana", 1, 3],
  ["ND", "North Dakota", 1, 4], ["MN", "Minnesota", 1, 5], ["WI", "Wisconsin", 1, 6],
  ["MI", "Michigan", 1, 7], ["NY", "New York", 1, 9], ["VT", "Vermont", 1, 10], ["NH", "New Hampshire", 1, 11],
  ["OR", "Oregon", 2, 1], ["NV", "Nevada", 2, 2], ["WY", "Wyoming", 2, 3],
  ["SD", "South Dakota", 2, 4], ["IA", "Iowa", 2, 5], ["IL", "Illinois", 2, 6],
  ["IN", "Indiana", 2, 7], ["OH", "Ohio", 2, 8], ["PA", "Pennsylvania", 2, 9],
  ["MA", "Massachusetts", 2, 10], ["RI", "Rhode Island", 2, 11],
  ["CA", "California", 3, 1], ["UT", "Utah", 3, 2], ["CO", "Colorado", 3, 3],
  ["NE", "Nebraska", 3, 4], ["MO", "Missouri", 3, 5], ["KY", "Kentucky", 3, 6],
  ["WV", "West Virginia", 3, 7], ["VA", "Virginia", 3, 8], ["MD", "Maryland", 3, 9],
  ["NJ", "New Jersey", 3, 10], ["CT", "Connecticut", 3, 11],
  ["AZ", "Arizona", 4, 2], ["NM", "New Mexico", 4, 3], ["KS", "Kansas", 4, 4],
  ["AR", "Arkansas", 4, 5], ["TN", "Tennessee", 4, 6], ["NC", "North Carolina", 4, 7],
  ["SC", "South Carolina", 4, 8], ["DE", "Delaware", 4, 9], ["DC", "District of Columbia", 4, 10],
  ["OK", "Oklahoma", 5, 4], ["MS", "Mississippi", 5, 5], ["AL", "Alabama", 5, 6], ["GA", "Georgia", 5, 7],
  ["TX", "Texas", 6, 3], ["LA", "Louisiana", 6, 5],
  ["FL", "Florida", 7, 7], ["HI", "Hawaii", 7, 0],
];

// A handful of states report no data this cycle -> rendered as muted gray.
const NO_DATA = new Set(["RI", "DE", "WV"]);

// The south/west "renewable potential" trend now dominates the per-state
// noise (boost spans ~0-46 vs. +/-9 of random jitter), so the tile colors
// visibly cluster warm-toward-blue in the south/west and cool-toward-green
// in the northeast rather than reading as random.
const stateValues = {};
STATE_GRID.forEach(([abbr, , row, col]) => {
  if (NO_DATA.has(abbr)) return;
  const southwestBoost = (12 - col) * 1.9 + row * 3.4; // more solar/wind potential toward the south/west
  const jitter = (nextRandom() - 0.5) * 18; // +/-9 points of per-state noise
  const value = 14 + southwestBoost + jitter;
  stateValues[abbr] = Math.round(Math.max(10, Math.min(value, 78)) * 10) / 10;
});

// --- Build a tile-grid GeoJSON: one padded square polygon per state --------
const PAD = 0.08;
const features = STATE_GRID.map(([abbr, , row, col]) => ({
  type: "Feature",
  properties: { name: abbr },
  geometry: {
    type: "Polygon",
    coordinates: [[
      [col + PAD, -row - 1 + PAD],
      [col + 1 - PAD, -row - 1 + PAD],
      [col + 1 - PAD, -row - PAD],
      [col + PAD, -row - PAD],
      [col + PAD, -row - 1 + PAD],
    ]],
  },
}));
echarts.registerMap("usStateTileGrid", { type: "FeatureCollection", features });

const values = Object.values(stateValues);
const minValue = Math.min(...values);
const maxValue = Math.max(...values);
const highestAbbr = Object.keys(stateValues).find((abbr) => stateValues[abbr] === maxValue);
const lowestAbbr = Object.keys(stateValues).find((abbr) => stateValues[abbr] === minValue);

// --- Init --------------------------------------------------------------------
const chart = echarts.init(document.getElementById("container"));

// --- Option --------------------------------------------------------------------
chart.setOption({
  animation: false,
  backgroundColor: "transparent",
  title: {
    text: "choropleth-basic · javascript · echarts · anyplot.ai",
    left: "center",
    top: 24,
    textStyle: { color: t.ink, fontSize: 22, fontWeight: 500 },
  },
  tooltip: {
    trigger: "item",
    formatter: (p) => (NO_DATA.has(p.name) ? `${p.name}: no data` : `${p.name}: ${p.value}%`),
  },
  graphic: [
    {
      type: "text",
      right: 70,
      top: 74,
      style: {
        text: `Highest: ${highestAbbr} ${maxValue}%\nLowest: ${lowestAbbr} ${minValue}%`,
        fill: t.inkSoft,
        fontSize: 15,
        lineHeight: 22,
        textAlign: "right",
      },
    },
  ],
  visualMap: {
    type: "continuous",
    min: minValue,
    max: maxValue,
    calculable: false,
    orient: "horizontal",
    left: "center",
    bottom: 24,
    itemWidth: 18,
    itemHeight: 260,
    inRange: { color: t.seq },
    text: [`${maxValue}%`, `${minValue}%`],
    textStyle: { color: t.inkSoft, fontSize: 14 },
  },
  series: [
    {
      type: "map",
      map: "usStateTileGrid",
      roam: false,
      layoutCenter: ["50%", "52%"],
      layoutSize: "92%",
      // NaN values fall outside visualMap's dimension and paint with this
      // fallback instead of the sequential ramp — the "gray" missing-data
      // treatment the spec calls for.
      itemStyle: {
        areaColor: MUTED,
        borderColor: t.pageBg,
        borderWidth: 3,
      },
      label: {
        show: true,
        color: "#FFFDF6",
        fontSize: 13,
        fontWeight: "bold",
      },
      data: STATE_GRID.map(([abbr]) => ({
        name: abbr,
        value: NO_DATA.has(abbr) ? NaN : stateValues[abbr],
      })),
    },
  ],
});
Runnable source as JSON, for any HTTP client: https://api.anyplot.ai/specs/choropleth-basic/echarts/code. Any spec id and library id listed in llms-full.txt fit the same URL shape; every URL below is complete and callable.
{
  "spec_id": "choropleth-basic",
  "language": "javascript",
  "library": "echarts",
  "page": "https://anyplot.ai/choropleth-basic/javascript/echarts",
  "hub": "https://anyplot.ai/choropleth-basic",
  "code_json": "https://api.anyplot.ai/specs/choropleth-basic/echarts/code",
  "spec_json": "https://api.anyplot.ai/specs/choropleth-basic",
  "render_light_png": "https://storage.googleapis.com/anyplot-images/plots/choropleth-basic/javascript/echarts/plot-light.png",
  "render_dark_png": "https://storage.googleapis.com/anyplot-images/plots/choropleth-basic/javascript/echarts/plot-dark.png",
  "interactive_light_html": "https://storage.googleapis.com/anyplot-images/plots/choropleth-basic/javascript/echarts/plot-light.html",
  "interactive_dark_html": "https://storage.googleapis.com/anyplot-images/plots/choropleth-basic/javascript/echarts/plot-dark.html",
  "quality_score": 89.0,
  "license": "MIT",
  "guide": "https://anyplot.ai/llms.txt"
}
Part of Choropleth Map with Regional Coloring on anyplot.ai.