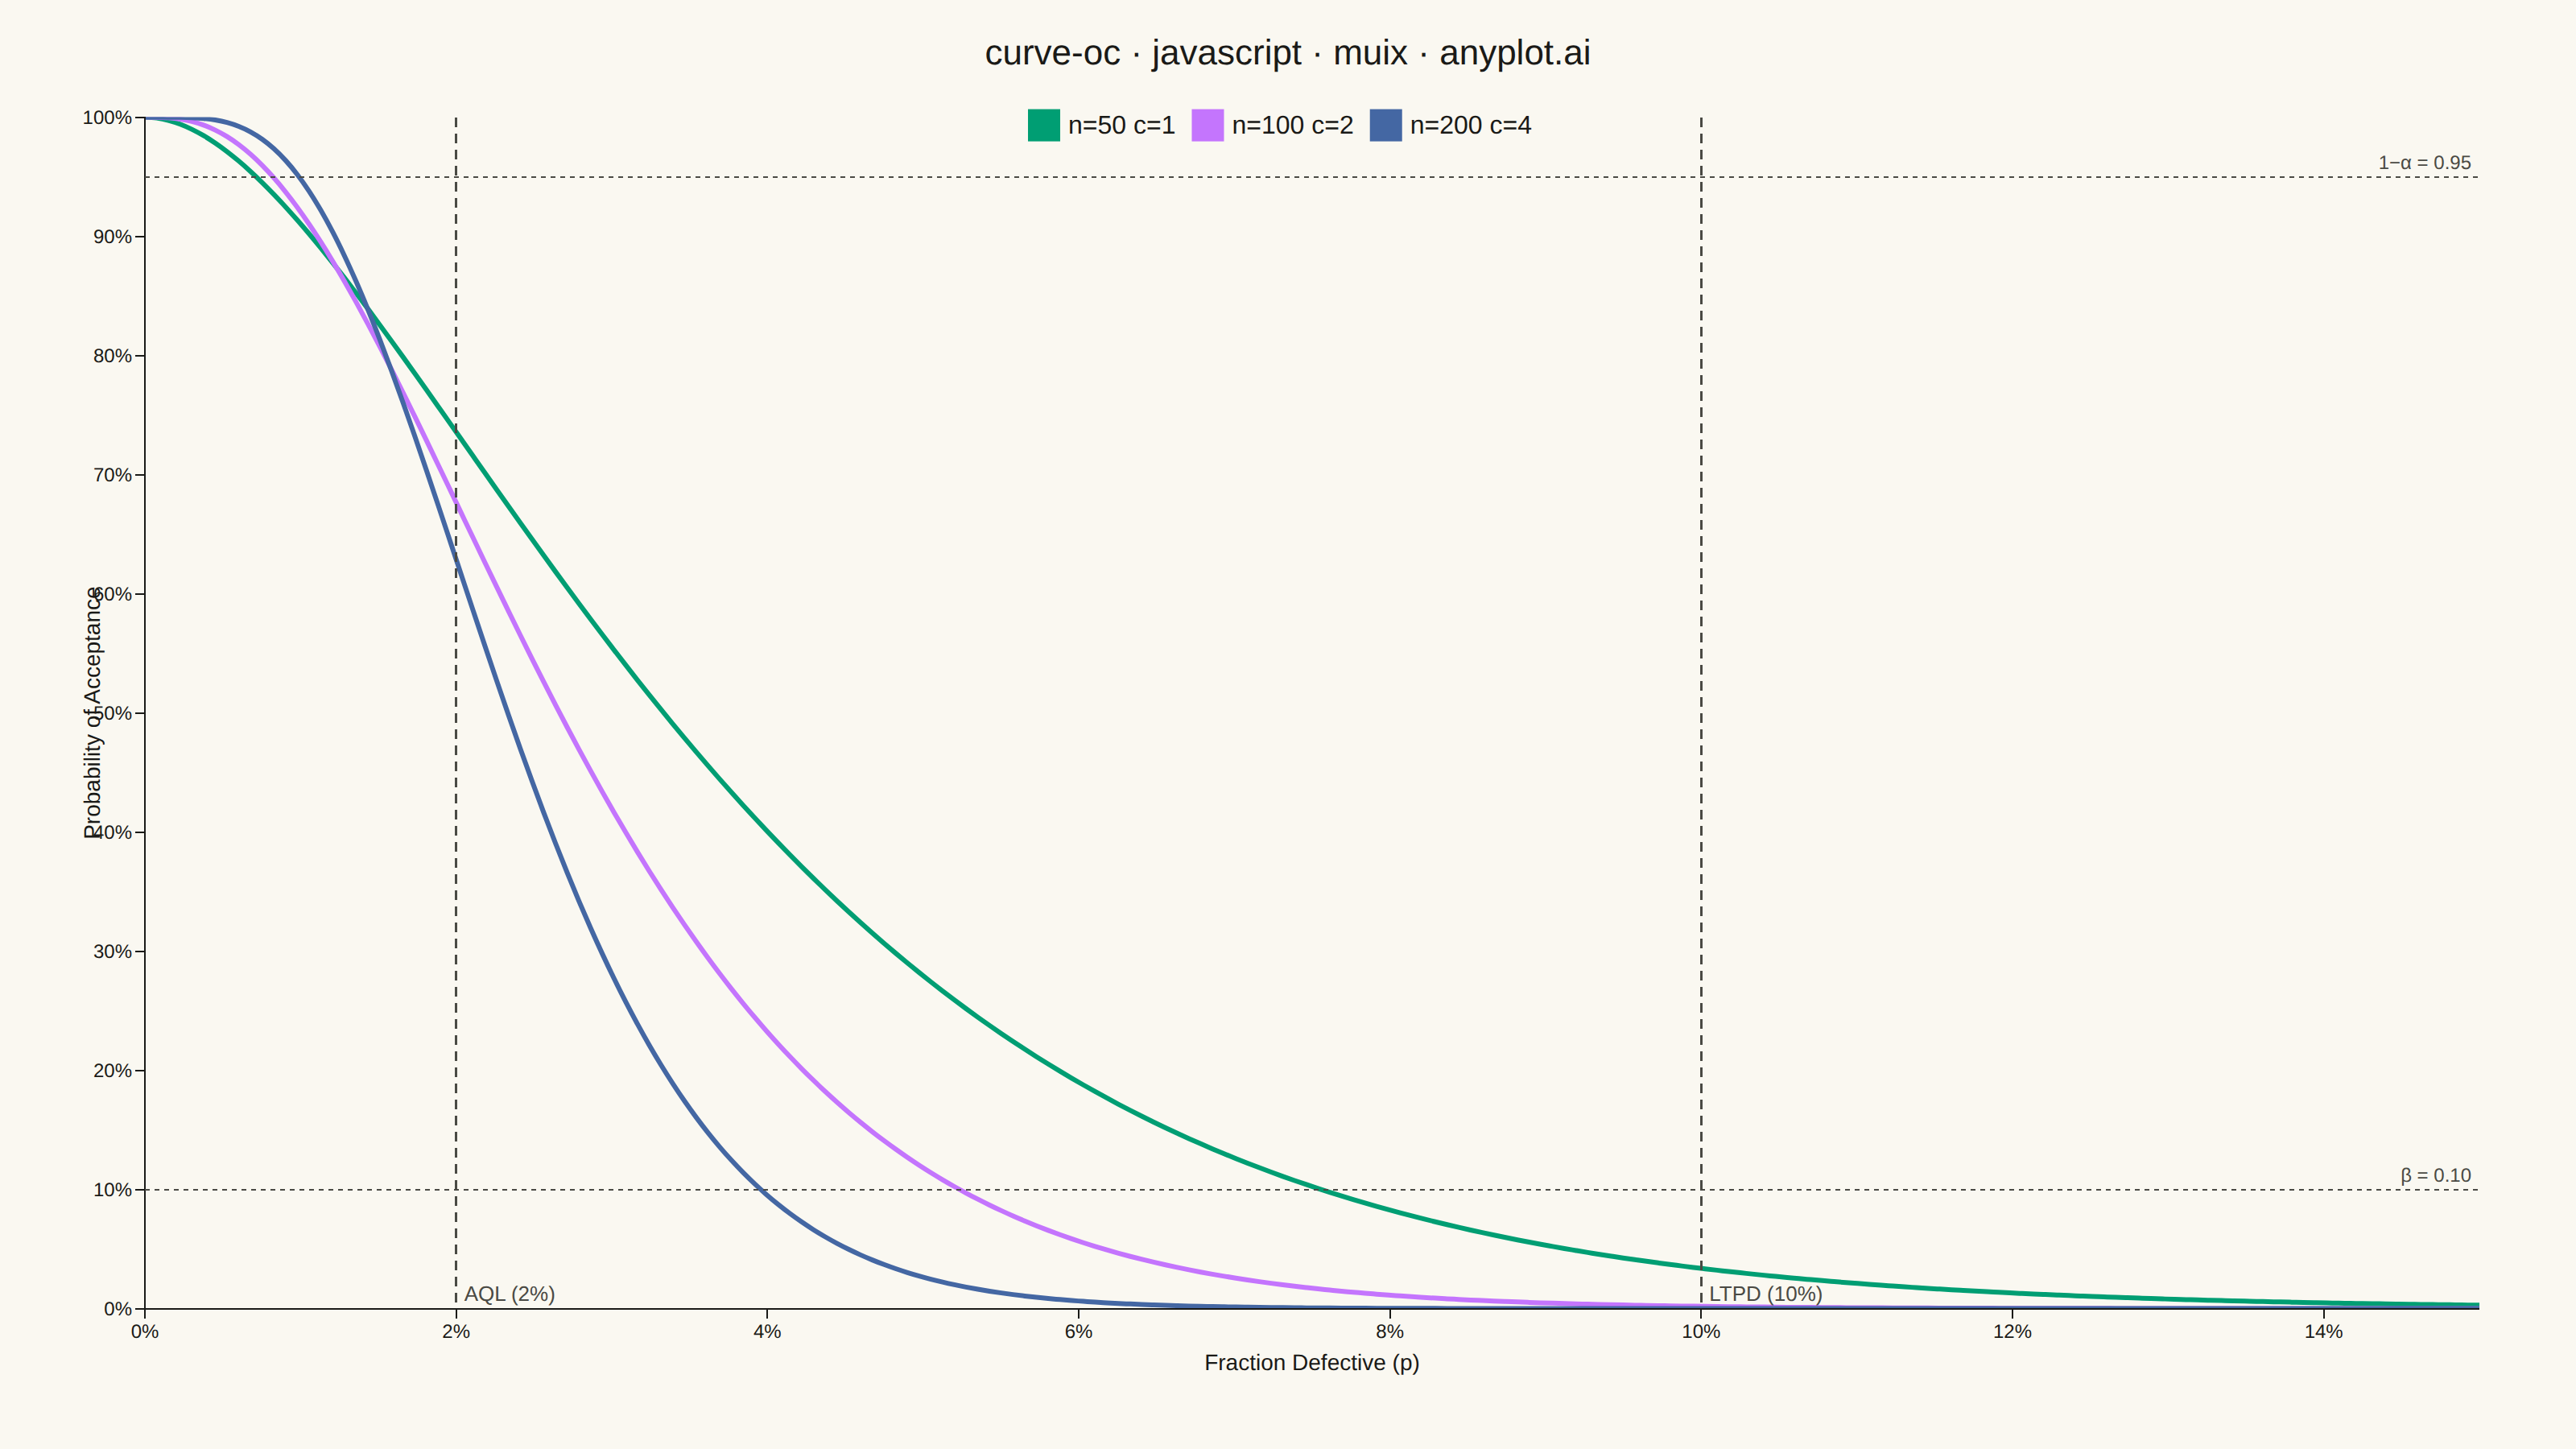
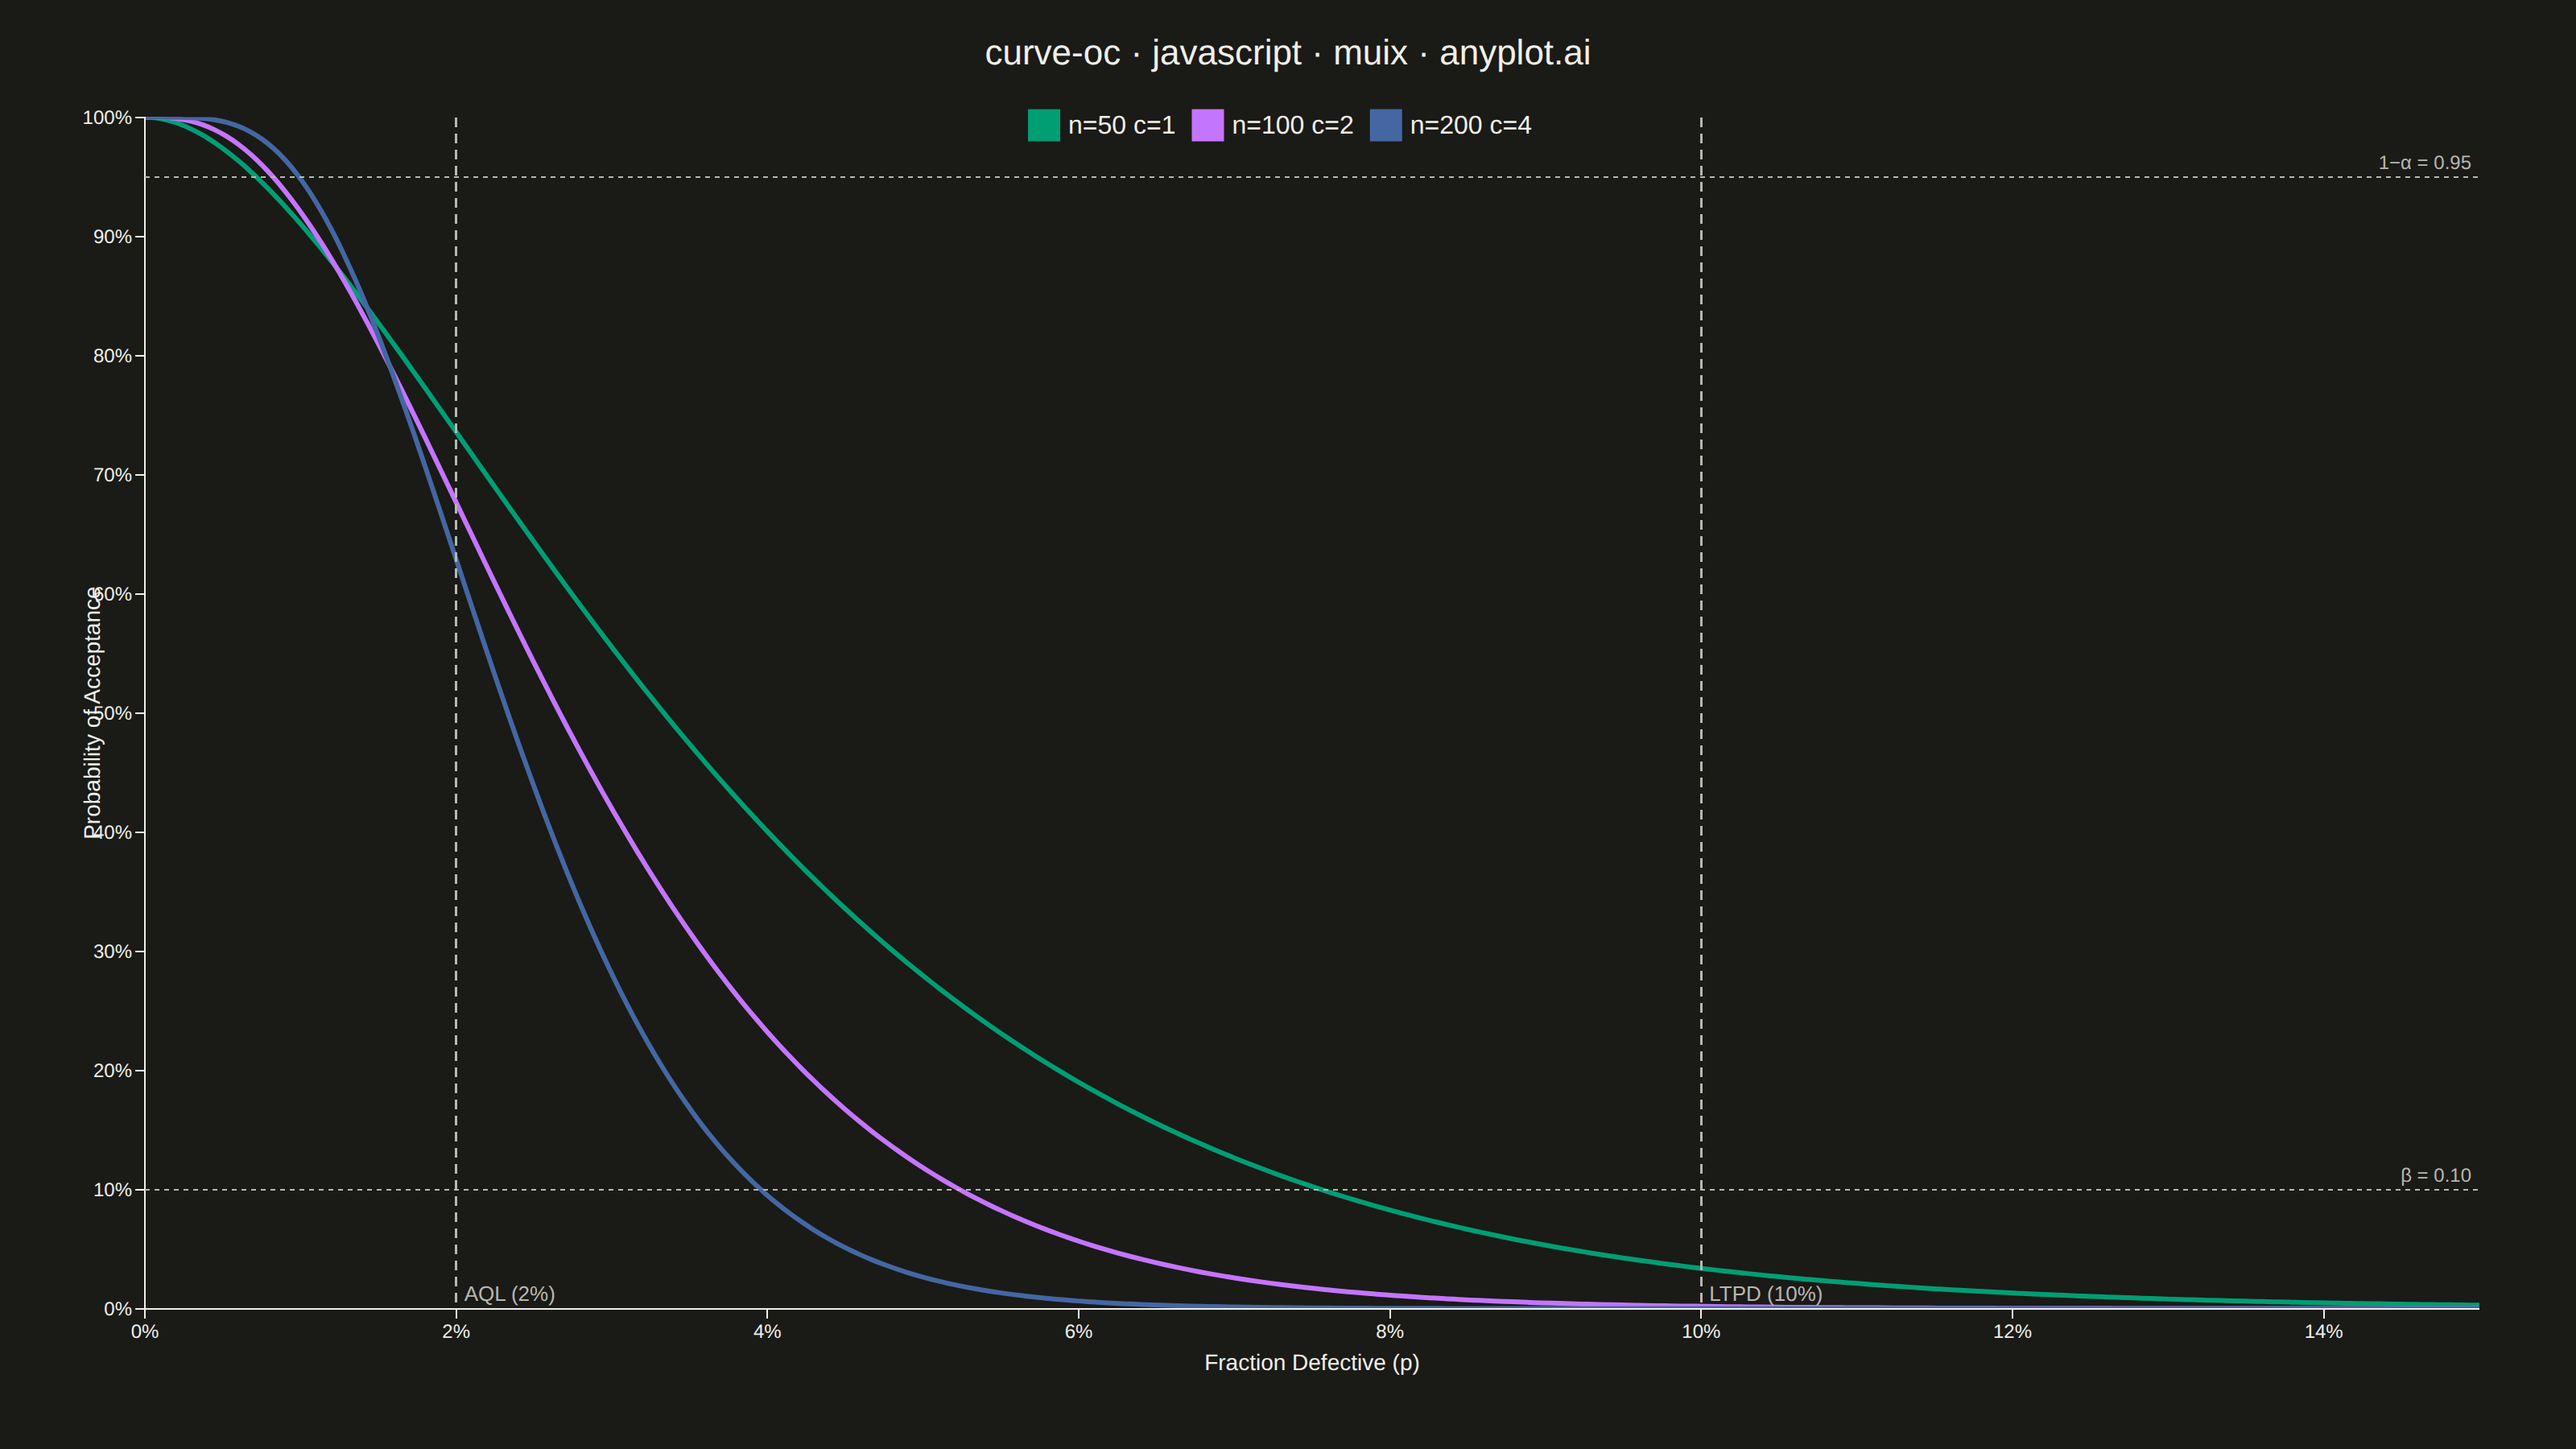
An Operating Characteristic (OC) curve shows the probability of accepting a lot as a function of the true fraction defective in that lot. It is the primary tool for evaluating and comparing acceptance sampling plans, revealing how well an inspection plan discriminates between good and bad lots. The S-shaped curve highlights producer's risk (rejecting good lots) and consumer's risk (accepting bad lots), making it essential for designing effective quality inspection strategies.
// anyplot.ai
// curve-oc: Operating Characteristic (OC) Curve
// Library: muix 7.29.1 | JavaScript 22.22.3
// Quality: 85/100 | Created: 2026-06-20

import { LineChart } from "@mui/x-charts/LineChart";
import { ChartsReferenceLine } from "@mui/x-charts/ChartsReferenceLine";
import Box from "@mui/material/Box";
import Typography from "@mui/material/Typography";

const t = window.ANYPLOT_TOKENS;

// --- Data -------------------------------------------------------------------

// Binomial coefficient (n choose k)
function binomCoeff(n: number, k: number): number {
  if (k < 0 || k > n) return 0;
  if (k === 0 || k === n) return 1;
  let r = 1;
  for (let i = 0; i < k; i++) r = (r * (n - i)) / (i + 1);
  return r;
}

// P(accept | n, c, p) = P(X ≤ c) where X ~ Binomial(n, p)
function pAccept(n: number, c: number, p: number): number {
  let prob = 0;
  for (let k = 0; k <= c; k++) {
    prob += binomCoeff(n, k) * Math.pow(p, k) * Math.pow(1 - p, n - k);
  }
  return Math.min(1, Math.max(0, prob));
}

// x-axis: fraction defective 0–15%, 200 points for a smooth S-curve
const N_POINTS = 200;
const P_MAX = 0.15;
const pValues = Array.from({ length: N_POINTS }, (_, i) => (i * P_MAX) / (N_POINTS - 1));

// Three sampling plans to show discrimination power with increasing n
const plans: [number, number, string][] = [
  [50,  1, "n=50 c=1"],
  [100, 2, "n=100 c=2"],
  [200, 4, "n=200 c=4"],
];

const series = plans.map(([n, c, label]) => ({
  data: pValues.map((p) => pAccept(n, c, p)),
  label,
  showMark: false,
  curve: "catmullRom" as const,
}));

// Quality thresholds
const AQL  = 0.02;  // Acceptable Quality Level — producer's risk reference (α = 5%)
const LTPD = 0.10;  // Lot Tolerance Percent Defective — consumer's risk reference (β = 10%)

const TITLE_HEIGHT = 60;

// --- Chart ------------------------------------------------------------------

export default function Chart() {
  const { width, height } = window.ANYPLOT_SIZE;

  return (
    <Box
      sx={{
        width,
        height,
        display: "flex",
        flexDirection: "column",
        paddingTop: "20px",
      }}
    >
      <Typography
        sx={{
          color: t.ink,
          fontSize: 22,
          fontWeight: 500,
          textAlign: "center",
          lineHeight: 1.2,
        }}
      >
        curve-oc · javascript · muix · anyplot.ai
      </Typography>
      <LineChart
        width={width}
        height={height - TITLE_HEIGHT}
        skipAnimation
        colors={t.palette}
        xAxis={[{
          data: pValues,
          scaleType: "linear",
          valueFormatter: (v: number) => `${(v * 100).toFixed(0)}%`,
          label: "Fraction Defective (p)",
          min: 0,
          max: P_MAX,
          tickInterval: [0, 0.02, 0.04, 0.06, 0.08, 0.10, 0.12, 0.14],
        }]}
        yAxis={[{
          label: "Probability of Acceptance",
          min: 0,
          max: 1,
          valueFormatter: (v: number) => `${(v * 100).toFixed(0)}%`,
        }]}
        series={series}
        margin={{ left: 90, right: 60, top: 20, bottom: 80 }}
        sx={{
          "& .MuiChartsAxis-tickLabel": { fontSize: "14px" },
          "& .MuiChartsAxis-label": { fontSize: "16px" },
          "& .MuiChartsLegend-label": { fontSize: "14px" },
          "& .MuiLineElement-root": { strokeWidth: 3 },
        }}
      >
        <ChartsReferenceLine
          x={AQL}
          label="AQL (2%)"
          labelAlign="end"
          lineStyle={{ stroke: t.inkSoft, strokeDasharray: "6 4", strokeWidth: 1.5 }}
          labelStyle={{ fill: t.inkSoft, fontSize: 13 }}
        />
        <ChartsReferenceLine
          x={LTPD}
          label="LTPD (10%)"
          labelAlign="end"
          lineStyle={{ stroke: t.inkSoft, strokeDasharray: "6 4", strokeWidth: 1.5 }}
          labelStyle={{ fill: t.inkSoft, fontSize: 13 }}
        />
        <ChartsReferenceLine
          y={0.95}
          label="1−α = 0.95"
          labelAlign="end"
          lineStyle={{ stroke: t.inkSoft, strokeDasharray: "3 3", strokeWidth: 1 }}
          labelStyle={{ fill: t.inkSoft, fontSize: 12 }}
        />
        <ChartsReferenceLine
          y={0.10}
          label="β = 0.10"
          labelAlign="end"
          lineStyle={{ stroke: t.inkSoft, strokeDasharray: "3 3", strokeWidth: 1 }}
          labelStyle={{ fill: t.inkSoft, fontSize: 12 }}
        />
      </LineChart>
    </Box>
  );
}
Runnable source as JSON, for any HTTP client: https://api.anyplot.ai/specs/curve-oc/muix/code. Any spec id and library id listed in llms-full.txt fit the same URL shape; every URL below is complete and callable.
{
  "spec_id": "curve-oc",
  "language": "javascript",
  "library": "muix",
  "page": "https://anyplot.ai/curve-oc/javascript/muix",
  "hub": "https://anyplot.ai/curve-oc",
  "code_json": "https://api.anyplot.ai/specs/curve-oc/muix/code",
  "spec_json": "https://api.anyplot.ai/specs/curve-oc",
  "render_light_png": "https://storage.googleapis.com/anyplot-images/plots/curve-oc/javascript/muix/plot-light.png",
  "render_dark_png": "https://storage.googleapis.com/anyplot-images/plots/curve-oc/javascript/muix/plot-dark.png",
  "interactive_light_html": "https://storage.googleapis.com/anyplot-images/plots/curve-oc/javascript/muix/plot-light.html",
  "interactive_dark_html": "https://storage.googleapis.com/anyplot-images/plots/curve-oc/javascript/muix/plot-dark.html",
  "quality_score": 85.0,
  "license": "MIT",
  "guide": "https://anyplot.ai/llms.txt"
}
Part of Operating Characteristic (OC) Curve on anyplot.ai.