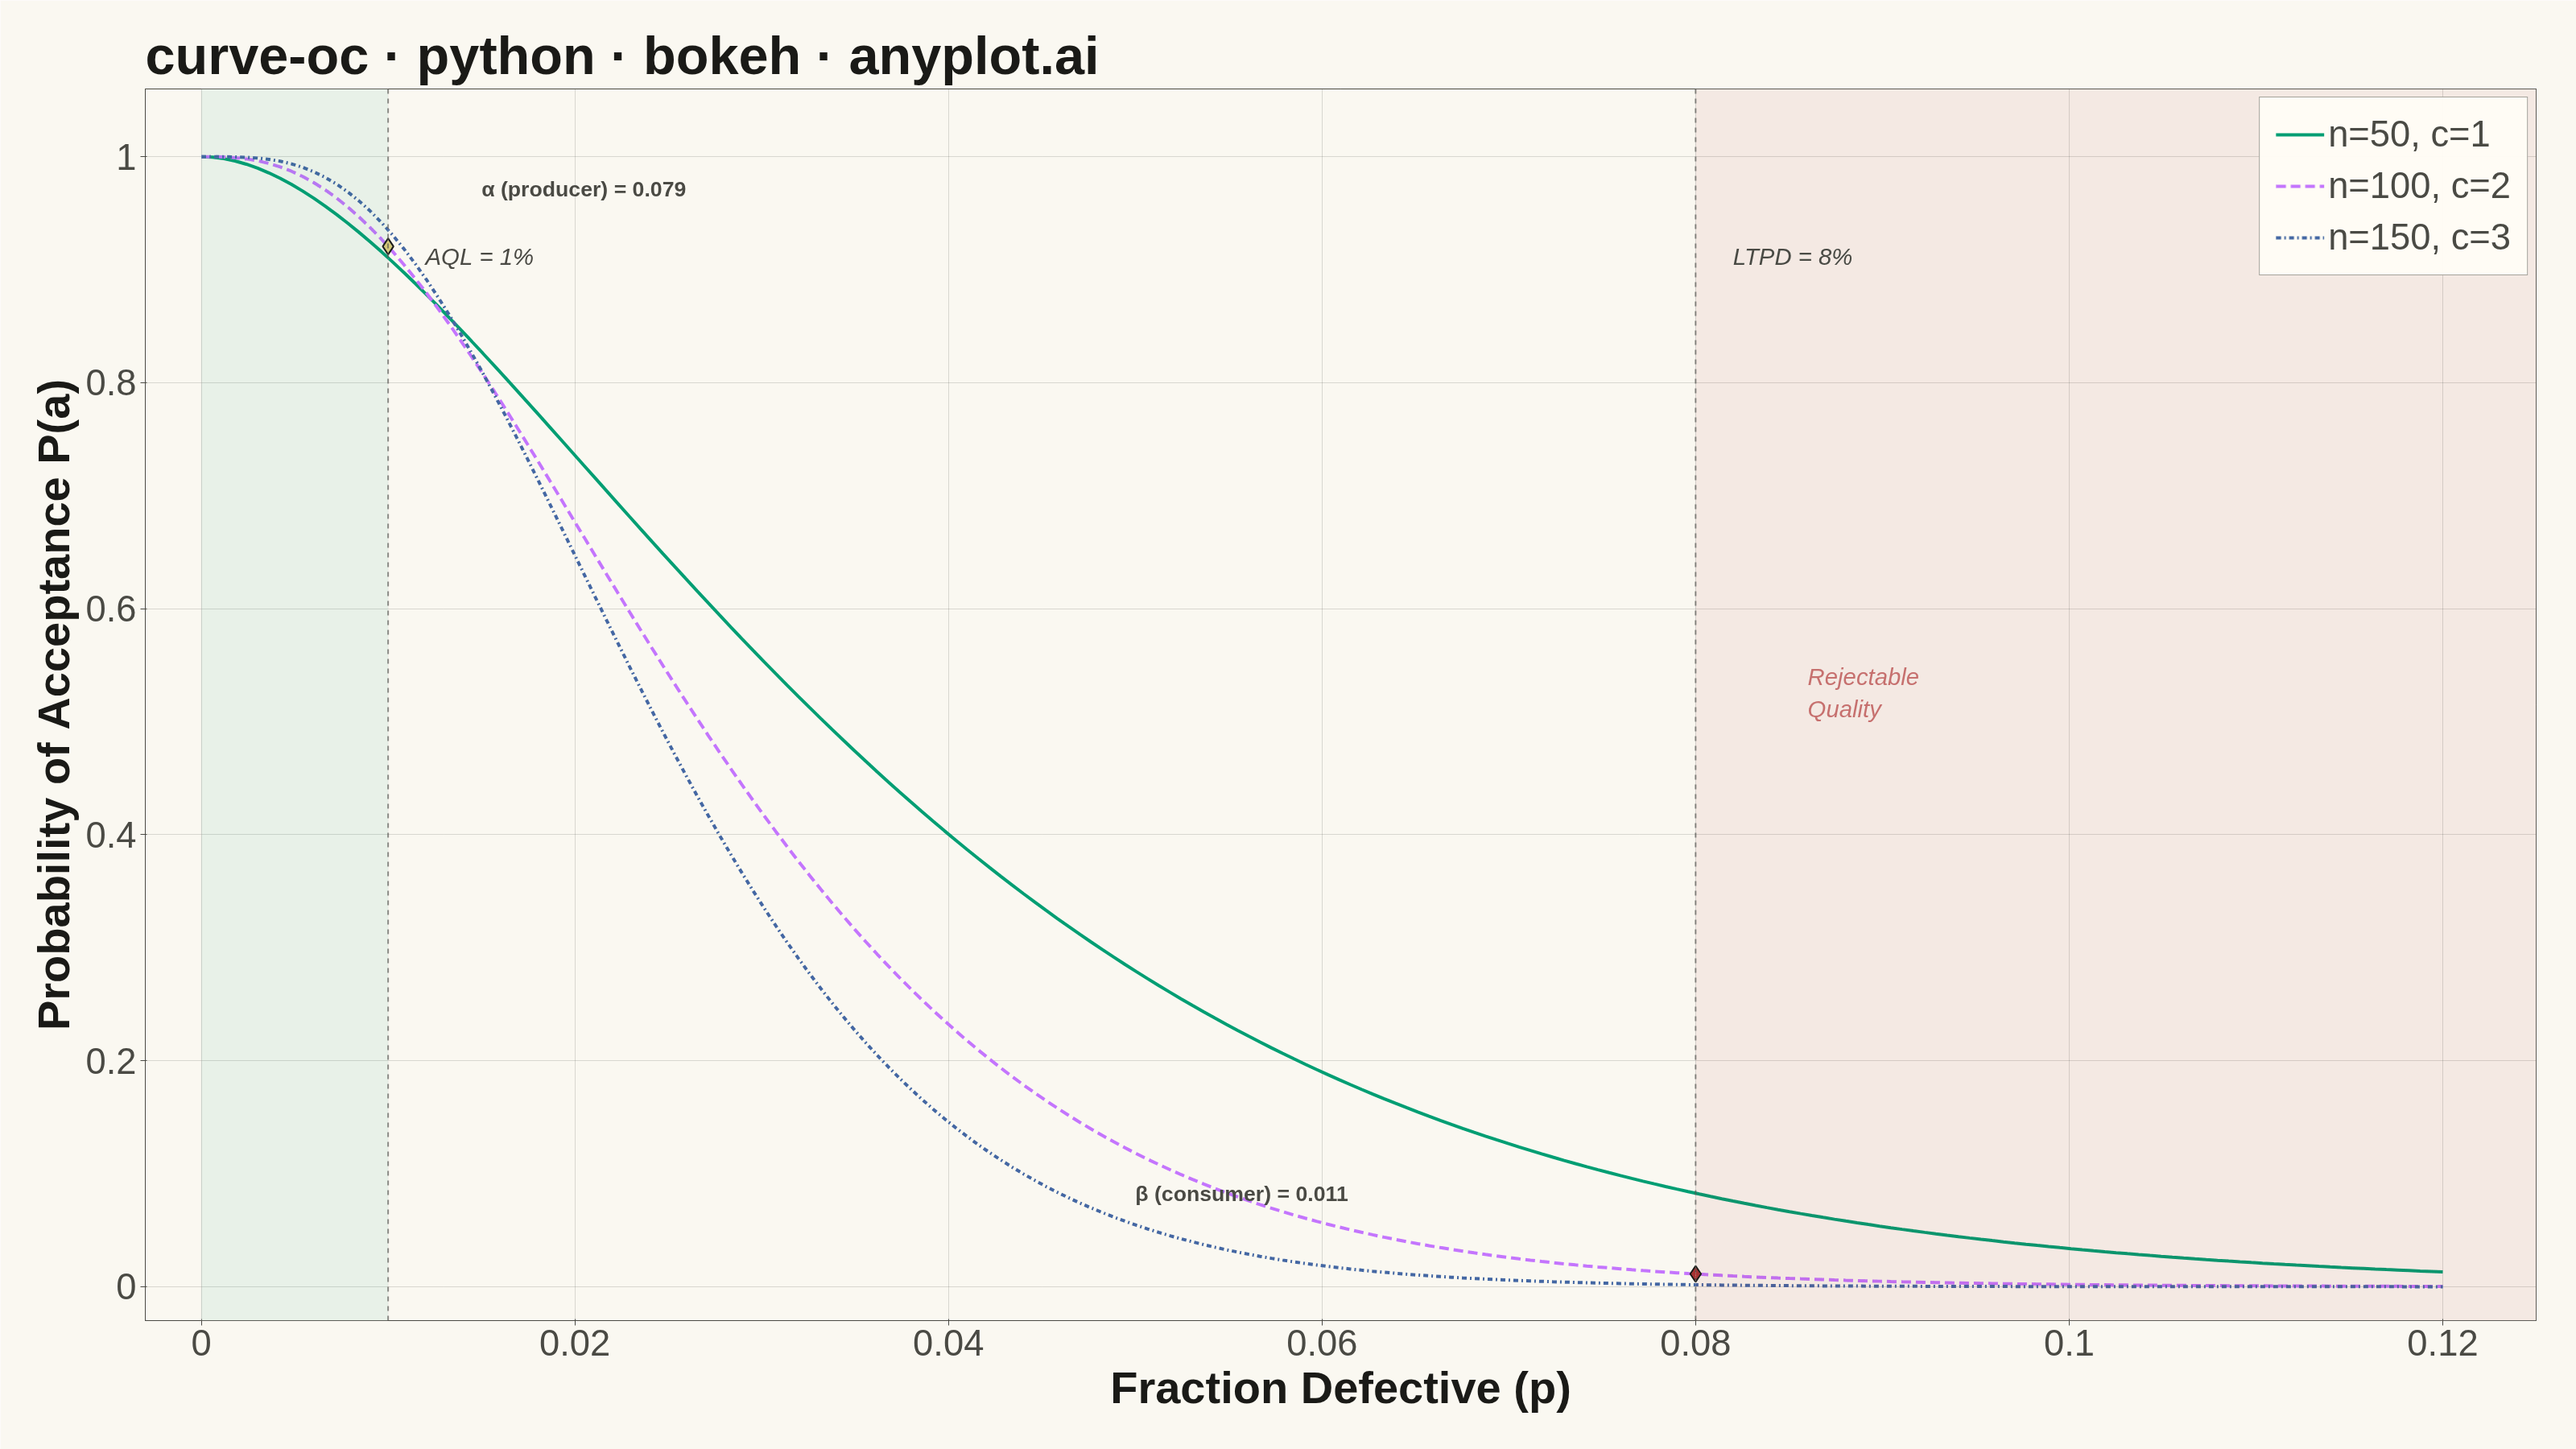
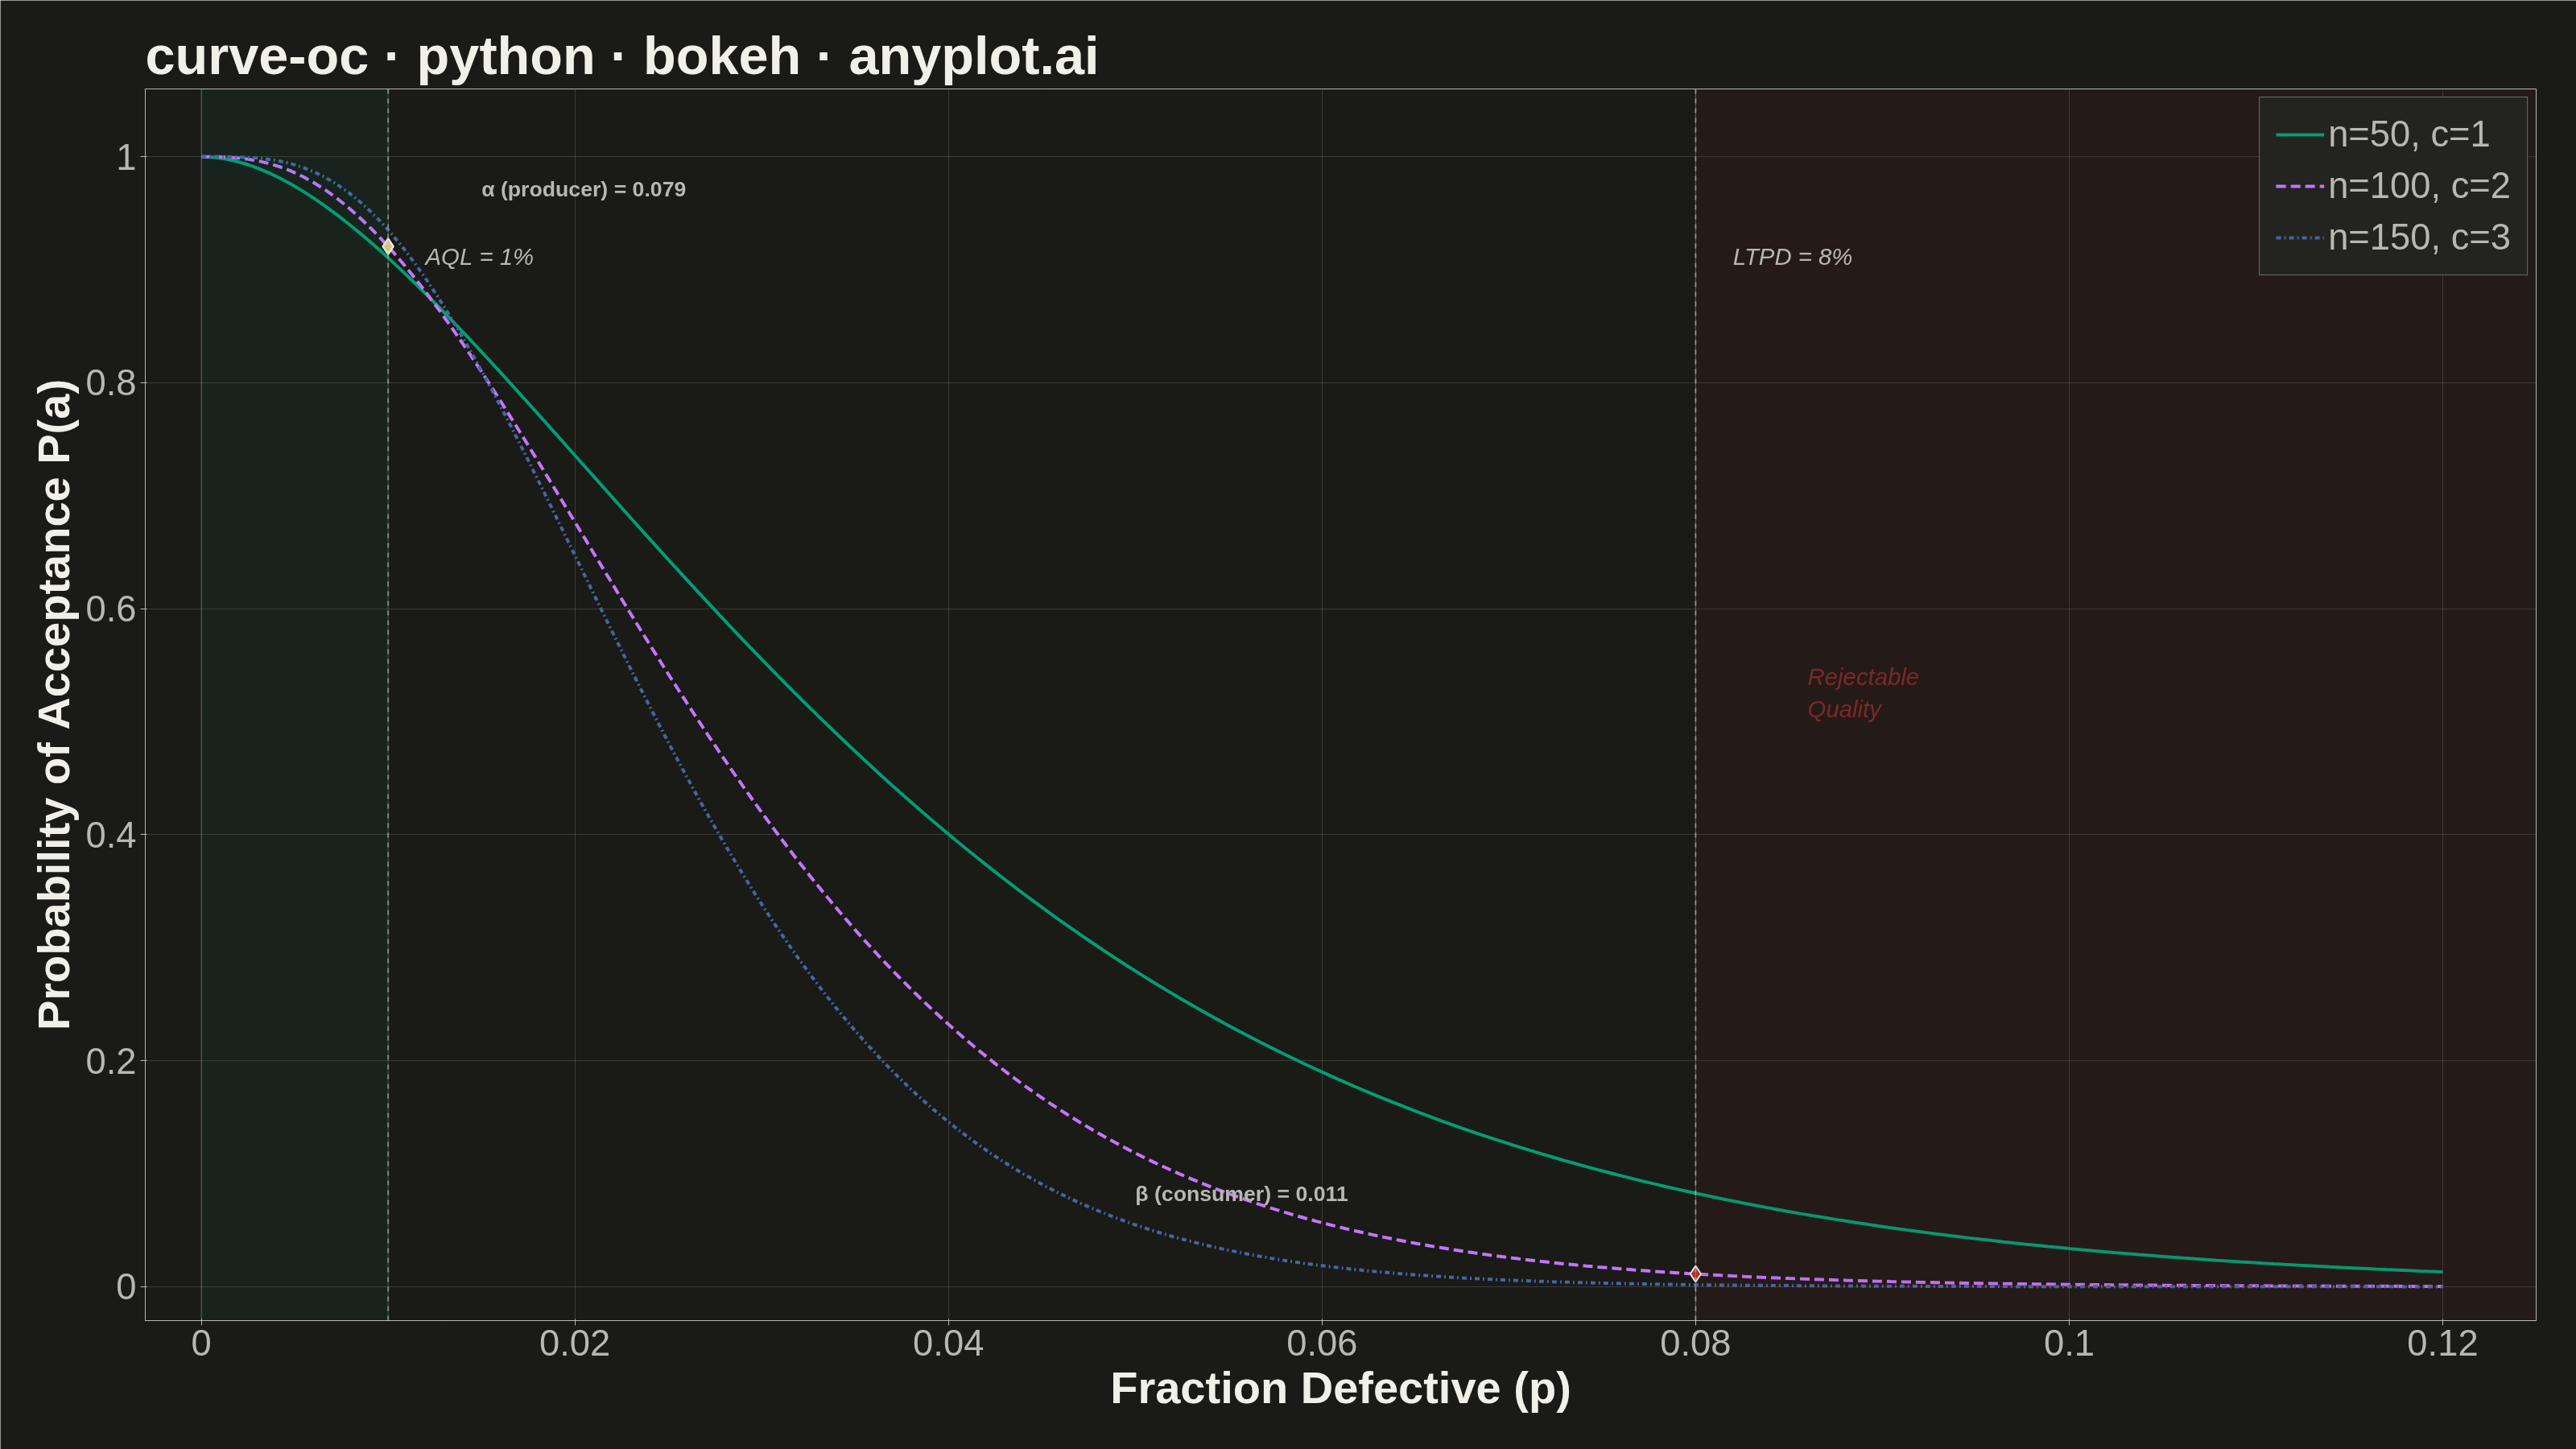
An Operating Characteristic (OC) curve shows the probability of accepting a lot as a function of the true fraction defective in that lot. It is the primary tool for evaluating and comparing acceptance sampling plans, revealing how well an inspection plan discriminates between good and bad lots. The S-shaped curve highlights producer's risk (rejecting good lots) and consumer's risk (accepting bad lots), making it essential for designing effective quality inspection strategies.
""" anyplot.ai
curve-oc: Operating Characteristic (OC) Curve
Library: bokeh 3.9.1 | Python 3.13.14
Quality: 90/100 | Updated: 2026-06-20
"""

import base64
import os
import time
from math import comb
from pathlib import Path

import numpy as np
from bokeh.io import output_file, save
from bokeh.models import BoxAnnotation, ColumnDataSource, Label, Legend, LegendItem, Span
from bokeh.plotting import figure
from selenium import webdriver
from selenium.webdriver.chrome.options import Options


# Theme tokens
THEME = os.getenv("ANYPLOT_THEME", "light")
PAGE_BG = "#FAF8F1" if THEME == "light" else "#1A1A17"
ELEVATED_BG = "#FFFDF6" if THEME == "light" else "#242420"
INK = "#1A1A17" if THEME == "light" else "#F0EFE8"
INK_SOFT = "#4A4A44" if THEME == "light" else "#B8B7B0"
INK_MUTED = "#6B6A63" if THEME == "light" else "#A8A79F"

# Imprint palette — canonical order, theme-independent
IMPRINT_PALETTE = ["#009E73", "#C475FD", "#4467A3", "#BD8233", "#AE3030", "#2ABCCD", "#954477", "#99B314"]
ANYPLOT_AMBER = "#DDCC77"  # warning / caution anchor (outside categorical pool)

# Data — binomial CDF: P(accept) = sum C(n,k)*p^k*(1-p)^(n-k), k=0..c
fraction_defective = np.linspace(0, 0.12, 200)

plans = [(50, 1), (100, 2), (150, 3)]
oc_curves = []
for n, c in plans:
    pa = np.ones(len(fraction_defective))
    for i, p_val in enumerate(fraction_defective):
        if p_val > 0:
            pa[i] = sum(comb(n, k) * p_val**k * (1 - p_val) ** (n - k) for k in range(c + 1))
    oc_curves.append(pa)

# AQL and LTPD reference points
aql = 0.01
ltpd = 0.08

# Risk values at AQL and LTPD for plan 2 (n=100, c=2)
n2, c2 = plans[1]
pa_at_aql = sum(comb(n2, k) * aql**k * (1 - aql) ** (n2 - k) for k in range(c2 + 1))
alpha = 1 - pa_at_aql
pa_at_ltpd = sum(comb(n2, k) * ltpd**k * (1 - ltpd) ** (n2 - k) for k in range(c2 + 1))

# Title font scaling — shrink only when title exceeds 67-char baseline
title_str = "curve-oc · python · bokeh · anyplot.ai"
n_chars = len(title_str)
title_pt = round(50 * 67 / n_chars) if n_chars > 67 else 50
title_fontsize = f"{title_pt}pt"

# Figure — 3200×1800 landscape canvas (hard contract, no deviation)
p = figure(
    width=3200,
    height=1800,
    title=title_str,
    x_axis_label="Fraction Defective (p)",
    y_axis_label="Probability of Acceptance P(a)",
    x_range=(-0.003, 0.125),
    y_range=(-0.03, 1.06),
    toolbar_location=None,  # REQUIRED: default toolbar adds ~30-50px, shrinking the PNG
    min_border_bottom=160,  # room for 34pt tick labels + 42pt axis label
    min_border_left=180,
    min_border_top=110,  # room for 50pt title
    min_border_right=50,
)

# Shaded risk regions
producer_risk_zone = BoxAnnotation(left=0, right=aql, fill_color=IMPRINT_PALETTE[0], fill_alpha=0.07)
p.add_layout(producer_risk_zone)

consumer_risk_zone = BoxAnnotation(left=ltpd, right=0.125, fill_color=IMPRINT_PALETTE[4], fill_alpha=0.07)
p.add_layout(consumer_risk_zone)

# Zone label — increased alpha for visibility (was 0.35, now 0.65)
zone_reject = Label(
    x=0.086,
    y=0.50,
    text="Rejectable\nQuality",
    text_font_size="22pt",
    text_color=IMPRINT_PALETTE[4],
    text_alpha=0.65,
    text_font_style="italic",
)
p.add_layout(zone_reject)

# OC curves with distinct line dashes for redundant encoding (3 series)
line_dashes = ["solid", [12, 6], [6, 4, 2, 4]]
lines = []
for i, pa in enumerate(oc_curves):
    source = ColumnDataSource(data={"p": fraction_defective, "pa": pa})
    line = p.line("p", "pa", source=source, line_width=4, line_color=IMPRINT_PALETTE[i], line_dash=line_dashes[i])
    lines.append(line)

# AQL vertical reference line
aql_line = Span(location=aql, dimension="height", line_color=INK_SOFT, line_width=2, line_dash="dashed", line_alpha=0.6)
p.add_layout(aql_line)

aql_label = Label(
    x=aql + 0.002, y=0.90, text="AQL = 1%", text_font_size="22pt", text_color=INK_SOFT, text_font_style="italic"
)
p.add_layout(aql_label)

# LTPD vertical reference line
ltpd_line = Span(
    location=ltpd, dimension="height", line_color=INK_SOFT, line_width=2, line_dash="dashed", line_alpha=0.6
)
p.add_layout(ltpd_line)

ltpd_label = Label(
    x=ltpd + 0.002, y=0.90, text="LTPD = 8%", text_font_size="22pt", text_color=INK_SOFT, text_font_style="italic"
)
p.add_layout(ltpd_label)

# Producer's risk (alpha) marker — repositioned above the curve cluster to avoid congestion
risk_source_alpha = ColumnDataSource(data={"x": [aql], "y": [pa_at_aql]})
p.scatter(
    "x", "y", source=risk_source_alpha, size=20, color=ANYPLOT_AMBER, line_color=INK, line_width=2, marker="diamond"
)

alpha_label = Label(
    x=aql + 0.005,
    y=pa_at_aql + 0.04,
    text=f"α (producer) = {alpha:.3f}",
    text_font_size="20pt",
    text_color=INK_SOFT,
    text_font_style="bold",
)
p.add_layout(alpha_label)

# Consumer's risk (beta) marker
risk_source_beta = ColumnDataSource(data={"x": [ltpd], "y": [pa_at_ltpd]})
p.scatter(
    "x", "y", source=risk_source_beta, size=20, color=IMPRINT_PALETTE[4], line_color=INK, line_width=2, marker="diamond"
)

beta_label = Label(
    x=ltpd - 0.030,
    y=pa_at_ltpd + 0.06,
    text=f"β (consumer) = {pa_at_ltpd:.3f}",
    text_font_size="20pt",
    text_color=INK_SOFT,
    text_font_style="bold",
)
p.add_layout(beta_label)

# Legend
plan_labels = ["n=50, c=1", "n=100, c=2", "n=150, c=3"]
legend = Legend(
    items=[LegendItem(label=lbl, renderers=[ln]) for lbl, ln in zip(plan_labels, lines, strict=True)],
    location="top_right",
)
legend.label_text_font_size = "34pt"
legend.background_fill_color = ELEVATED_BG
legend.border_line_color = INK_SOFT
legend.border_line_width = 1
legend.spacing = 12
legend.padding = 20
legend.glyph_width = 60
legend.glyph_height = 34
legend.label_text_color = INK_SOFT
p.add_layout(legend)

# Style — theme-adaptive chrome
p.title.text_font_size = title_fontsize
p.title.text_font_style = "bold"
p.title.text_color = INK

p.xaxis.axis_label_text_font_size = "42pt"
p.yaxis.axis_label_text_font_size = "42pt"
p.xaxis.axis_label_text_color = INK
p.yaxis.axis_label_text_color = INK
p.xaxis.axis_label_text_font_style = "bold"
p.yaxis.axis_label_text_font_style = "bold"

p.xaxis.major_label_text_font_size = "34pt"
p.yaxis.major_label_text_font_size = "34pt"
p.xaxis.major_label_text_color = INK_SOFT
p.yaxis.major_label_text_color = INK_SOFT

p.xgrid.grid_line_alpha = 0.15
p.ygrid.grid_line_alpha = 0.15
p.xgrid.grid_line_color = INK
p.ygrid.grid_line_color = INK

p.background_fill_color = PAGE_BG
p.border_fill_color = PAGE_BG
p.outline_line_color = INK_SOFT

p.xaxis.axis_line_color = INK_SOFT
p.yaxis.axis_line_color = INK_SOFT
p.xaxis.major_tick_line_color = INK_SOFT
p.yaxis.major_tick_line_color = INK_SOFT
p.xaxis.minor_tick_line_color = None
p.yaxis.minor_tick_line_color = None

# Save — write HTML then screenshot with headless Chrome (export_png unavailable in CI)
output_file(f"plot-{THEME}.html", title="Operating Characteristic (OC) Curve")
save(p)

W, H = 3200, 1800
opts = Options()
for arg in (
    "--headless=new",
    "--no-sandbox",
    "--disable-dev-shm-usage",
    "--disable-gpu",
    f"--window-size={W},{H}",
    "--hide-scrollbars",
):
    opts.add_argument(arg)
driver = webdriver.Chrome(options=opts)
driver.set_window_size(W, H)
driver.get(f"file://{Path(f'plot-{THEME}.html').resolve()}")
time.sleep(3)
# Use CDP captureScreenshot with explicit clip to guarantee exact W×H output
# (driver.save_screenshot captures viewport which can be cropped by browser chrome)
result = driver.execute_cdp_cmd(
    "Page.captureScreenshot",
    {"format": "png", "clip": {"x": 0, "y": 0, "width": W, "height": H, "scale": 1}, "captureBeyondViewport": True},
)
with open(f"plot-{THEME}.png", "wb") as _f:
    _f.write(base64.b64decode(result["data"]))
driver.quit()
Runnable source as JSON, for any HTTP client: https://api.anyplot.ai/specs/curve-oc/bokeh/code. Any spec id and library id listed in llms-full.txt fit the same URL shape; every URL below is complete and callable.
{
  "spec_id": "curve-oc",
  "language": "python",
  "library": "bokeh",
  "page": "https://anyplot.ai/curve-oc/python/bokeh",
  "hub": "https://anyplot.ai/curve-oc",
  "code_json": "https://api.anyplot.ai/specs/curve-oc/bokeh/code",
  "spec_json": "https://api.anyplot.ai/specs/curve-oc",
  "render_light_png": "https://storage.googleapis.com/anyplot-images/plots/curve-oc/python/bokeh/plot-light.png",
  "render_dark_png": "https://storage.googleapis.com/anyplot-images/plots/curve-oc/python/bokeh/plot-dark.png",
  "interactive_light_html": "https://storage.googleapis.com/anyplot-images/plots/curve-oc/python/bokeh/plot-light.html",
  "interactive_dark_html": "https://storage.googleapis.com/anyplot-images/plots/curve-oc/python/bokeh/plot-dark.html",
  "quality_score": 90.0,
  "license": "MIT",
  "guide": "https://anyplot.ai/llms.txt"
}
Part of Operating Characteristic (OC) Curve on anyplot.ai.