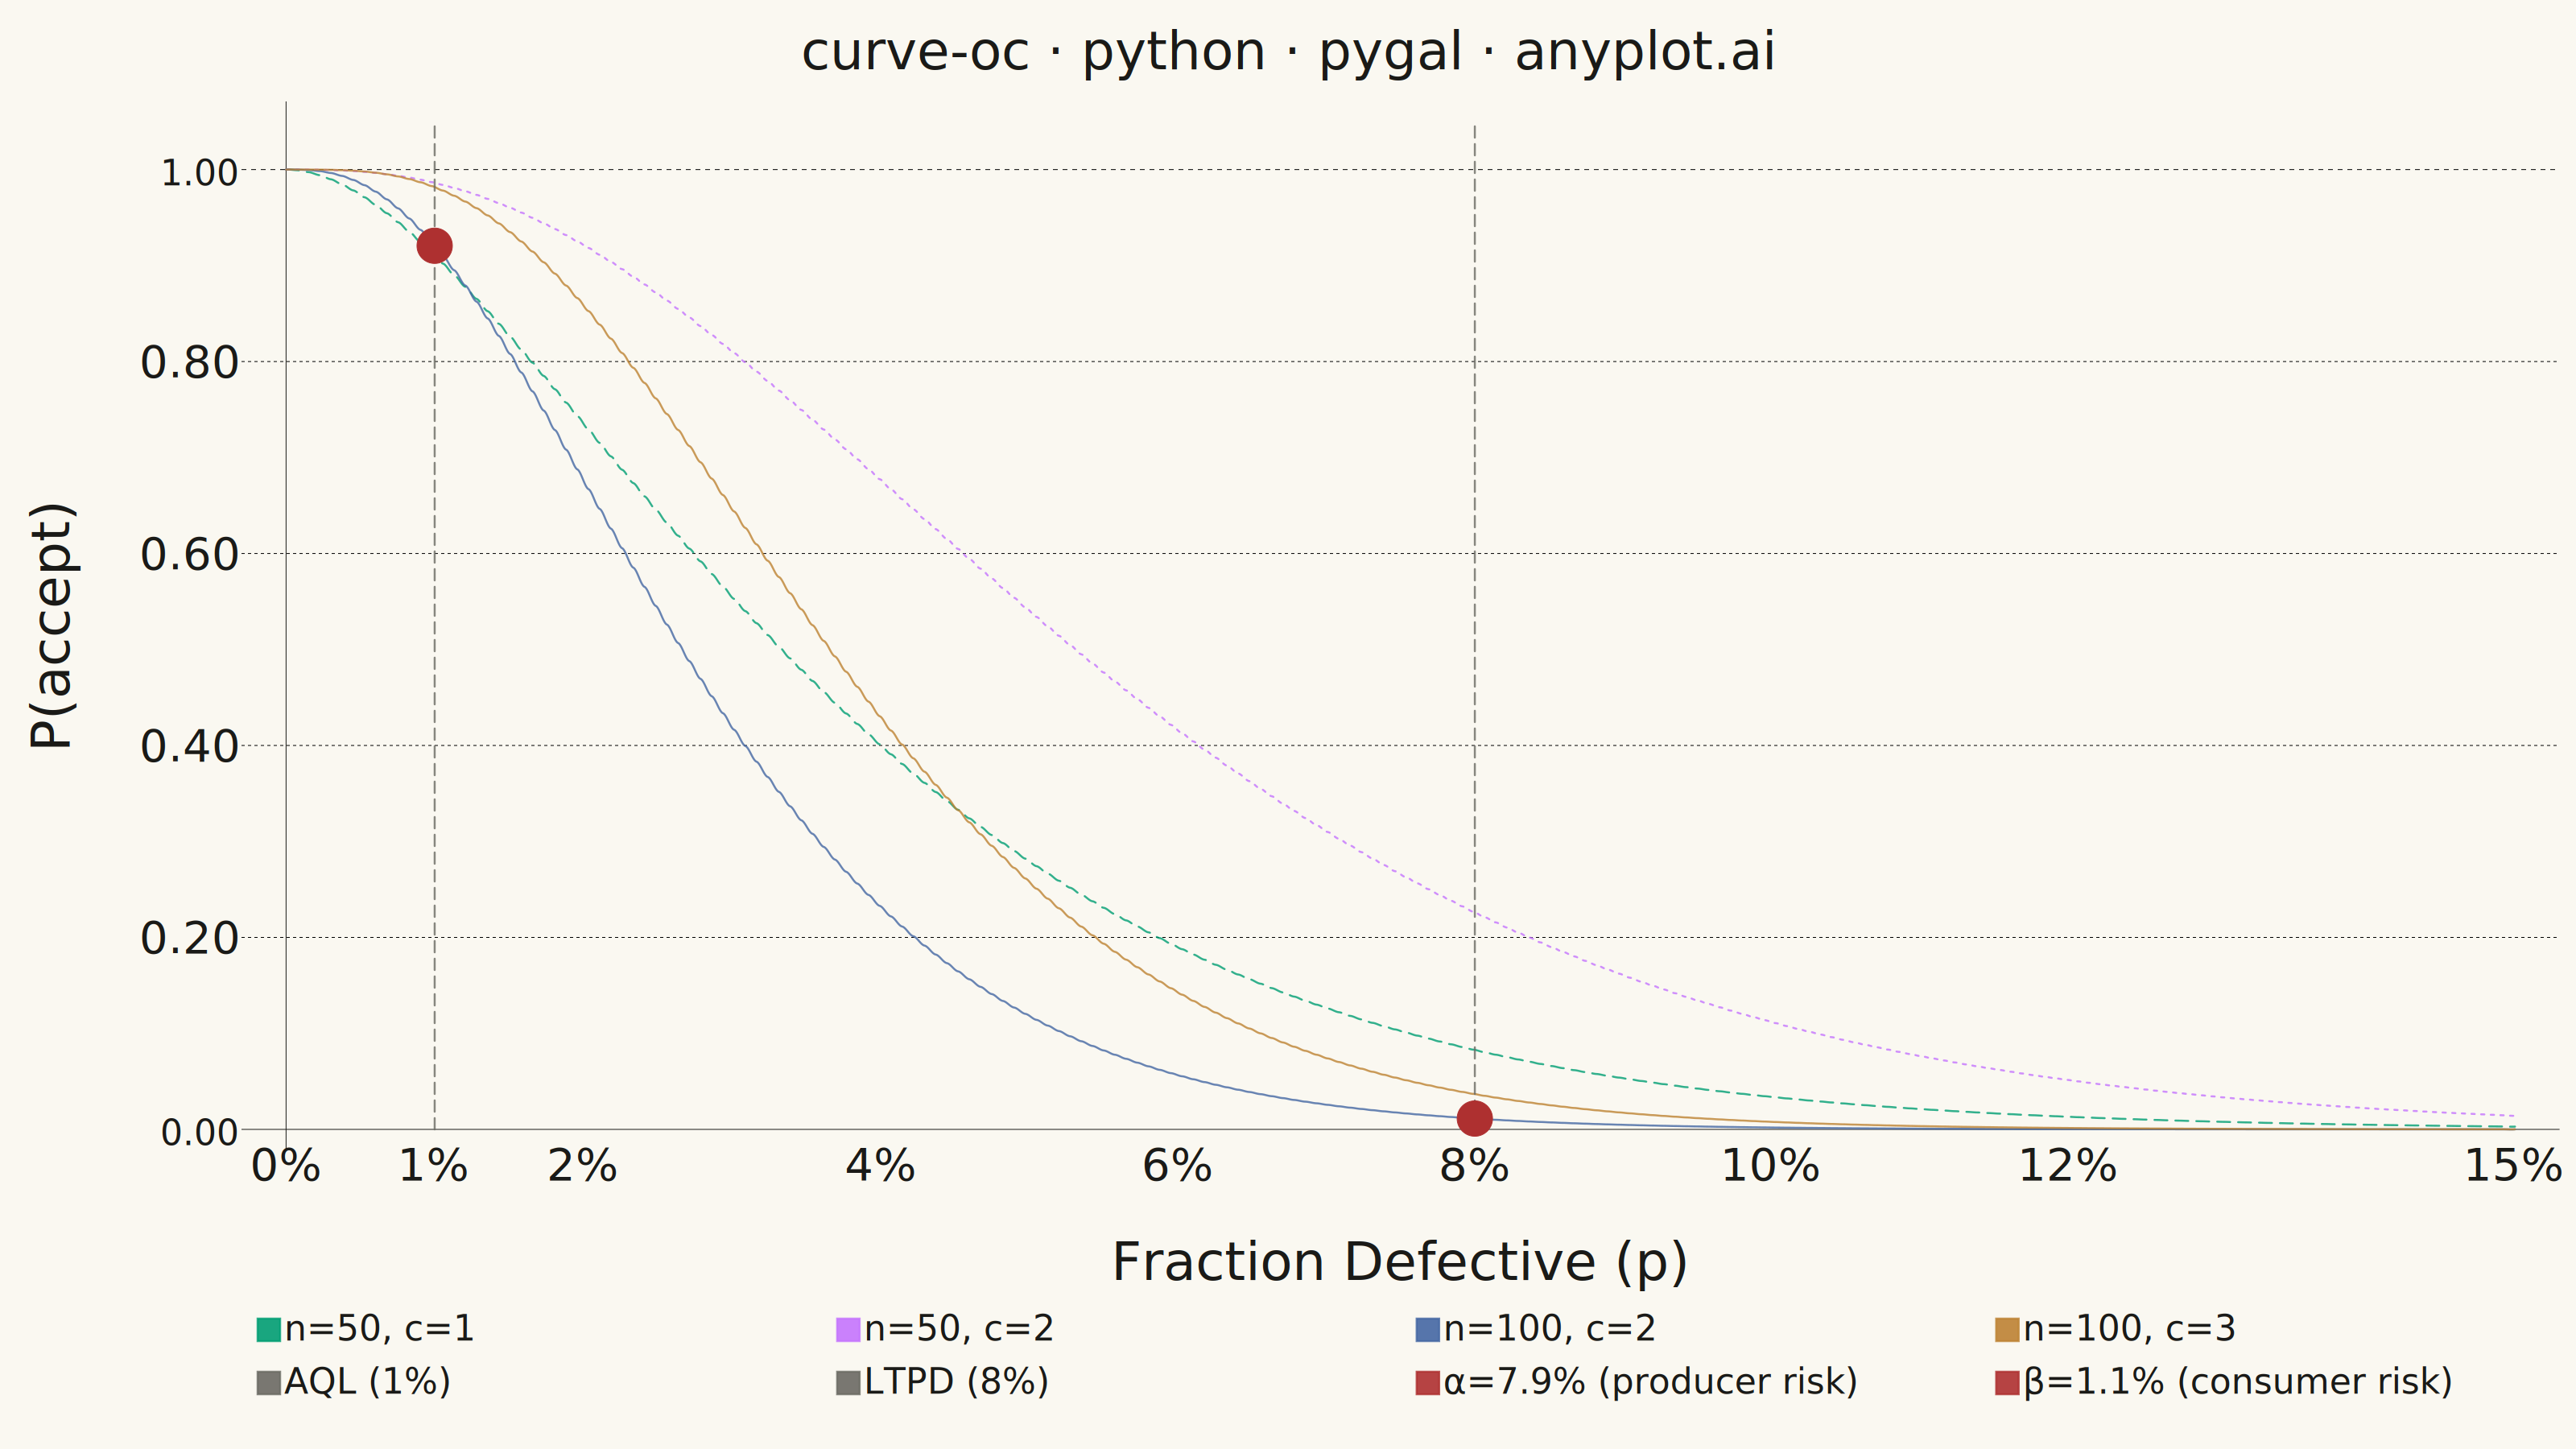
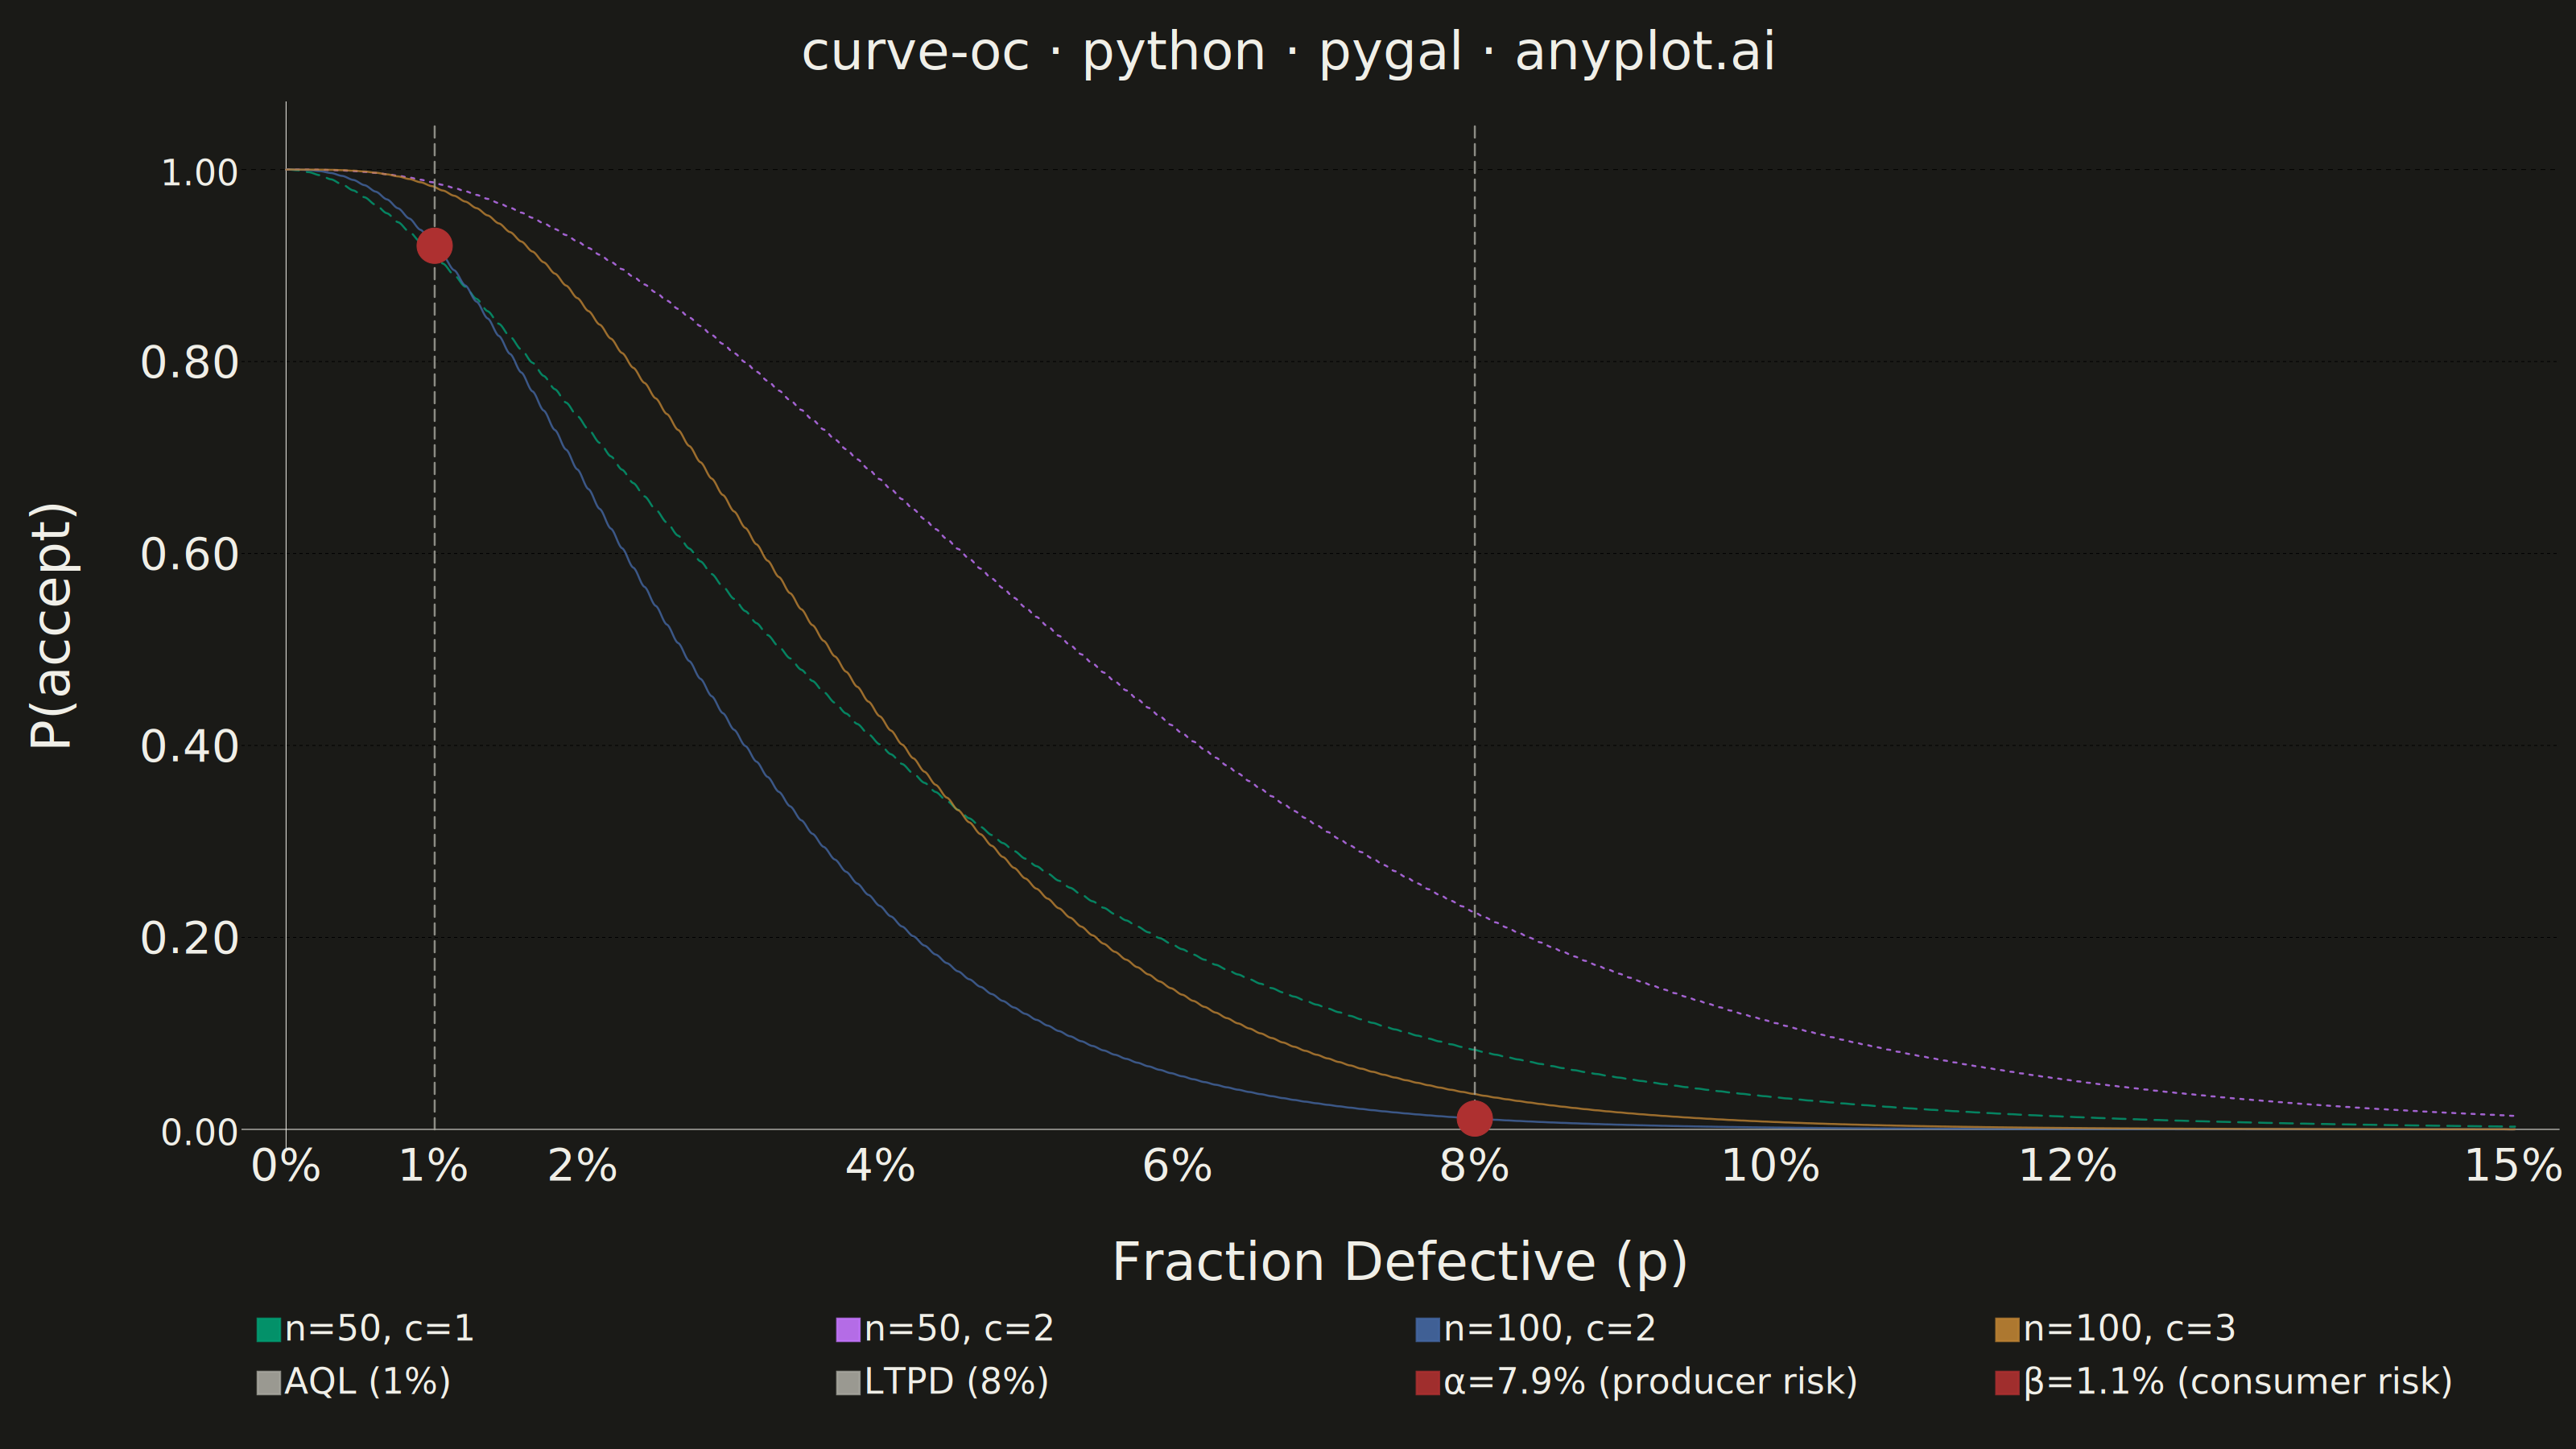
An Operating Characteristic (OC) curve shows the probability of accepting a lot as a function of the true fraction defective in that lot. It is the primary tool for evaluating and comparing acceptance sampling plans, revealing how well an inspection plan discriminates between good and bad lots. The S-shaped curve highlights producer's risk (rejecting good lots) and consumer's risk (accepting bad lots), making it essential for designing effective quality inspection strategies.
""" anyplot.ai
curve-oc: Operating Characteristic (OC) Curve
Library: pygal 3.1.3 | Python 3.13.14
Quality: 88/100 | Updated: 2026-06-20
"""

import os
import sys


# This file is named pygal.py — remove its own directory from sys.path so that
# `import pygal` resolves to the installed package, not this script itself.
_thisdir = os.path.dirname(os.path.abspath(__file__))
if _thisdir in sys.path:
    sys.path.remove(_thisdir)

from math import comb

import cairosvg
import numpy as np
import pygal
from pygal.style import Style


THEME = os.getenv("ANYPLOT_THEME", "light")

# Theme-adaptive chrome tokens
PAGE_BG = "#FAF8F1" if THEME == "light" else "#1A1A17"
INK = "#1A1A17" if THEME == "light" else "#F0EFE8"
INK_MUTED = "#6B6A63" if THEME == "light" else "#A8A79F"

# Imprint categorical palette — first series always #009E73
IMPRINT_PALETTE = (
    "#009E73",  # green  — n=50, c=1
    "#C475FD",  # lavender — n=50, c=2
    "#4467A3",  # blue   — n=100, c=2 (reference plan)
    "#BD8233",  # ochre  — n=100, c=3
    INK_MUTED,  # muted neutral — AQL reference line
    INK_MUTED,  # muted neutral — LTPD reference line
    "#AE3030",  # matte red — producer's risk (alpha)
    "#AE3030",  # matte red — consumer's risk (beta)
)

# Data — tighter x-range for practical readability
fraction_defective = np.linspace(0, 0.15, 200)

# Sampling plans: (sample_size, acceptance_number, label)
plans = [(50, 1, "n=50, c=1"), (50, 2, "n=50, c=2"), (100, 2, "n=100, c=2"), (100, 3, "n=100, c=3")]

# Compute OC curves — P(accept) = sum C(n,k) * p^k * (1-p)^(n-k) for k=0..c
oc_curves = {}
for n, c, label in plans:
    p = fraction_defective
    oc_curves[label] = sum(comb(n, k) * p**k * (1 - p) ** (n - k) for k in range(c + 1))

# Quality levels
aql = 0.01  # Acceptable Quality Level (1%)
ltpd = 0.08  # Lot Tolerance Percent Defective (8%)

# Risks for reference plan n=100, c=2
pa_at_aql = float(sum(comb(100, k) * aql**k * (1 - aql) ** (100 - k) for k in range(3)))
alpha = 1 - pa_at_aql
beta = float(sum(comb(100, k) * ltpd**k * (1 - ltpd) ** (100 - k) for k in range(3)))

custom_style = Style(
    background=PAGE_BG,
    plot_background=PAGE_BG,
    foreground=INK,
    foreground_strong=INK,
    foreground_subtle=INK_MUTED,
    colors=IMPRINT_PALETTE,
    title_font_size=66,
    label_font_size=56,
    major_label_font_size=44,
    legend_font_size=44,
    value_font_size=36,
    stroke_width=2.5,
    font_family="sans-serif",
    tooltip_font_size=36,
    opacity=0.9,
    opacity_hover=1.0,
)

chart = pygal.XY(
    width=3200,
    height=1800,
    style=custom_style,
    title="curve-oc · python · pygal · anyplot.ai",
    x_title="Fraction Defective (p)",
    y_title="P(accept)",
    show_dots=False,
    stroke=True,
    fill=False,
    show_x_guides=False,
    show_y_guides=True,
    legend_at_bottom=True,
    legend_at_bottom_columns=4,
    legend_box_size=28,
    truncate_legend=-1,
    interpolate="hermite",
    interpolation_parameters={"type": "cardinal", "c": 0.75},
    range=(0, 1.05),
    xrange=(0, 0.15),
    x_value_formatter=lambda x: f"{x:.0%}",
    value_formatter=lambda y: f"{y:.2f}",
    allow_interruptions=True,
    x_labels=[0, 0.01, 0.02, 0.04, 0.06, 0.08, 0.10, 0.12, 0.15],
    y_labels=[0, 0.2, 0.4, 0.6, 0.8, 1.0],
    show_minor_y_labels=True,
    js=[],
    print_values=False,
    margin_top=40,
    margin_bottom=80,
    margin_left=60,
    spacing=20,
)

# Linestyle map: solid for n=100 plans, dashed for n=50 to aid distinction near p=0
linestyles = {
    "n=50, c=1": {"width": 6, "dasharray": "16, 10", "linecap": "round"},
    "n=50, c=2": {"width": 6, "dasharray": "4, 8", "linecap": "round"},
    "n=100, c=2": {"width": 12, "linecap": "round", "linejoin": "round"},
    "n=100, c=3": {"width": 6, "linecap": "round", "linejoin": "round"},
}

for _n, _c, label in plans:
    curve_data = list(zip(fraction_defective.tolist(), oc_curves[label].tolist(), strict=True))
    chart.add(
        label,
        curve_data,
        show_dots=False,
        stroke_style=linestyles[label],
        formatter=lambda v: f"P(accept)={v[1]:.3f}" if isinstance(v, (list, tuple)) else f"{v:.3f}",
    )

# AQL vertical reference line — thin dashed, subordinate to curves
chart.add(
    f"AQL ({aql:.0%})",
    [(aql, 0), (aql, 1.05)],
    show_dots=False,
    stroke_style={"width": 3, "dasharray": "14, 8", "linecap": "round"},
)

# LTPD vertical reference line
chart.add(
    f"LTPD ({ltpd:.0%})",
    [(ltpd, 0), (ltpd, 1.05)],
    show_dots=False,
    stroke_style={"width": 3, "dasharray": "14, 8", "linecap": "round"},
)

# Producer's risk point (alpha at AQL for n=100, c=2)
chart.add(
    f"α={alpha:.1%} (producer risk)",
    [(aql, pa_at_aql)],
    stroke=False,
    show_dots=True,
    dots_size=22,
    formatter=lambda v: f"α={1 - v[1]:.1%}" if isinstance(v, (list, tuple)) else f"{v:.3f}",
)

# Consumer's risk point (beta at LTPD for n=100, c=2)
chart.add(
    f"β={beta:.1%} (consumer risk)",
    [(ltpd, beta)],
    stroke=False,
    show_dots=True,
    dots_size=22,
    formatter=lambda v: f"β={v[1]:.1%}" if isinstance(v, (list, tuple)) else f"{v:.3f}",
)

# Post-process SVG: inject CSS to remove the 4-sided box frame (top/right spines).
# Pygal draws a full border rect around the plot area; there is no built-in option
# to suppress individual sides, so we hide the rect stroke via CSS.
_svg = chart.render()
_frame_css = (
    b'<style type="text/css">'
    b".graph .plot .background{stroke:none!important}"
    b".graph .plot rect.background{stroke:none!important}"
    b"</style>"
)
_svg_patched = (
    _svg.replace(b"</defs>", _frame_css + b"</defs>", 1)
    if b"</defs>" in _svg
    else _svg.replace(b"</svg>", _frame_css + b"</svg>", 1)
)

cairosvg.svg2png(bytestring=_svg_patched, write_to=f"plot-{THEME}.png")
with open(f"plot-{THEME}.html", "wb") as f:
    f.write(_svg_patched)
Runnable source as JSON, for any HTTP client: https://api.anyplot.ai/specs/curve-oc/pygal/code. Any spec id and library id listed in llms-full.txt fit the same URL shape; every URL below is complete and callable.
{
  "spec_id": "curve-oc",
  "language": "python",
  "library": "pygal",
  "page": "https://anyplot.ai/curve-oc/python/pygal",
  "hub": "https://anyplot.ai/curve-oc",
  "code_json": "https://api.anyplot.ai/specs/curve-oc/pygal/code",
  "spec_json": "https://api.anyplot.ai/specs/curve-oc",
  "render_light_png": "https://storage.googleapis.com/anyplot-images/plots/curve-oc/python/pygal/plot-light.png",
  "render_dark_png": "https://storage.googleapis.com/anyplot-images/plots/curve-oc/python/pygal/plot-dark.png",
  "interactive_light_html": "https://storage.googleapis.com/anyplot-images/plots/curve-oc/python/pygal/plot-light.html",
  "interactive_dark_html": "https://storage.googleapis.com/anyplot-images/plots/curve-oc/python/pygal/plot-dark.html",
  "quality_score": 88.0,
  "license": "MIT",
  "guide": "https://anyplot.ai/llms.txt"
}
Part of Operating Characteristic (OC) Curve on anyplot.ai.