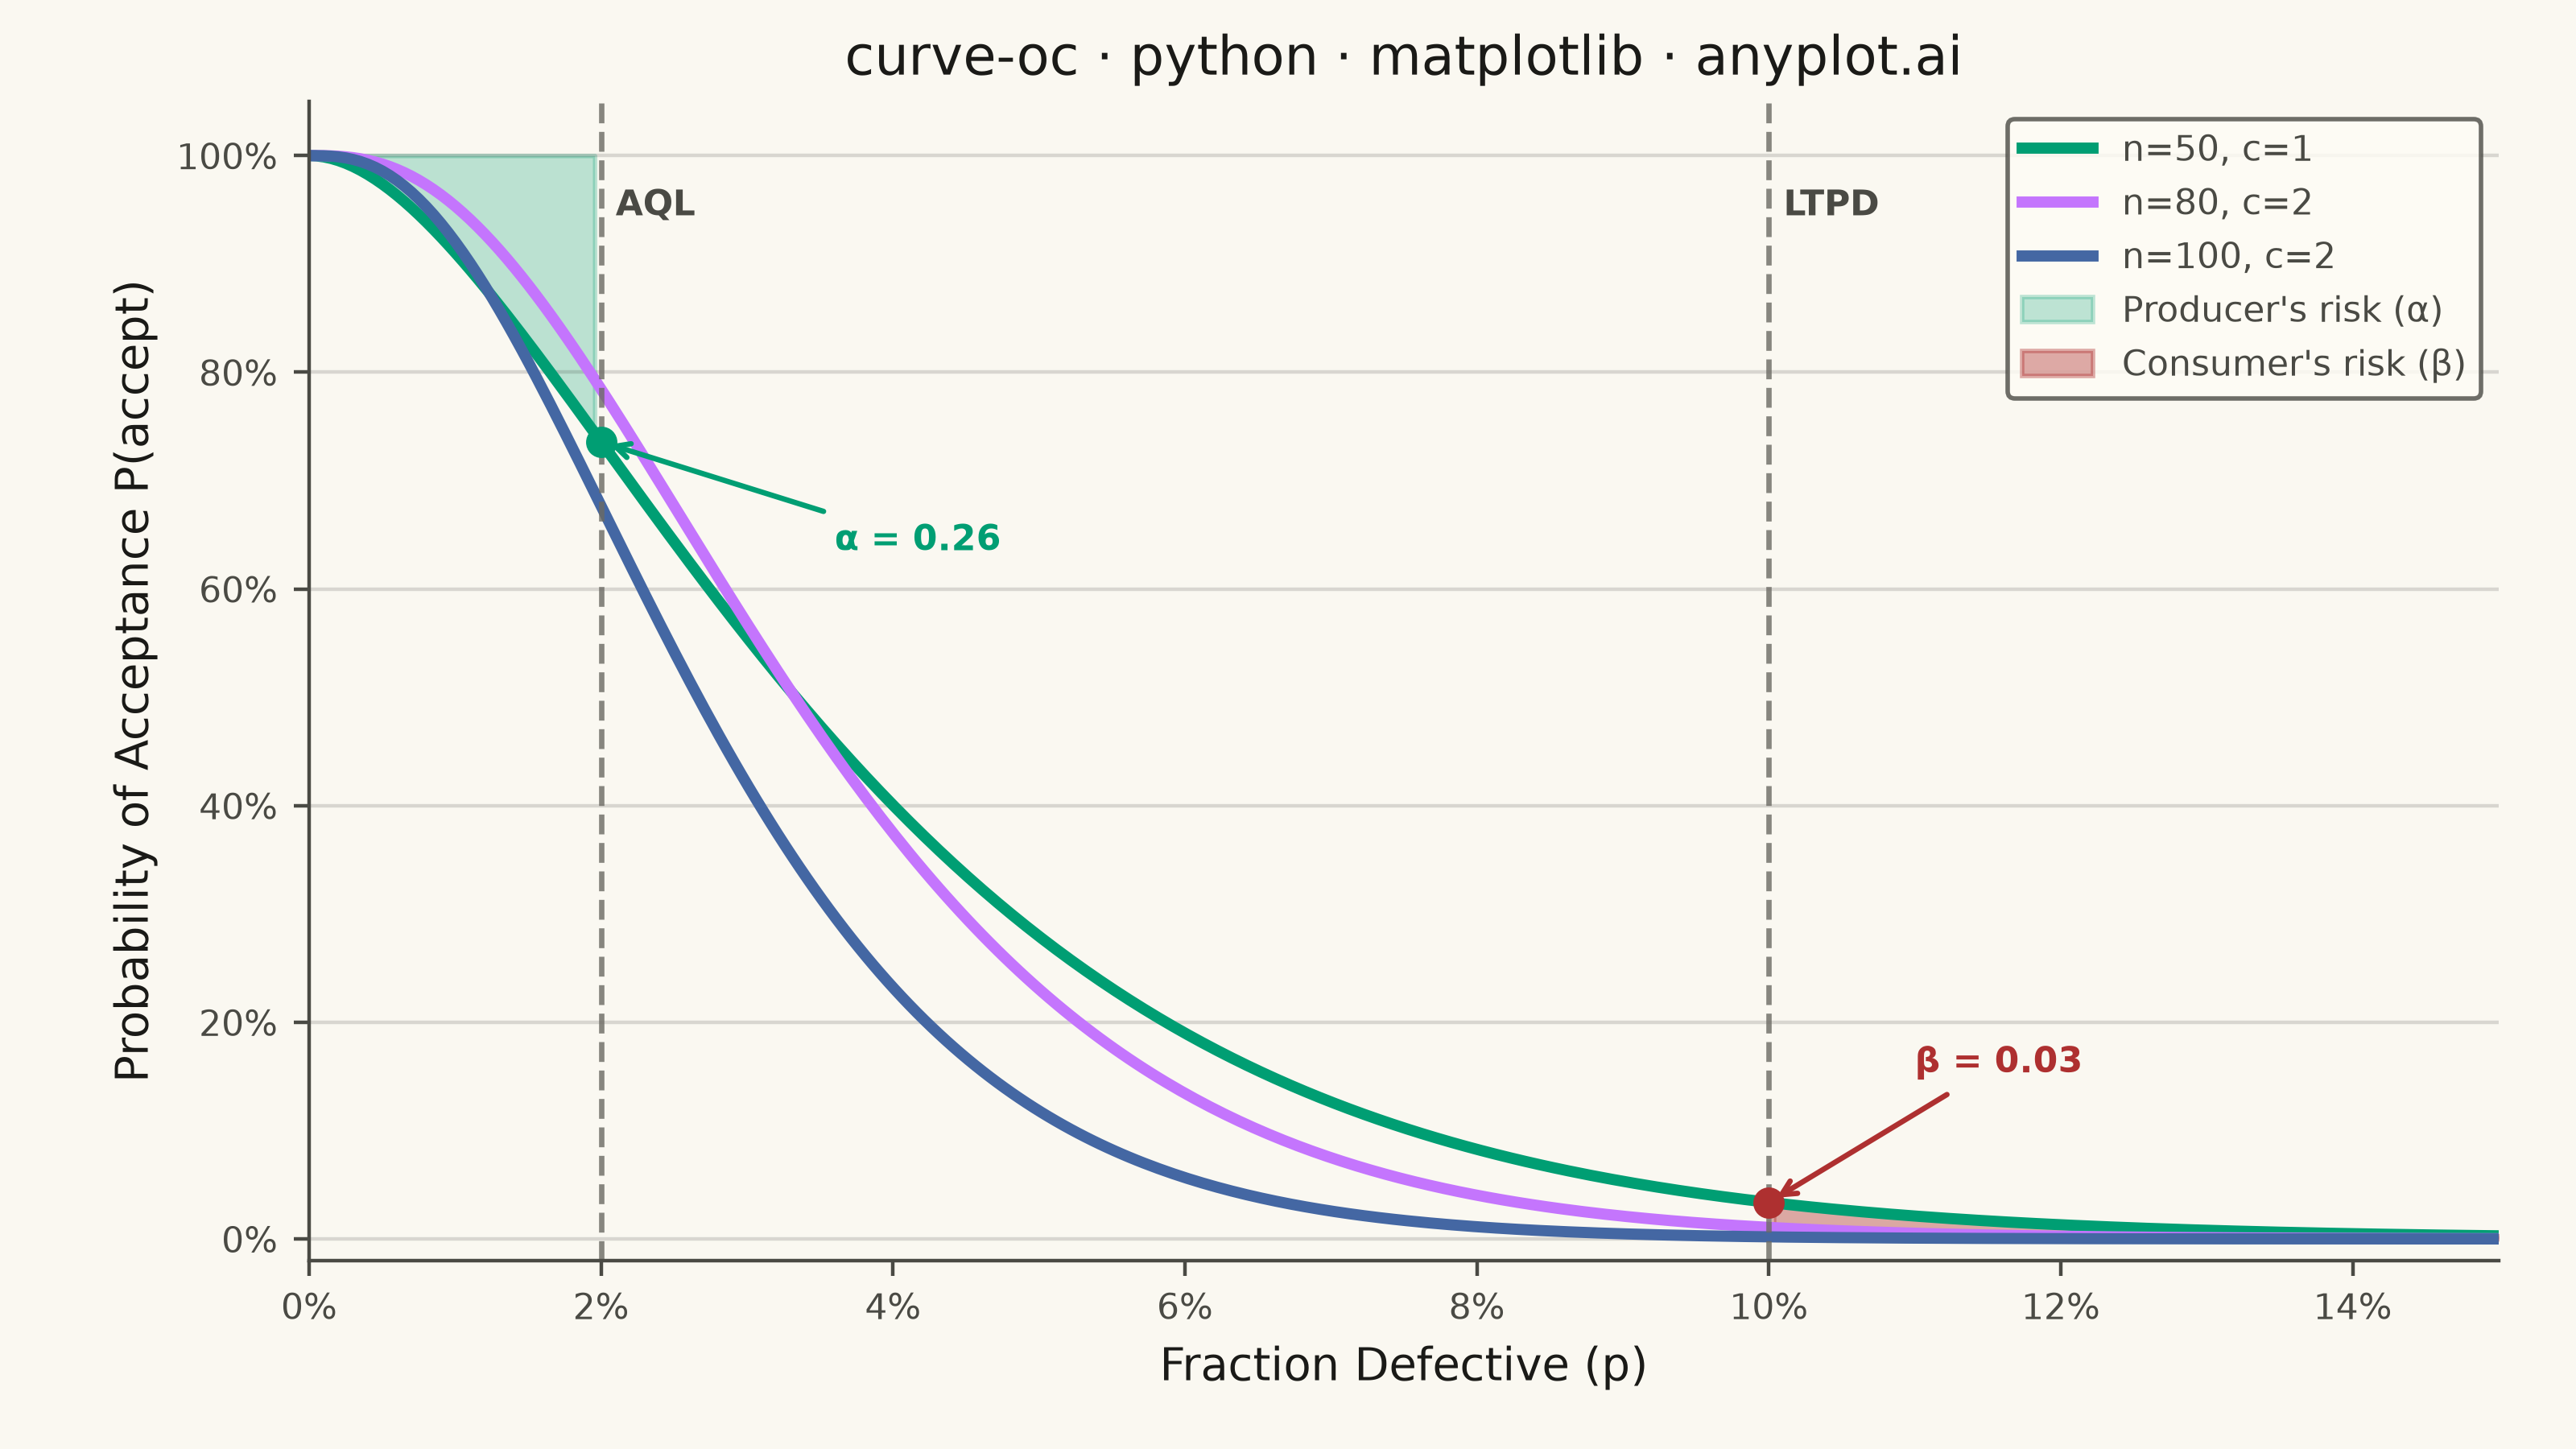
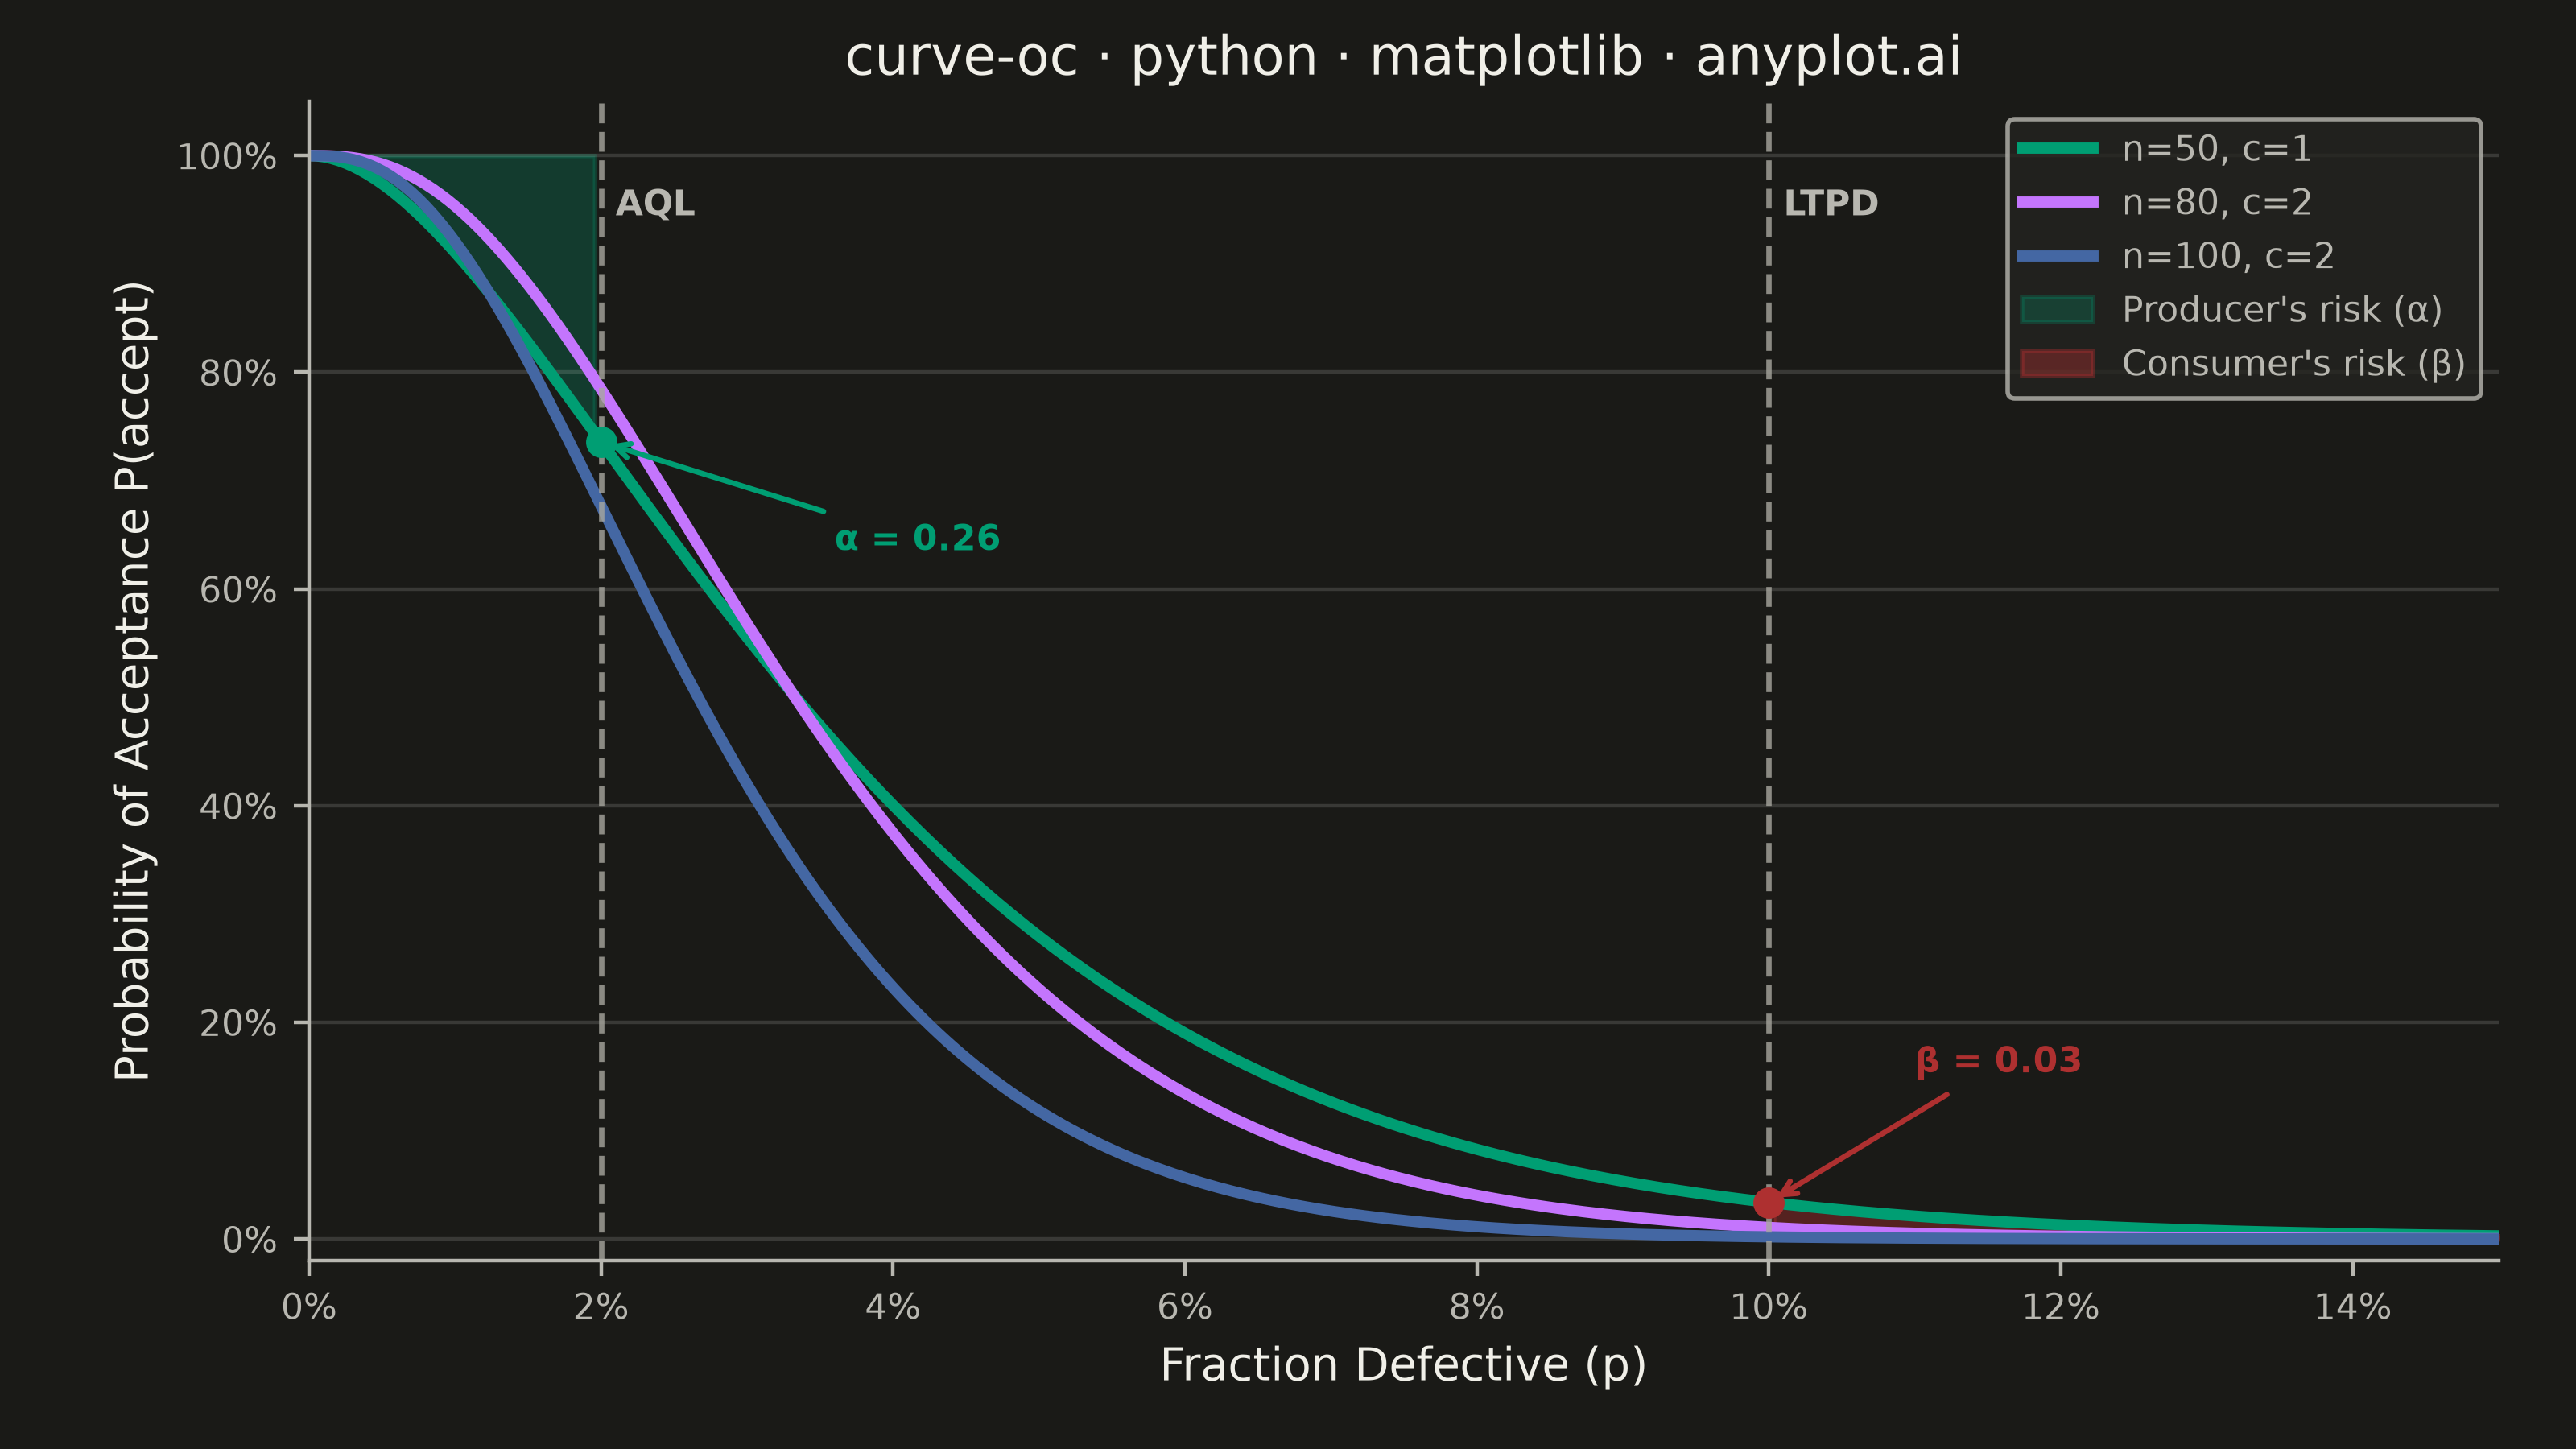
An Operating Characteristic (OC) curve shows the probability of accepting a lot as a function of the true fraction defective in that lot. It is the primary tool for evaluating and comparing acceptance sampling plans, revealing how well an inspection plan discriminates between good and bad lots. The S-shaped curve highlights producer's risk (rejecting good lots) and consumer's risk (accepting bad lots), making it essential for designing effective quality inspection strategies.
""" anyplot.ai
curve-oc: Operating Characteristic (OC) Curve
Library: matplotlib 3.11.0 | Python 3.13.14
Quality: 90/100 | Updated: 2026-06-20
"""

import os
from math import comb

import matplotlib.pyplot as plt
import matplotlib.ticker as mticker
import numpy as np


# Theme
THEME = os.getenv("ANYPLOT_THEME", "light")
PAGE_BG = "#FAF8F1" if THEME == "light" else "#1A1A17"
ELEVATED_BG = "#FFFDF6" if THEME == "light" else "#242420"
INK = "#1A1A17" if THEME == "light" else "#F0EFE8"
INK_SOFT = "#4A4A44" if THEME == "light" else "#B8B7B0"
INK_MUTED = "#6B6A63" if THEME == "light" else "#A8A79F"

# Imprint palette — first series is always #009E73
IMPRINT_PALETTE = ["#009E73", "#C475FD", "#4467A3", "#BD8233", "#AE3030", "#2ABCCD", "#954477", "#99B314"]

# Data
fraction_defective = np.linspace(0, 0.15, 300)

sampling_plans = [
    {"n": 50, "c": 1, "label": "n=50, c=1"},
    {"n": 80, "c": 2, "label": "n=80, c=2"},
    {"n": 100, "c": 2, "label": "n=100, c=2"},
]

oc_curves = {}
for plan in sampling_plans:
    n, c = plan["n"], plan["c"]
    prob_accept = sum(comb(n, k) * fraction_defective**k * (1 - fraction_defective) ** (n - k) for k in range(c + 1))
    oc_curves[plan["label"]] = prob_accept

aql = 0.02
ltpd = 0.10

# Plot — 3200 × 1800 px canvas (landscape 16:9)
colors = IMPRINT_PALETTE[:3]
fig, ax = plt.subplots(figsize=(8, 4.5), dpi=400, facecolor=PAGE_BG)
ax.set_facecolor(PAGE_BG)

for (label, prob_accept), color in zip(oc_curves.items(), colors, strict=False):
    ax.plot(fraction_defective, prob_accept, linewidth=2.5, color=color, label=label)

# Shaded risk regions
n0, c0 = sampling_plans[0]["n"], sampling_plans[0]["c"]
first_curve = oc_curves[sampling_plans[0]["label"]]

# Producer's risk (α): probability of rejecting an acceptable lot — shade above curve at AQL
aql_mask = fraction_defective <= aql
ax.fill_between(
    fraction_defective[aql_mask], first_curve[aql_mask], 1.0, alpha=0.25, color=colors[0], label="Producer's risk (α)"
)

# Consumer's risk (β): probability of accepting a bad lot — #AE3030 for semantic error role
ltpd_mask = fraction_defective >= ltpd
ax.fill_between(
    fraction_defective[ltpd_mask], 0, first_curve[ltpd_mask], alpha=0.40, color="#AE3030", label="Consumer's risk (β)"
)

# AQL and LTPD reference lines
ax.axvline(x=aql, color=INK_MUTED, linestyle="--", linewidth=1.2, alpha=0.8)
ax.axvline(x=ltpd, color=INK_MUTED, linestyle="--", linewidth=1.2, alpha=0.8)

ax.text(aql + 0.001, 0.97, "AQL", fontsize=8, fontweight="bold", color=INK_SOFT, ha="left", va="top")
ax.text(ltpd + 0.001, 0.97, "LTPD", fontsize=8, fontweight="bold", color=INK_SOFT, ha="left", va="top")

# Producer's risk annotation at AQL for first plan
pa_at_aql = sum(comb(n0, k) * aql**k * (1 - aql) ** (n0 - k) for k in range(c0 + 1))
alpha_value = 1 - pa_at_aql
ax.plot(aql, pa_at_aql, "o", color=colors[0], markersize=6, zorder=5)
ax.annotate(
    f"α = {alpha_value:.2f}",
    xy=(aql, pa_at_aql),
    xytext=(aql + 0.016, pa_at_aql - 0.10),
    fontsize=8,
    color=colors[0],
    fontweight="bold",
    arrowprops={"arrowstyle": "->", "color": colors[0], "lw": 1.2},
)

# Consumer's risk annotation at LTPD for first plan
beta_value = sum(comb(n0, k) * ltpd**k * (1 - ltpd) ** (n0 - k) for k in range(c0 + 1))
ax.plot(ltpd, beta_value, "o", color="#AE3030", markersize=6, zorder=5)
ax.annotate(
    f"β = {beta_value:.2f}",
    xy=(ltpd, beta_value),
    xytext=(ltpd + 0.010, beta_value + 0.12),
    fontsize=8,
    color="#AE3030",
    fontweight="bold",
    arrowprops={"arrowstyle": "->", "color": "#AE3030", "lw": 1.2},
)

# Axis formatting — percentage labels
ax.xaxis.set_major_formatter(mticker.FuncFormatter(lambda x, _: f"{x:.0%}"))
ax.yaxis.set_major_formatter(mticker.FuncFormatter(lambda y, _: f"{y:.0%}"))
ax.xaxis.set_major_locator(mticker.MultipleLocator(0.02))

# Title: 44 chars < 67, so default 12pt
title = "curve-oc · python · matplotlib · anyplot.ai"
ax.set_title(title, fontsize=12, fontweight="medium", color=INK)
ax.set_xlabel("Fraction Defective (p)", fontsize=10, color=INK)
ax.set_ylabel("Probability of Acceptance P(accept)", fontsize=10, color=INK)
ax.tick_params(axis="both", labelsize=8, colors=INK_SOFT, labelcolor=INK_SOFT)

# Legend
leg = ax.legend(fontsize=8, frameon=True, loc="upper right")
if leg:
    leg.get_frame().set_facecolor(ELEVATED_BG)
    leg.get_frame().set_edgecolor(INK_SOFT)
    plt.setp(leg.get_texts(), color=INK_SOFT)

ax.set_xlim(0, 0.15)
ax.set_ylim(-0.02, 1.05)

# Spines
ax.spines["top"].set_visible(False)
ax.spines["right"].set_visible(False)
for s in ("left", "bottom"):
    ax.spines[s].set_color(INK_SOFT)

# Subtle y-axis grid
ax.yaxis.grid(True, alpha=0.15, linewidth=0.8, color=INK)

fig.subplots_adjust(left=0.12, right=0.97, top=0.93, bottom=0.13)
plt.savefig(f"plot-{THEME}.png", dpi=400, facecolor=PAGE_BG)
Runnable source as JSON, for any HTTP client: https://api.anyplot.ai/specs/curve-oc/matplotlib/code. Any spec id and library id listed in llms-full.txt fit the same URL shape; every URL below is complete and callable.
{
  "spec_id": "curve-oc",
  "language": "python",
  "library": "matplotlib",
  "page": "https://anyplot.ai/curve-oc/python/matplotlib",
  "hub": "https://anyplot.ai/curve-oc",
  "code_json": "https://api.anyplot.ai/specs/curve-oc/matplotlib/code",
  "spec_json": "https://api.anyplot.ai/specs/curve-oc",
  "render_light_png": "https://storage.googleapis.com/anyplot-images/plots/curve-oc/python/matplotlib/plot-light.png",
  "render_dark_png": "https://storage.googleapis.com/anyplot-images/plots/curve-oc/python/matplotlib/plot-dark.png",
  "quality_score": 90.0,
  "license": "MIT",
  "guide": "https://anyplot.ai/llms.txt"
}
Part of Operating Characteristic (OC) Curve on anyplot.ai.