The same plot in 14 other libraries — JavaScript: D3.js, Apache ECharts, Highcharts, MUI X Charts; Python: Altair, Bokeh, lets-plot, Matplotlib, Plotly, plotnine, Pygal, Seaborn; R: ggplot2; Julia: Makie.jl. Compare all 15 side by side: Basic Data Matrix 2D Barcode in Python, R, Julia and JavaScript.
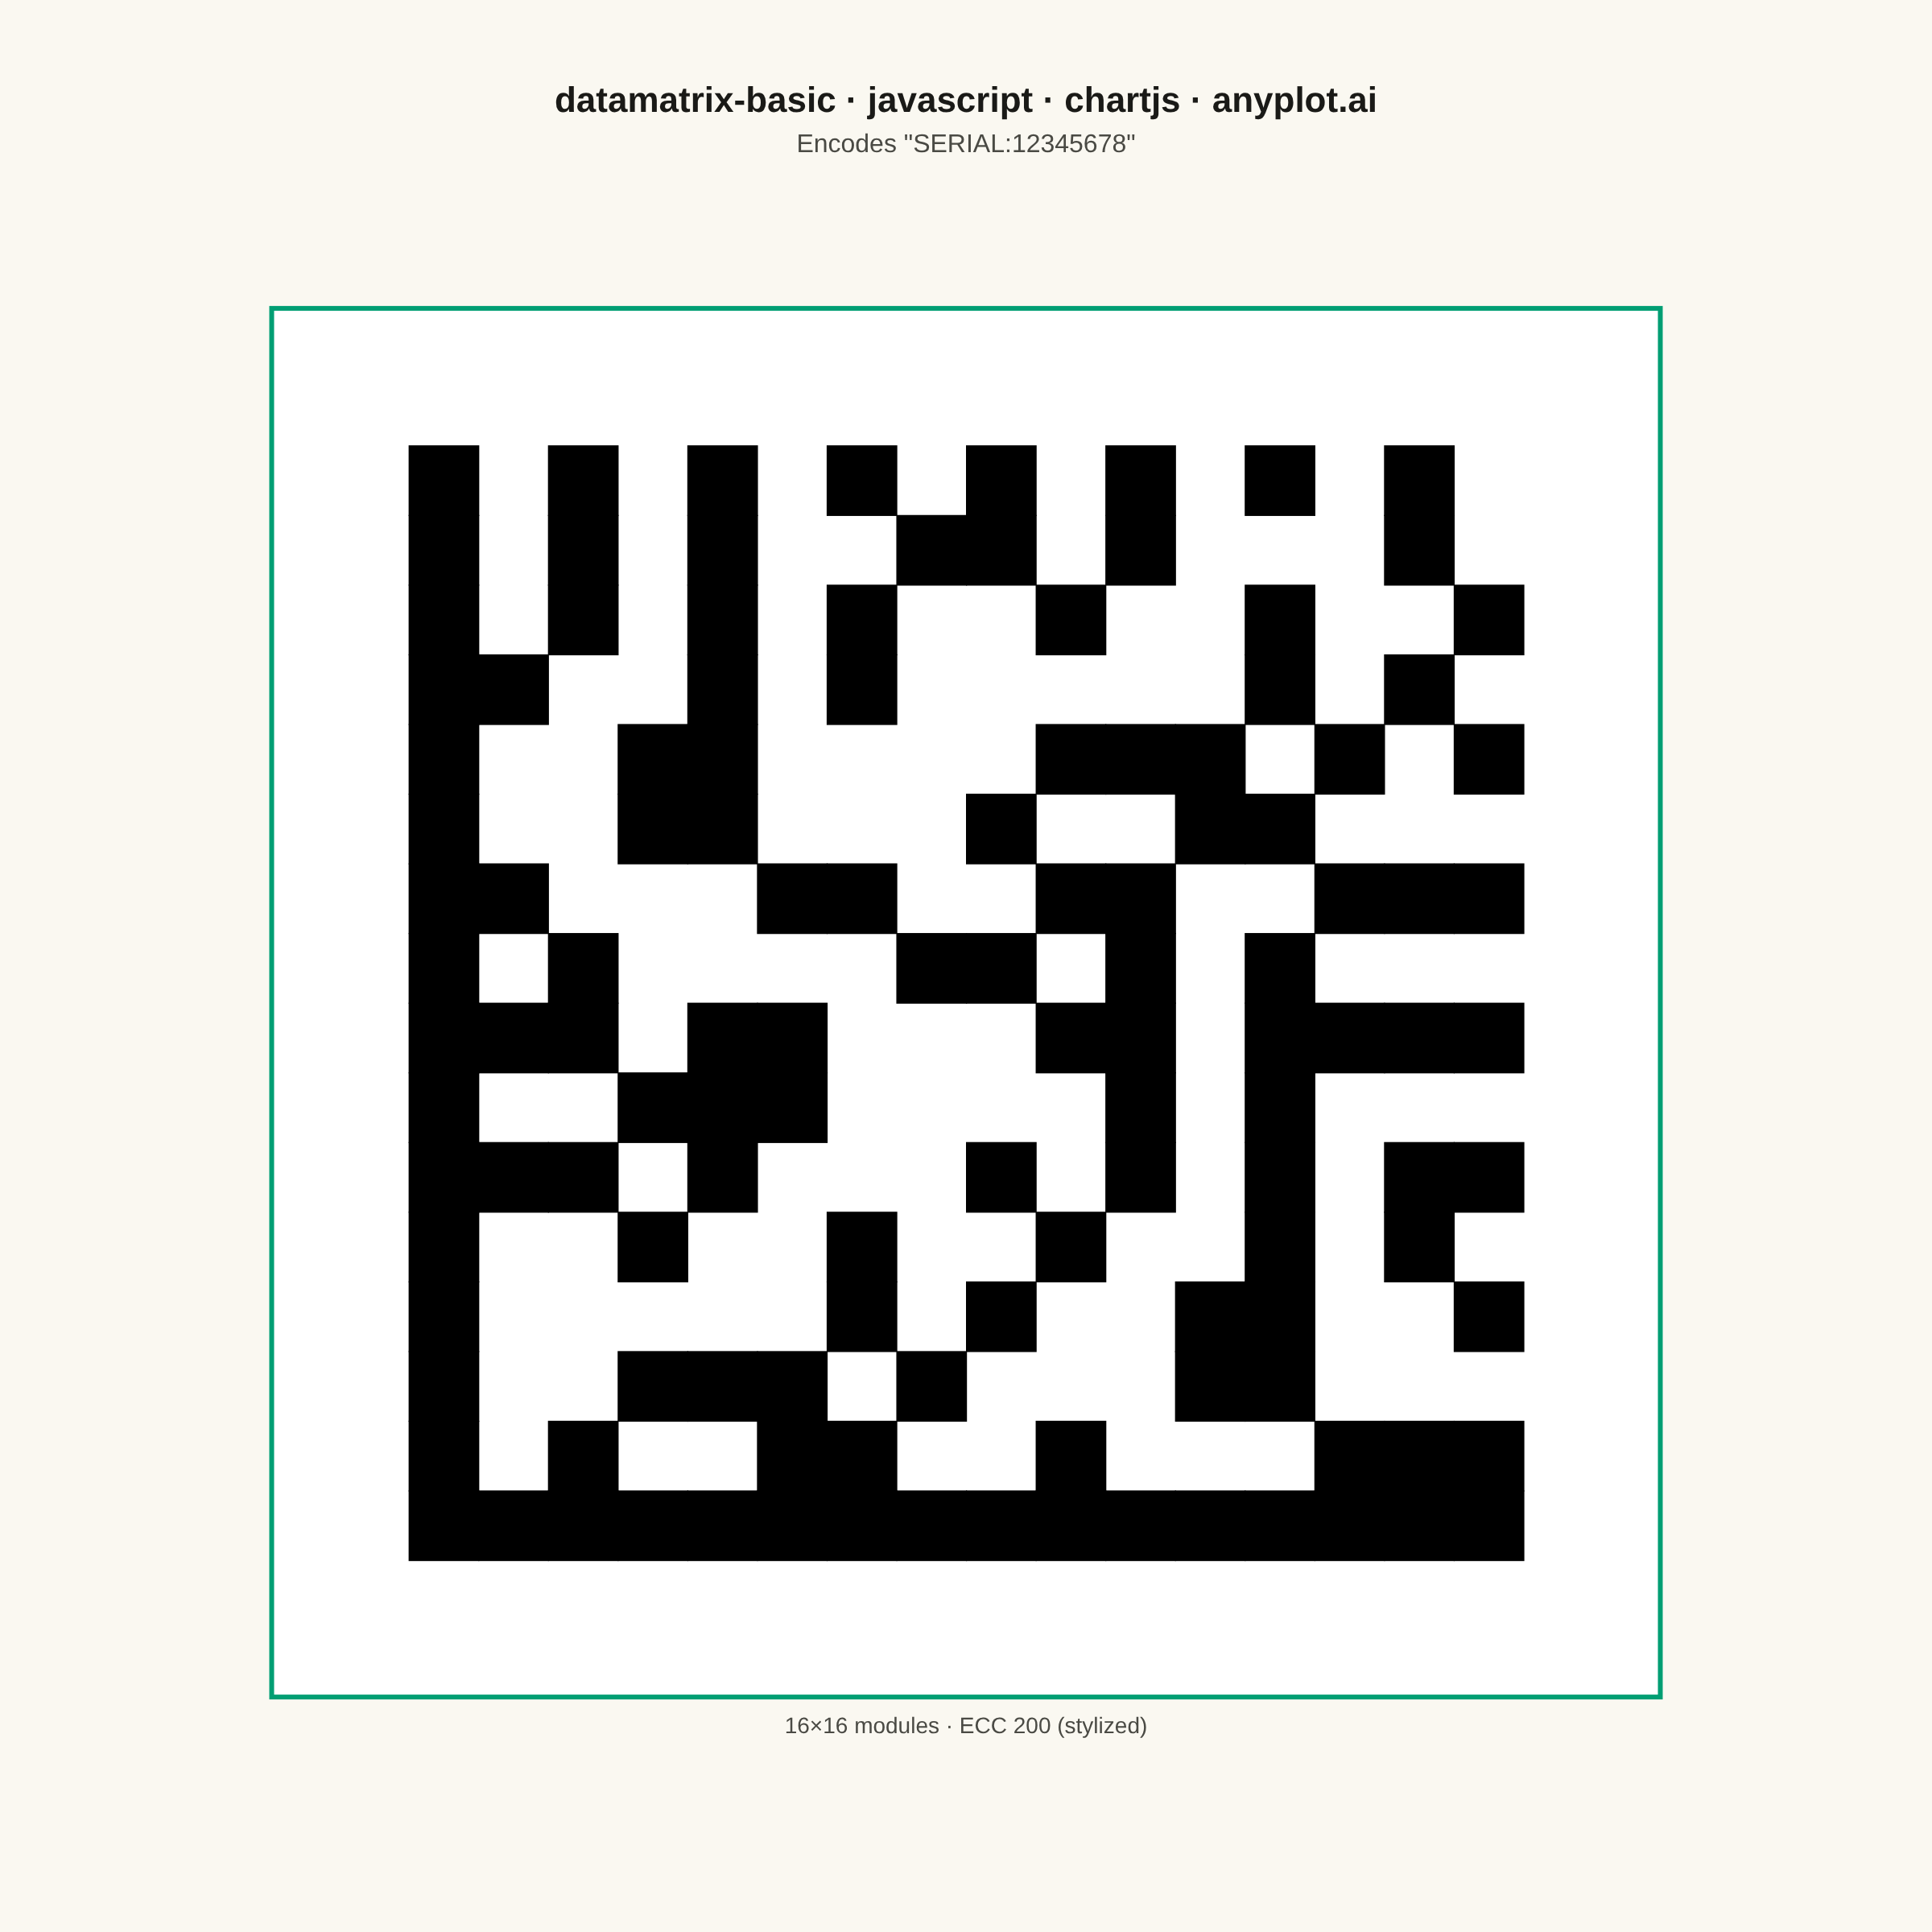
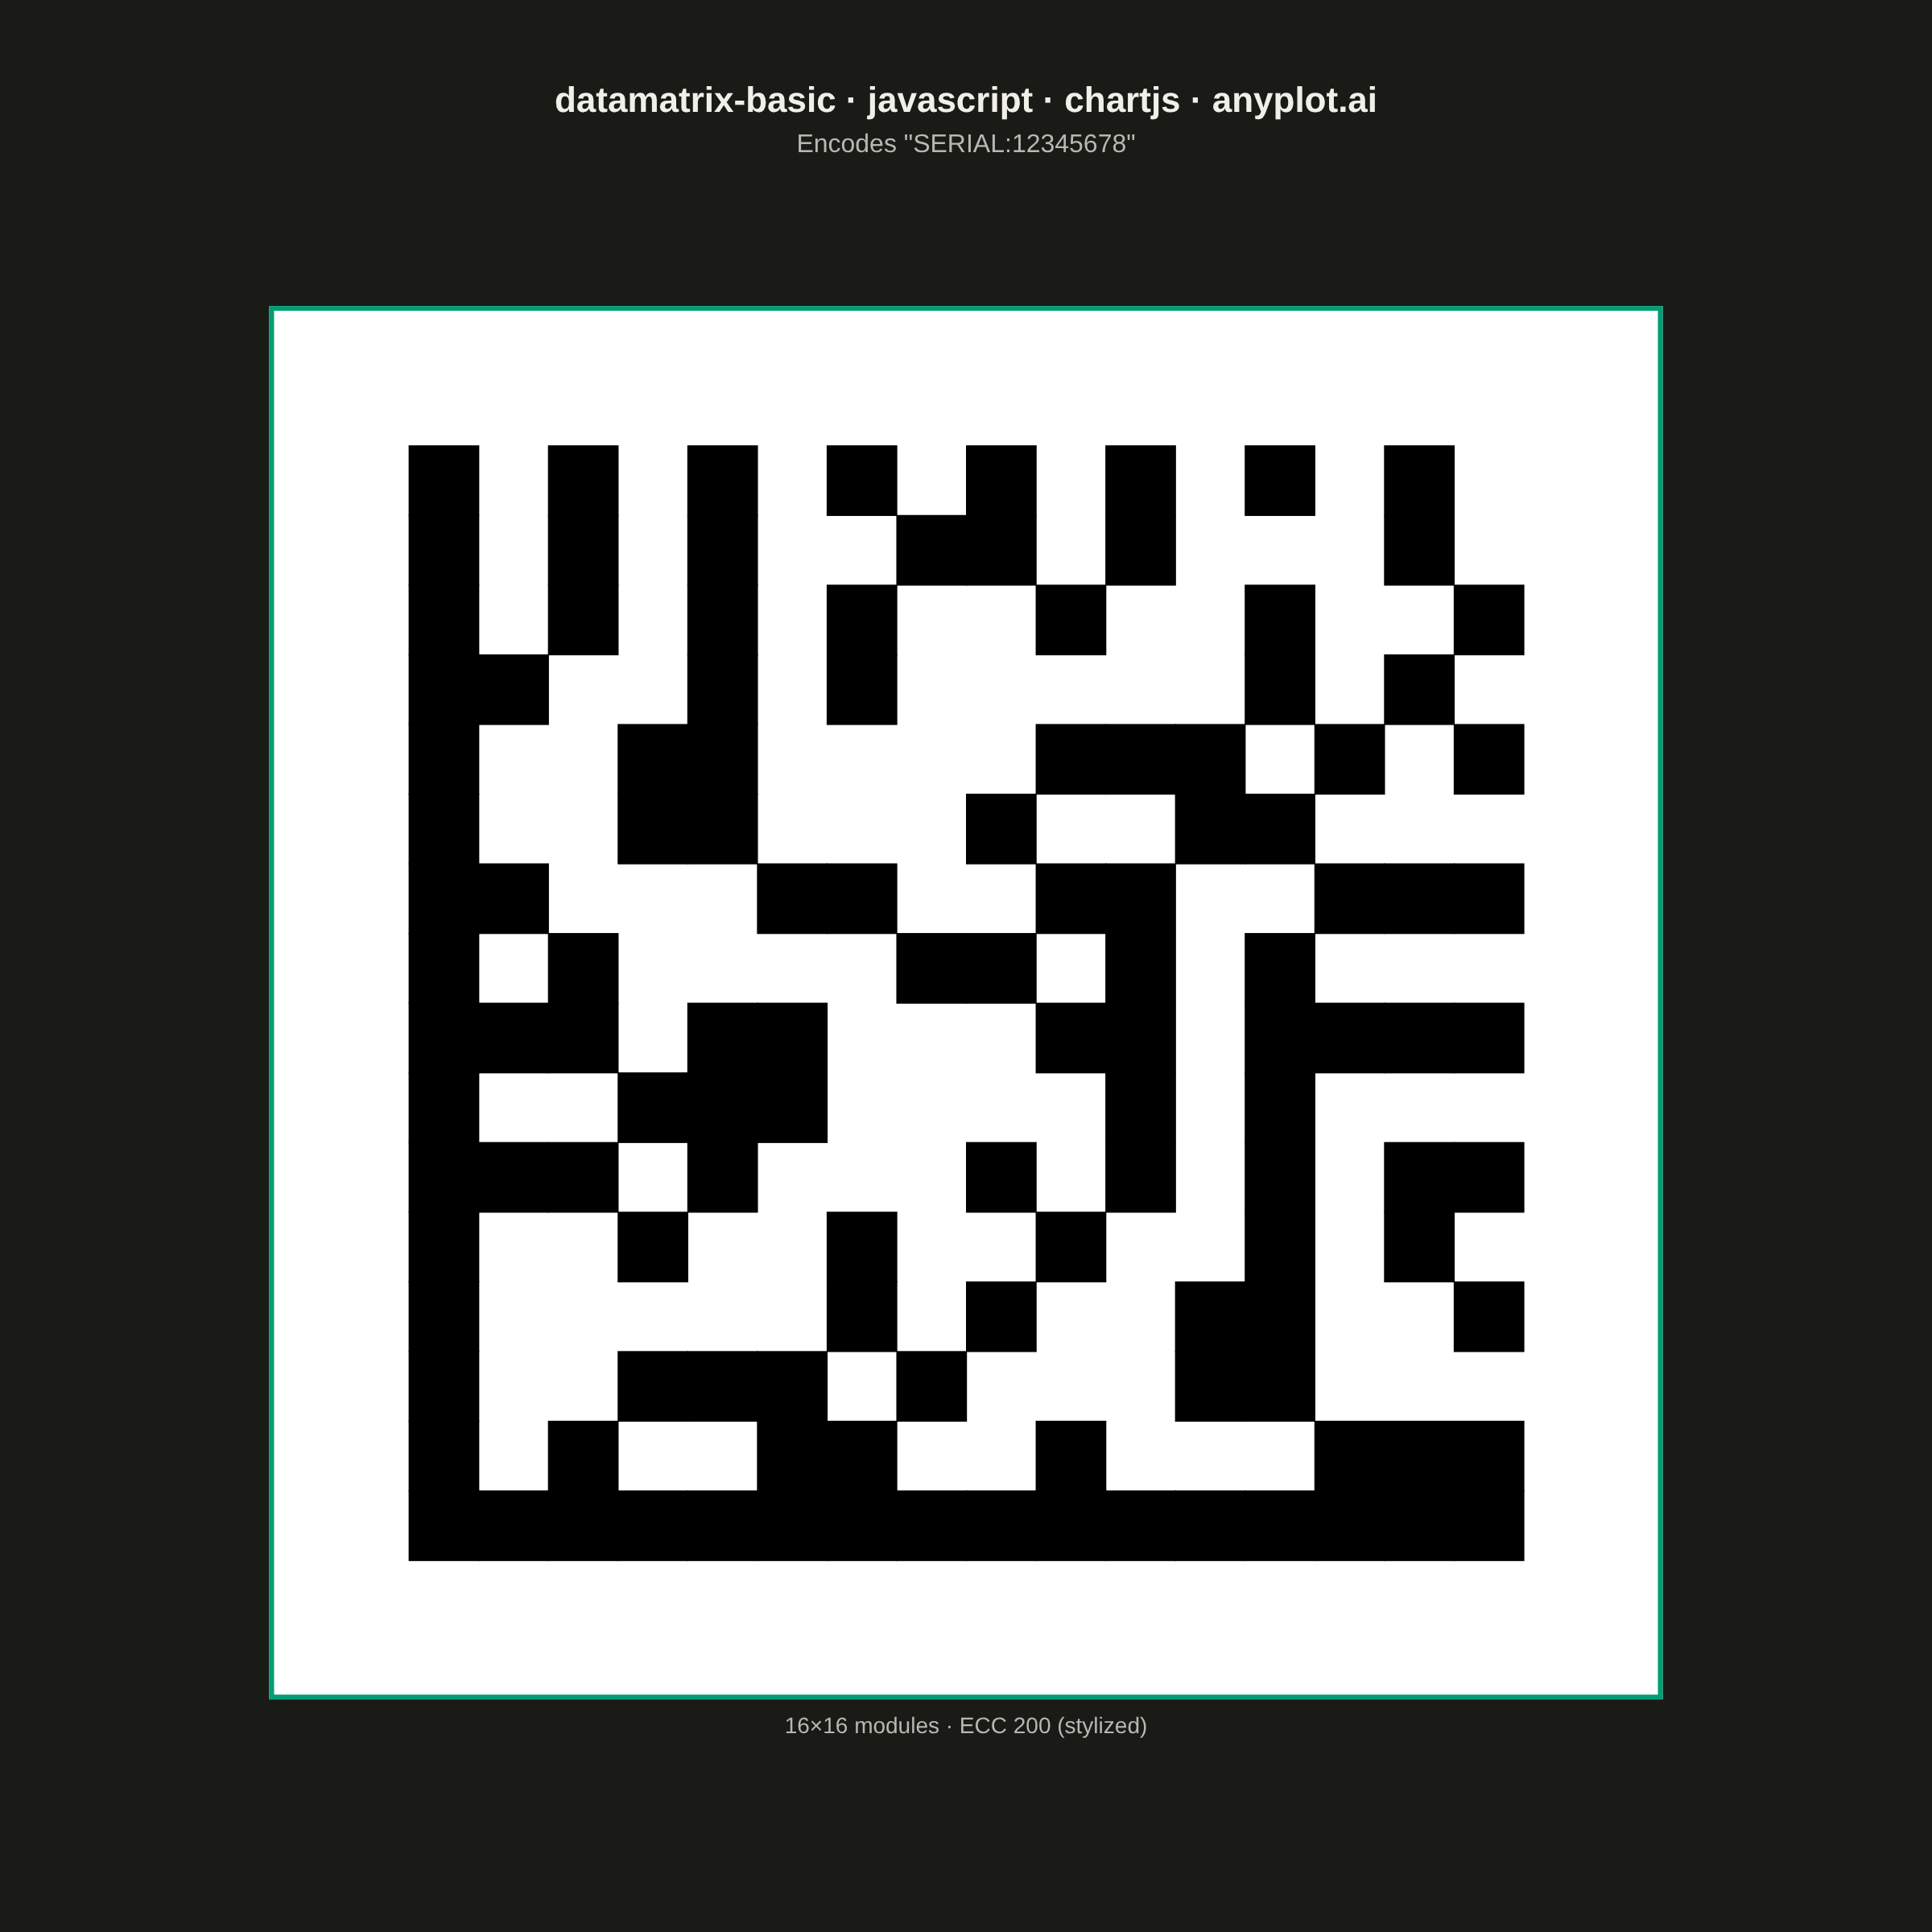
A Data Matrix 2D barcode visualization that encodes data into a compact square or rectangular matrix of black and white cells. Data Matrix codes follow the ISO/IEC 16022 standard, featuring an L-shaped finder pattern (solid borders on two adjacent sides) and alternating timing patterns on the opposite sides. This barcode format is ideal for marking small items and supports high data density with built-in error correction (ECC 200).
// anyplot.ai
// datamatrix-basic: Basic Data Matrix 2D Barcode
// Library: chartjs 4.4.7 | JavaScript 22.23.2
// Quality: 90/100 | Created: 2026-09-02

//# anyplot-orientation: square
const t = window.ANYPLOT_TOKENS;

// --- Data --------------------------------------------------------------
// Chart.js has no core "matrix" chart type — chartjs-chart-matrix is a
// community plugin and is not installed. The module grid below is drawn by
// a custom plugin instead, so the data model here is the ISO/IEC 16022
// module layout itself: a solid L-shaped finder pattern (left column +
// bottom row), an alternating clock/timing track (top row + right column),
// and interior "data" modules derived deterministically from the ASCII
// bits of the encoded content string.
const content = "SERIAL:12345678";
const gridSize = 16;

const bits = [];
for (const char of content) {
  const code = char.charCodeAt(0);
  for (let b = 7; b >= 0; b--) bits.push((code >> b) & 1);
}

const modules = [];
for (let row = 0; row < gridSize; row++) {
  const line = [];
  for (let col = 0; col < gridSize; col++) {
    let dark;
    if (col === 0 || row === gridSize - 1) {
      dark = true; // solid L-shaped finder pattern
    } else if (row === 0) {
      dark = col % 2 === 0; // top timing/clock track
    } else if (col === gridSize - 1) {
      dark = row % 2 === 0; // right timing/clock track
    } else {
      const bitIndex = (row - 1) * (gridSize - 2) + (col - 1);
      dark = bits[bitIndex % bits.length] === 1;
    }
    line.push(dark);
  }
  modules.push(line);
}

// --- Mount -----------------------------------------------------------------
const canvas = document.createElement("canvas");
document.getElementById("container").appendChild(canvas);

// --- Chart -----------------------------------------------------------------
// An empty scatter chart provides the theme-aware title/canvas scaffolding;
// a custom plugin draws the module grid directly onto the chart area so the
// modules stay perfectly square regardless of the title's reserved height.
// The card + modules stay fixed black-on-white in BOTH themes (per the spec's
// "high contrast black on white" note and the qrcode-basic precedent) — only
// the surrounding page background/title/subtitle/caption follow theme tokens.
const QUIET = 2; // module-widths of quiet zone around the grid
const CAPTION_H = 34; // space reserved below the card for the caption line
const moduleGridPlugin = {
  id: "datamatrixGrid",
  afterDraw(chart) {
    const { ctx, chartArea } = chart;
    const areaWidth = chartArea.right - chartArea.left;
    const areaHeight = chartArea.bottom - chartArea.top;
    const totalModules = gridSize + QUIET * 2;
    const side = Math.min(areaWidth, areaHeight - CAPTION_H) * 0.86;
    const cell = side / totalModules;
    const cardX = chartArea.left + (areaWidth - side) / 2;
    const cardY = chartArea.top + (areaHeight - CAPTION_H - side) / 2;
    const gridX = cardX + QUIET * cell;
    const gridY = cardY + QUIET * cell;

    ctx.save();

    // Fixed white card behind the grid (includes the quiet zone).
    ctx.fillStyle = "#FFFFFF";
    ctx.fillRect(cardX, cardY, side, side);

    // Fixed black modules, identical in both themes.
    ctx.fillStyle = "#000000";
    for (let row = 0; row < gridSize; row++) {
      for (let col = 0; col < gridSize; col++) {
        if (modules[row][col]) {
          ctx.fillRect(gridX + col * cell, gridY + row * cell, cell + 0.6, cell + 0.6);
        }
      }
    }

    // Brand accent: thin #009E73 border framing the card (theme-adaptive palette token).
    ctx.strokeStyle = t.palette[0];
    ctx.lineWidth = 3;
    ctx.strokeRect(cardX + 1.5, cardY + 1.5, side - 3, side - 3);

    // Caption below the card, theme-adaptive.
    ctx.textAlign = "center";
    ctx.textBaseline = "middle";
    ctx.fillStyle = t.inkSoft;
    ctx.font = `14px -apple-system, BlinkMacSystemFont, "Segoe UI", Roboto, sans-serif`;
    ctx.fillText(
      `${gridSize}×${gridSize} modules · ECC 200 (stylized)`,
      cardX + side / 2,
      cardY + side + CAPTION_H / 2
    );

    ctx.restore();
  },
};

new Chart(canvas, {
  type: "scatter",
  data: { datasets: [] },
  plugins: [moduleGridPlugin],
  options: {
    responsive: true,
    maintainAspectRatio: false,
    animation: false,
    layout: { padding: 40 },
    scales: {
      x: { display: false },
      y: { display: false },
    },
    plugins: {
      legend: { display: false },
      title: {
        display: true,
        text: "datamatrix-basic · javascript · chartjs · anyplot.ai",
        color: t.ink,
        font: { size: 22 },
        padding: { top: 10, bottom: 4 },
      },
      subtitle: {
        display: true,
        text: `Encodes "${content}"`,
        color: t.inkSoft,
        font: { size: 16, style: "normal" },
        padding: { bottom: 20 },
      },
    },
  },
});
Runnable source as JSON, for any HTTP client: https://api.anyplot.ai/specs/datamatrix-basic/chartjs/code. Any spec id and library id listed in llms-full.txt fit the same URL shape; every URL below is complete and callable.
{
  "spec_id": "datamatrix-basic",
  "language": "javascript",
  "library": "chartjs",
  "page": "https://anyplot.ai/datamatrix-basic/javascript/chartjs",
  "hub": "https://anyplot.ai/datamatrix-basic",
  "code_json": "https://api.anyplot.ai/specs/datamatrix-basic/chartjs/code",
  "spec_json": "https://api.anyplot.ai/specs/datamatrix-basic",
  "render_light_png": "https://storage.googleapis.com/anyplot-images/plots/datamatrix-basic/javascript/chartjs/plot-light.png",
  "render_dark_png": "https://storage.googleapis.com/anyplot-images/plots/datamatrix-basic/javascript/chartjs/plot-dark.png",
  "interactive_light_html": "https://storage.googleapis.com/anyplot-images/plots/datamatrix-basic/javascript/chartjs/plot-light.html",
  "interactive_dark_html": "https://storage.googleapis.com/anyplot-images/plots/datamatrix-basic/javascript/chartjs/plot-dark.html",
  "quality_score": 90.0,
  "license": "MIT",
  "guide": "https://anyplot.ai/llms.txt"
}
Part of Basic Data Matrix 2D Barcode on anyplot.ai.