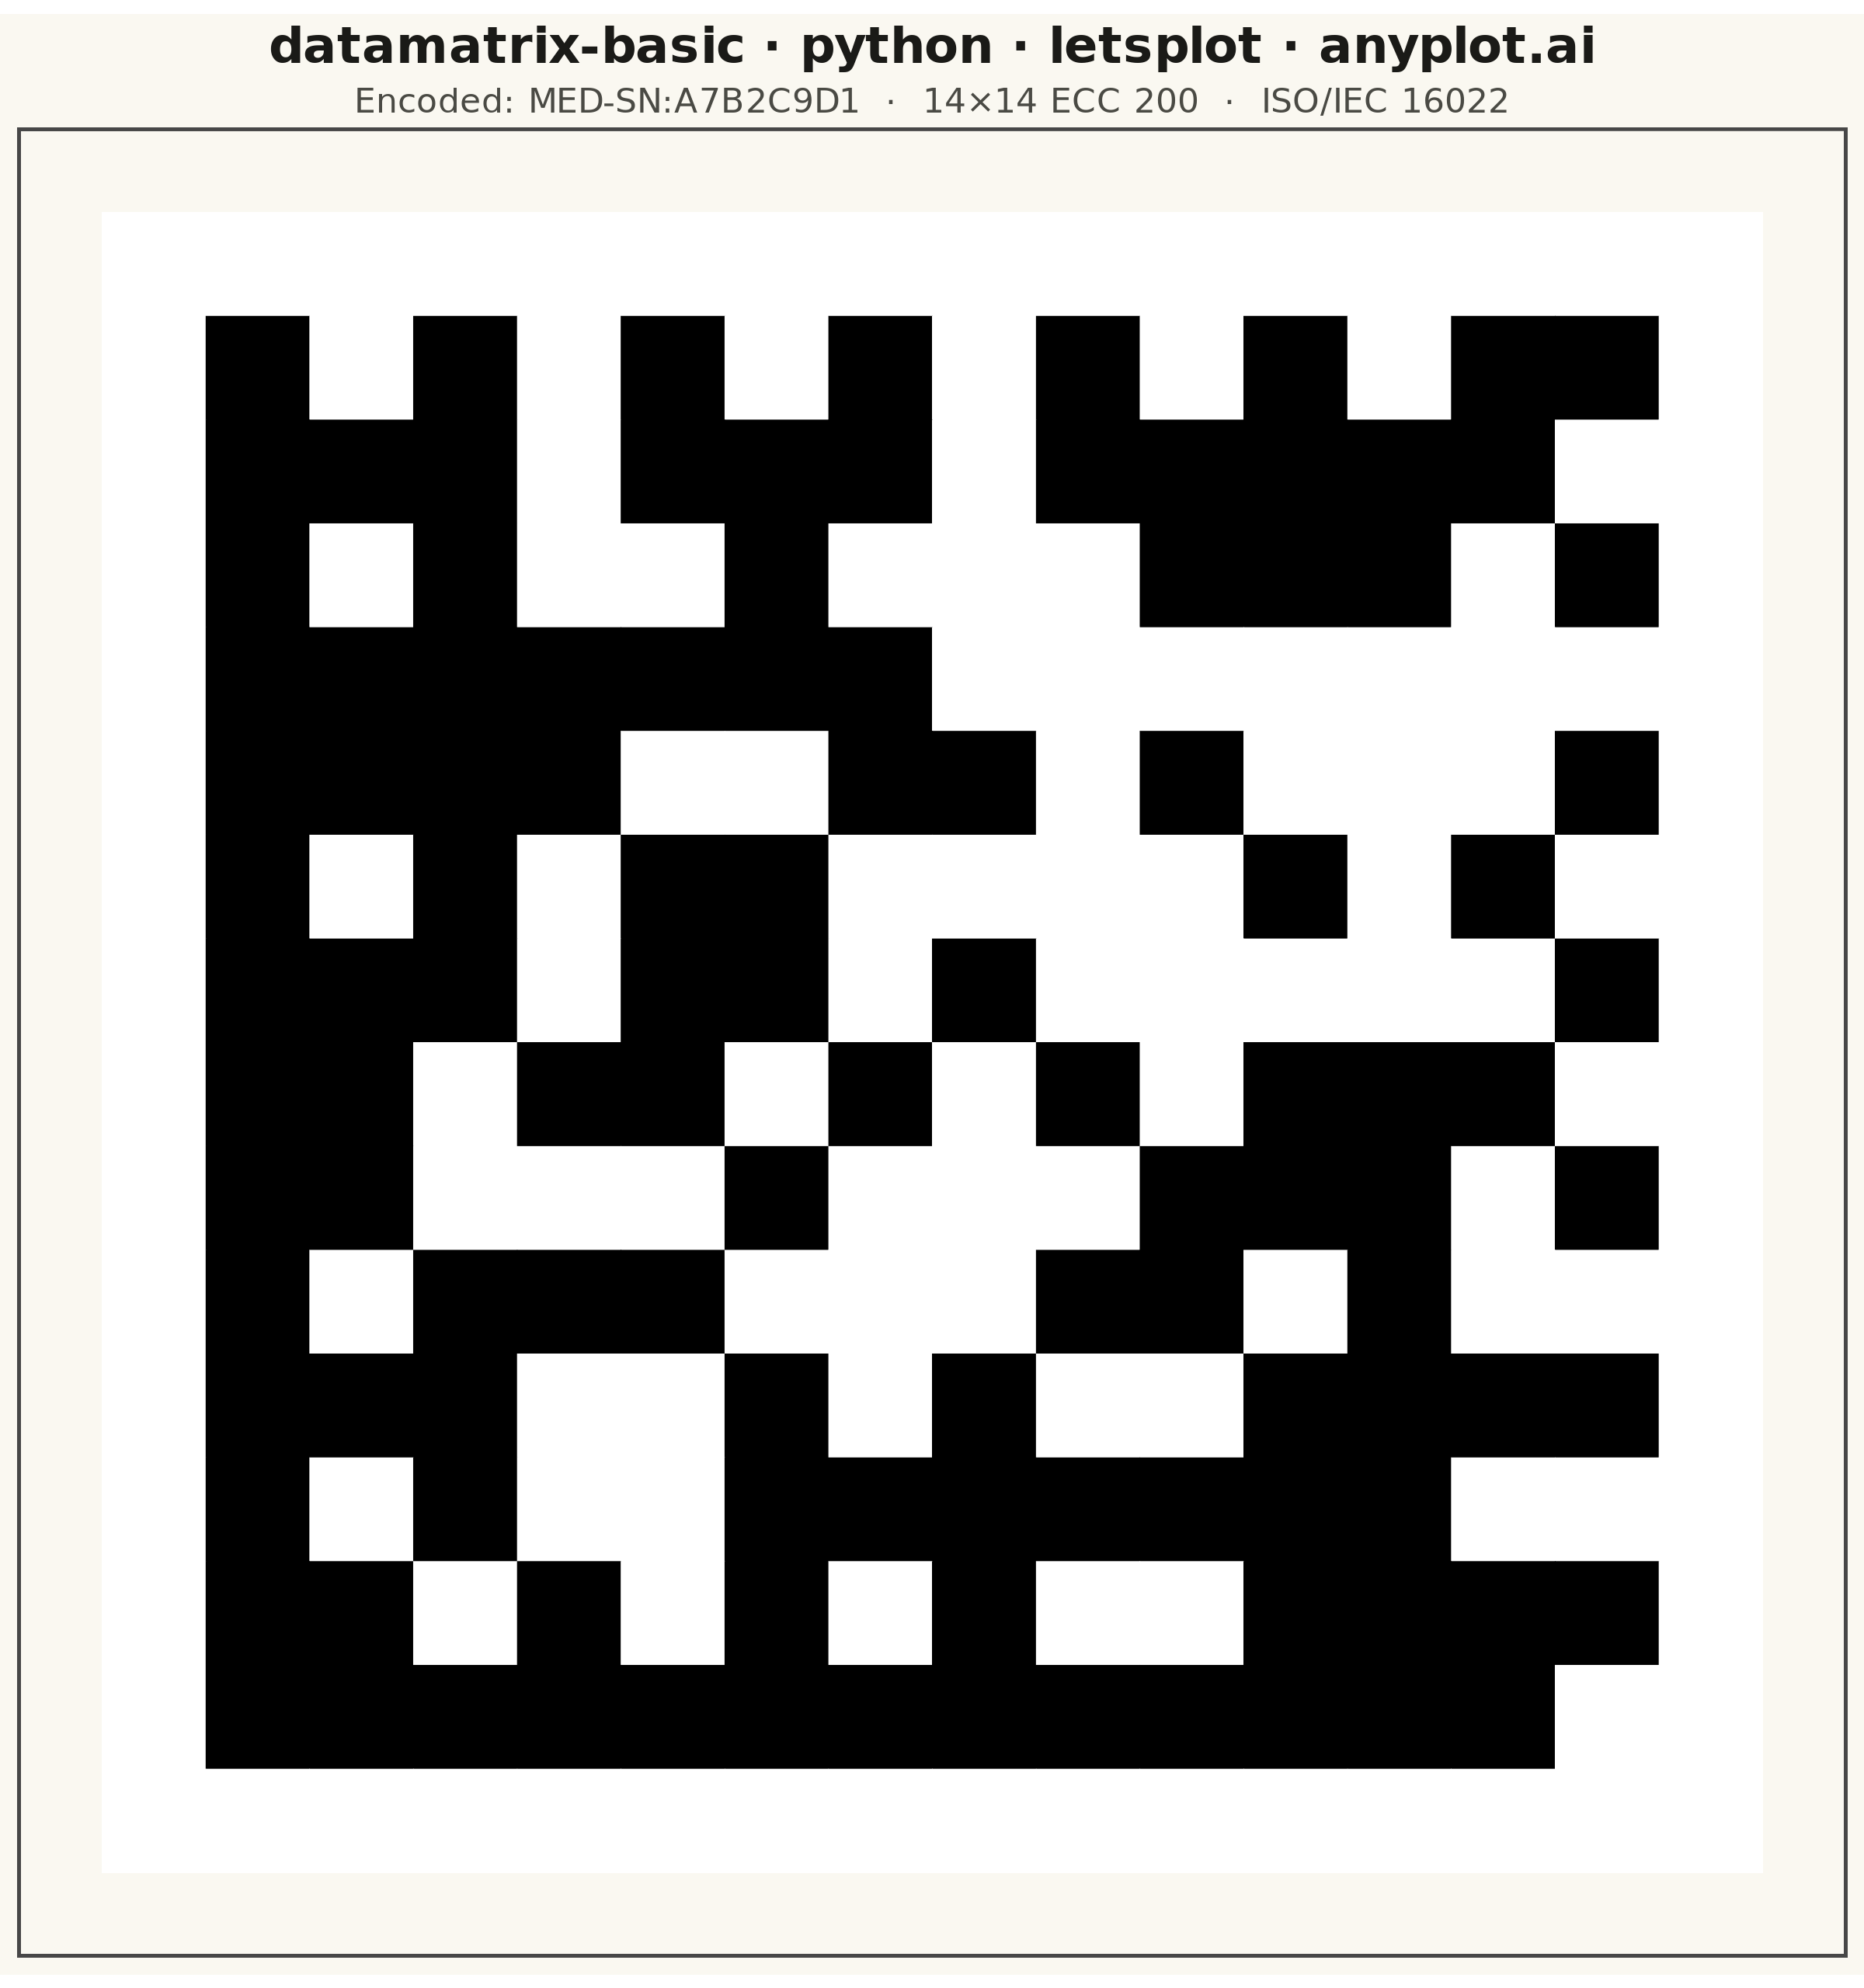
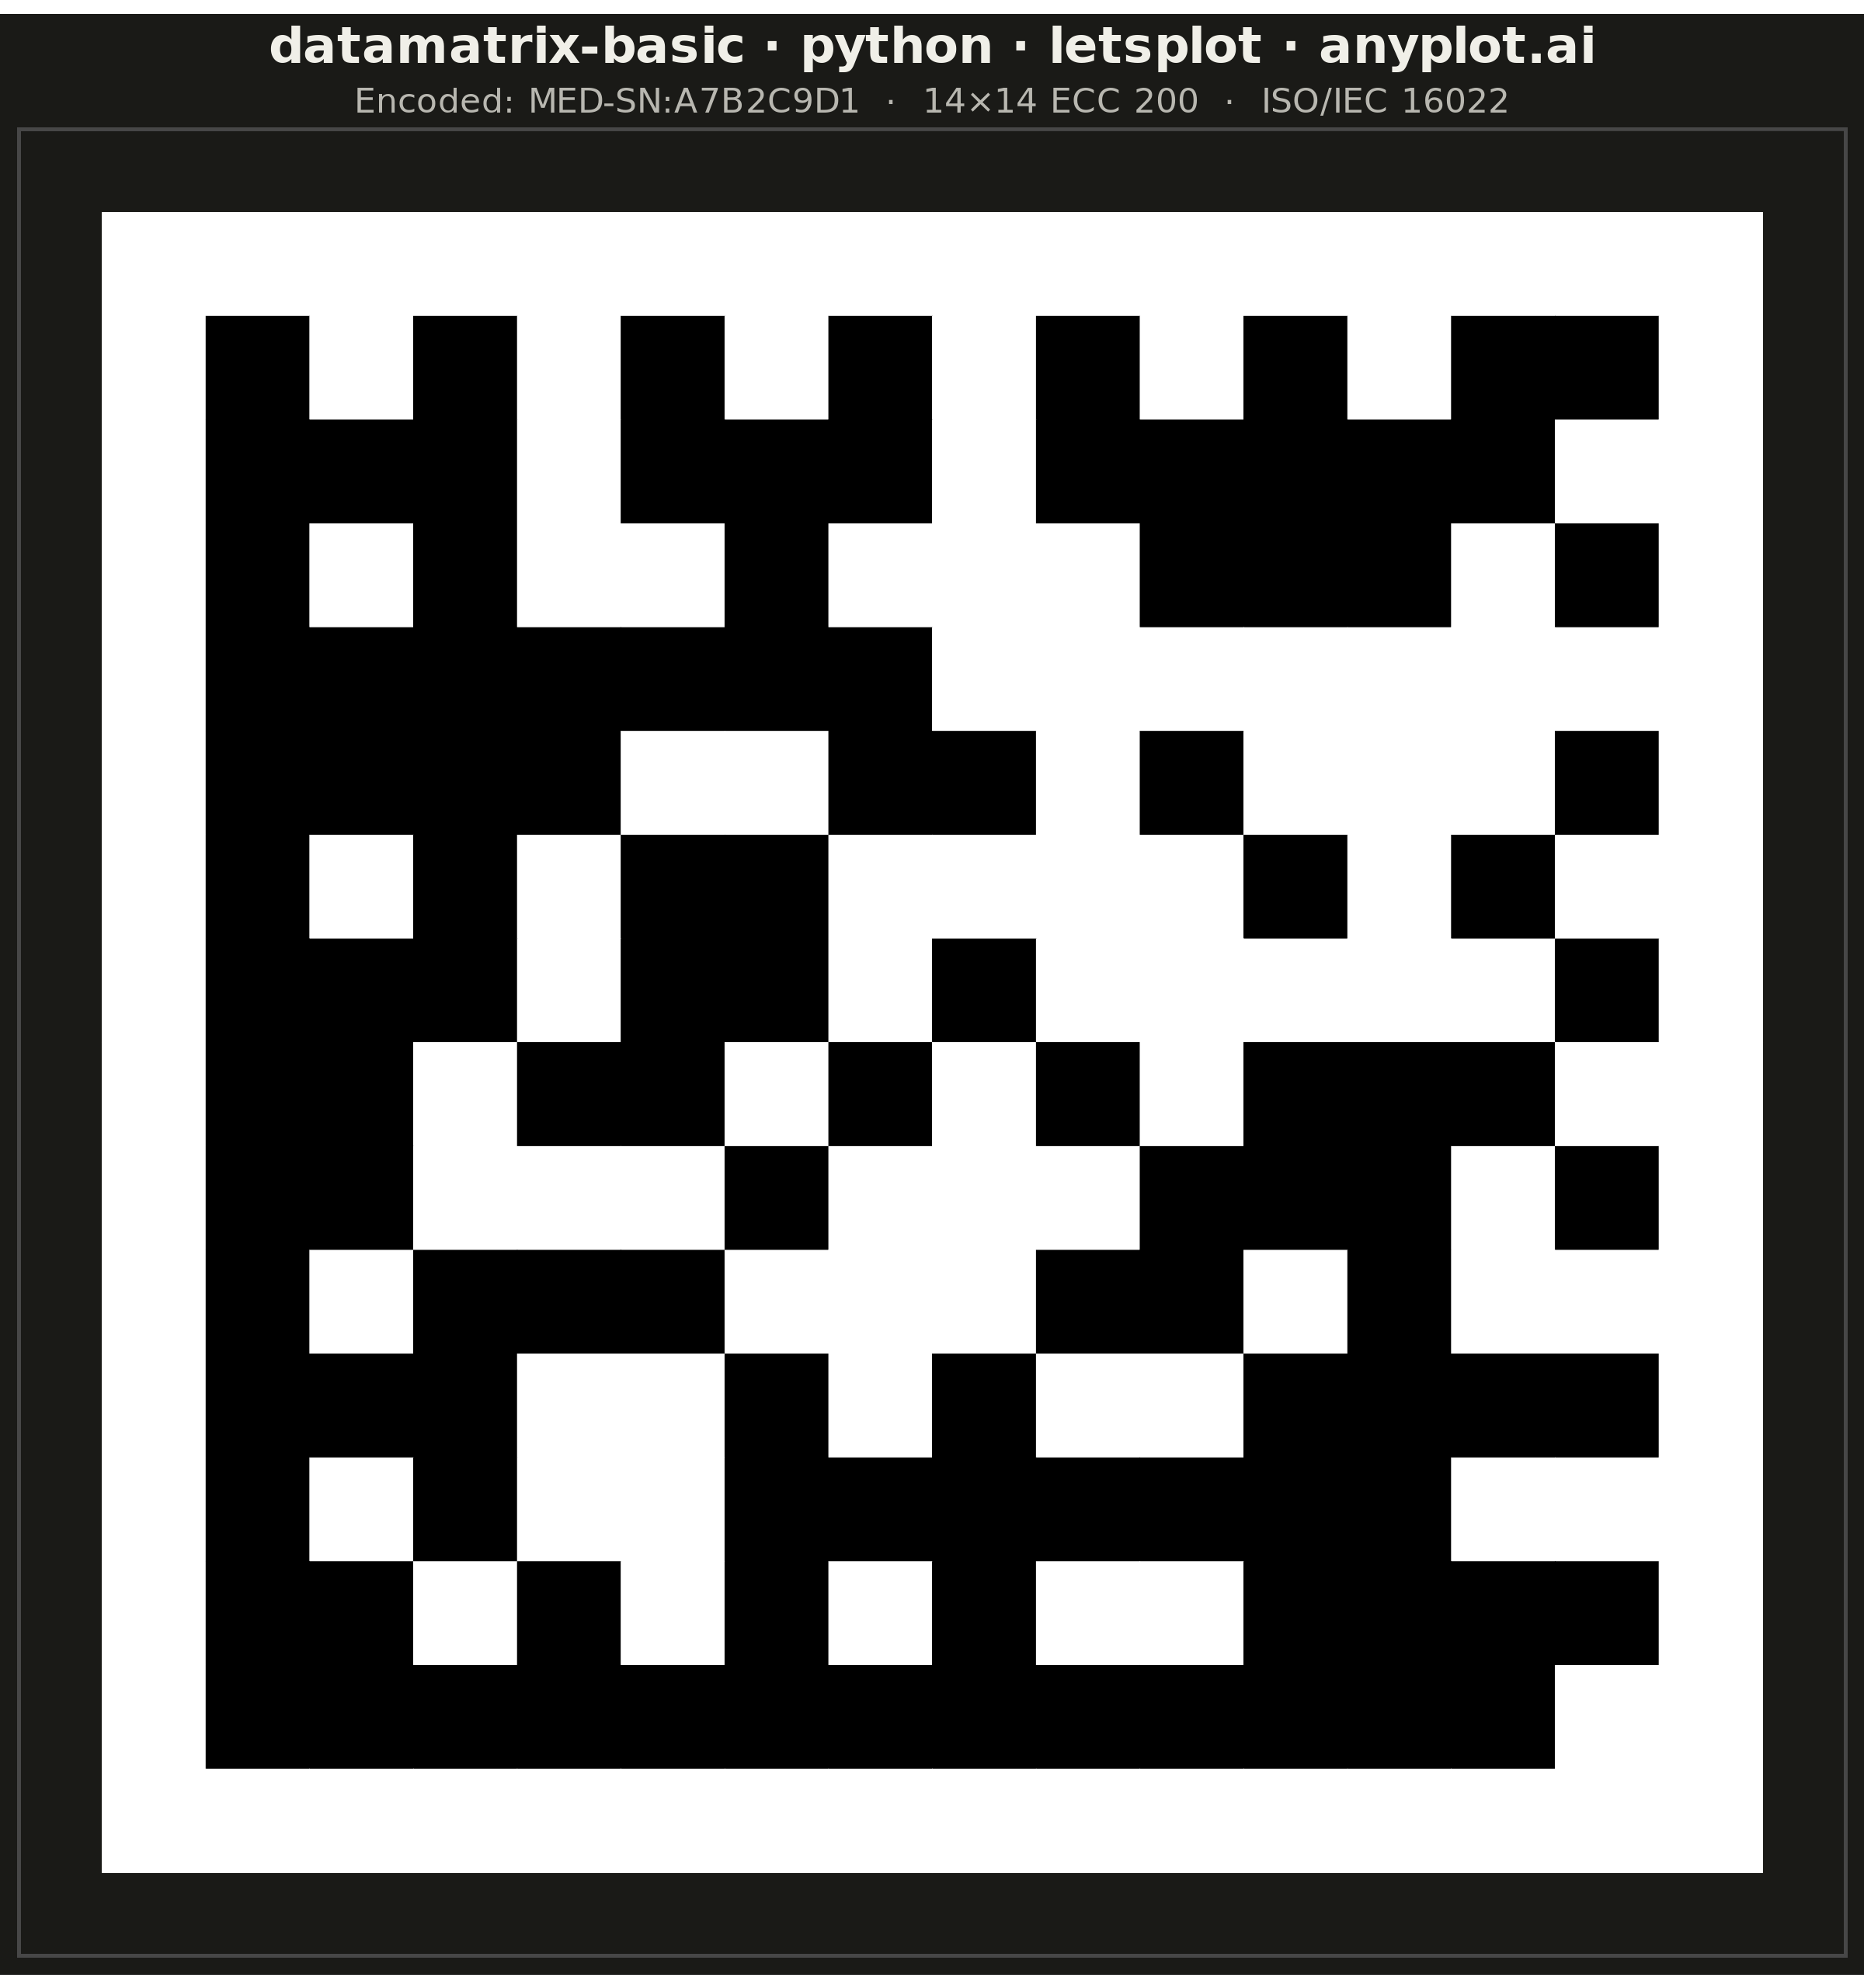
A Data Matrix 2D barcode visualization that encodes data into a compact square or rectangular matrix of black and white cells. Data Matrix codes follow the ISO/IEC 16022 standard, featuring an L-shaped finder pattern (solid borders on two adjacent sides) and alternating timing patterns on the opposite sides. This barcode format is ideal for marking small items and supports high data density with built-in error correction (ECC 200).
""" anyplot.ai
datamatrix-basic: Basic Data Matrix 2D Barcode
Library: letsplot 4.9.0 | Python 3.13.13
Quality: 92/100 | Updated: 2026-05-20
"""

import os

import numpy as np
import pandas as pd
from lets_plot import (
    LetsPlot,
    aes,
    coord_fixed,
    element_rect,
    element_text,
    geom_tile,
    ggplot,
    ggsize,
    labs,
    layer_tooltips,
    scale_fill_manual,
    theme,
    theme_void,
)
from lets_plot.export import ggsave


LetsPlot.setup_html()

THEME = os.getenv("ANYPLOT_THEME", "light")
PAGE_BG = "#FAF8F1" if THEME == "light" else "#1A1A17"
INK = "#1A1A17" if THEME == "light" else "#F0EFE8"
INK_SOFT = "#4A4A44" if THEME == "light" else "#B8B7B0"

# Data Matrix encoding — 14×14 matrix (ISO/IEC 16022, ECC 200 structure)
size = 14
content = "MED-SN:A7B2C9D1"

matrix = np.zeros((size, size), dtype=int)

# L-shaped finder pattern: solid black on left column and bottom row
matrix[:, 0] = 1
matrix[-1, :] = 1

# Alternating clock pattern on top row and right column
matrix[0, :] = [1 if i % 2 == 0 else 0 for i in range(size)]
matrix[:, -1] = [1 if i % 2 == 0 else 0 for i in range(size)]

# Data region: pseudo-random fill seeded from content (simulating ECC 200 encoding)
data_hash = sum(ord(c) for c in content)
np.random.seed(data_hash)
for i in range(1, size - 1):
    for j in range(1, size - 1):
        matrix[i, j] = np.random.randint(0, 2)

# Quiet zone (1-module border per ISO/IEC 16022 spec)
quiet_zone = 1
full_size = size + 2 * quiet_zone
full_matrix = np.zeros((full_size, full_size), dtype=int)
full_matrix[quiet_zone : quiet_zone + size, quiet_zone : quiet_zone + size] = matrix

# Convert to long-form DataFrame — classify each cell by structural region for storytelling
rows = []
for i in range(full_size):
    for j in range(full_size):
        qi, qj = i - quiet_zone, j - quiet_zone
        if qi < 0 or qi >= size or qj < 0 or qj >= size:
            region = "Quiet Zone"
        elif qj == 0 or qi == size - 1:
            region = "Finder Pattern (L-shape)"
        elif qi == 0 or qj == size - 1:
            region = "Timing Pattern (alternating)"
        else:
            region = "Data Region (ECC 200)"
        rows.append({"x": j, "y": full_size - 1 - i, "value": int(full_matrix[i, j]), "region": region})

df = pd.DataFrame(rows)

# lets-plot interactive tooltip — hover reveals structural region; distinctive lets-plot feature
tooltips = layer_tooltips().line("@region").line("Encoded: " + content)

# Plot
plot = (
    ggplot(df, aes(x="x", y="y", fill="value"))
    + geom_tile(tooltips=tooltips)
    + scale_fill_manual(values=["#FFFFFF", "#000000"])
    + coord_fixed()
    + labs(
        title="datamatrix-basic · python · letsplot · anyplot.ai",
        subtitle=f"Encoded: {content}  ·  14×14 ECC 200  ·  ISO/IEC 16022",
    )
    + theme_void()
    + theme(
        plot_background=element_rect(fill=PAGE_BG, color=PAGE_BG),
        panel_background=element_rect(fill=PAGE_BG),
        plot_title=element_text(size=16, face="bold", hjust=0.5, color=INK),
        plot_subtitle=element_text(size=11, hjust=0.5, color=INK_SOFT),
        legend_position="none",
    )
    + ggsize(600, 640)
)

# Save
ggsave(plot, f"plot-{THEME}.png", path=".", scale=4)
ggsave(plot, f"plot-{THEME}.html", path=".")
Runnable source as JSON, for any HTTP client: https://api.anyplot.ai/specs/datamatrix-basic/letsplot/code. Any spec id and library id listed in llms-full.txt fit the same URL shape; every URL below is complete and callable.
{
  "spec_id": "datamatrix-basic",
  "language": "python",
  "library": "letsplot",
  "page": "https://anyplot.ai/datamatrix-basic/python/letsplot",
  "hub": "https://anyplot.ai/datamatrix-basic",
  "code_json": "https://api.anyplot.ai/specs/datamatrix-basic/letsplot/code",
  "spec_json": "https://api.anyplot.ai/specs/datamatrix-basic",
  "render_light_png": "https://storage.googleapis.com/anyplot-images/plots/datamatrix-basic/python/letsplot/plot-light.png",
  "render_dark_png": "https://storage.googleapis.com/anyplot-images/plots/datamatrix-basic/python/letsplot/plot-dark.png",
  "interactive_light_html": "https://storage.googleapis.com/anyplot-images/plots/datamatrix-basic/python/letsplot/plot-light.html",
  "interactive_dark_html": "https://storage.googleapis.com/anyplot-images/plots/datamatrix-basic/python/letsplot/plot-dark.html",
  "quality_score": 92.0,
  "license": "MIT",
  "guide": "https://anyplot.ai/llms.txt"
}
Part of Basic Data Matrix 2D Barcode on anyplot.ai.