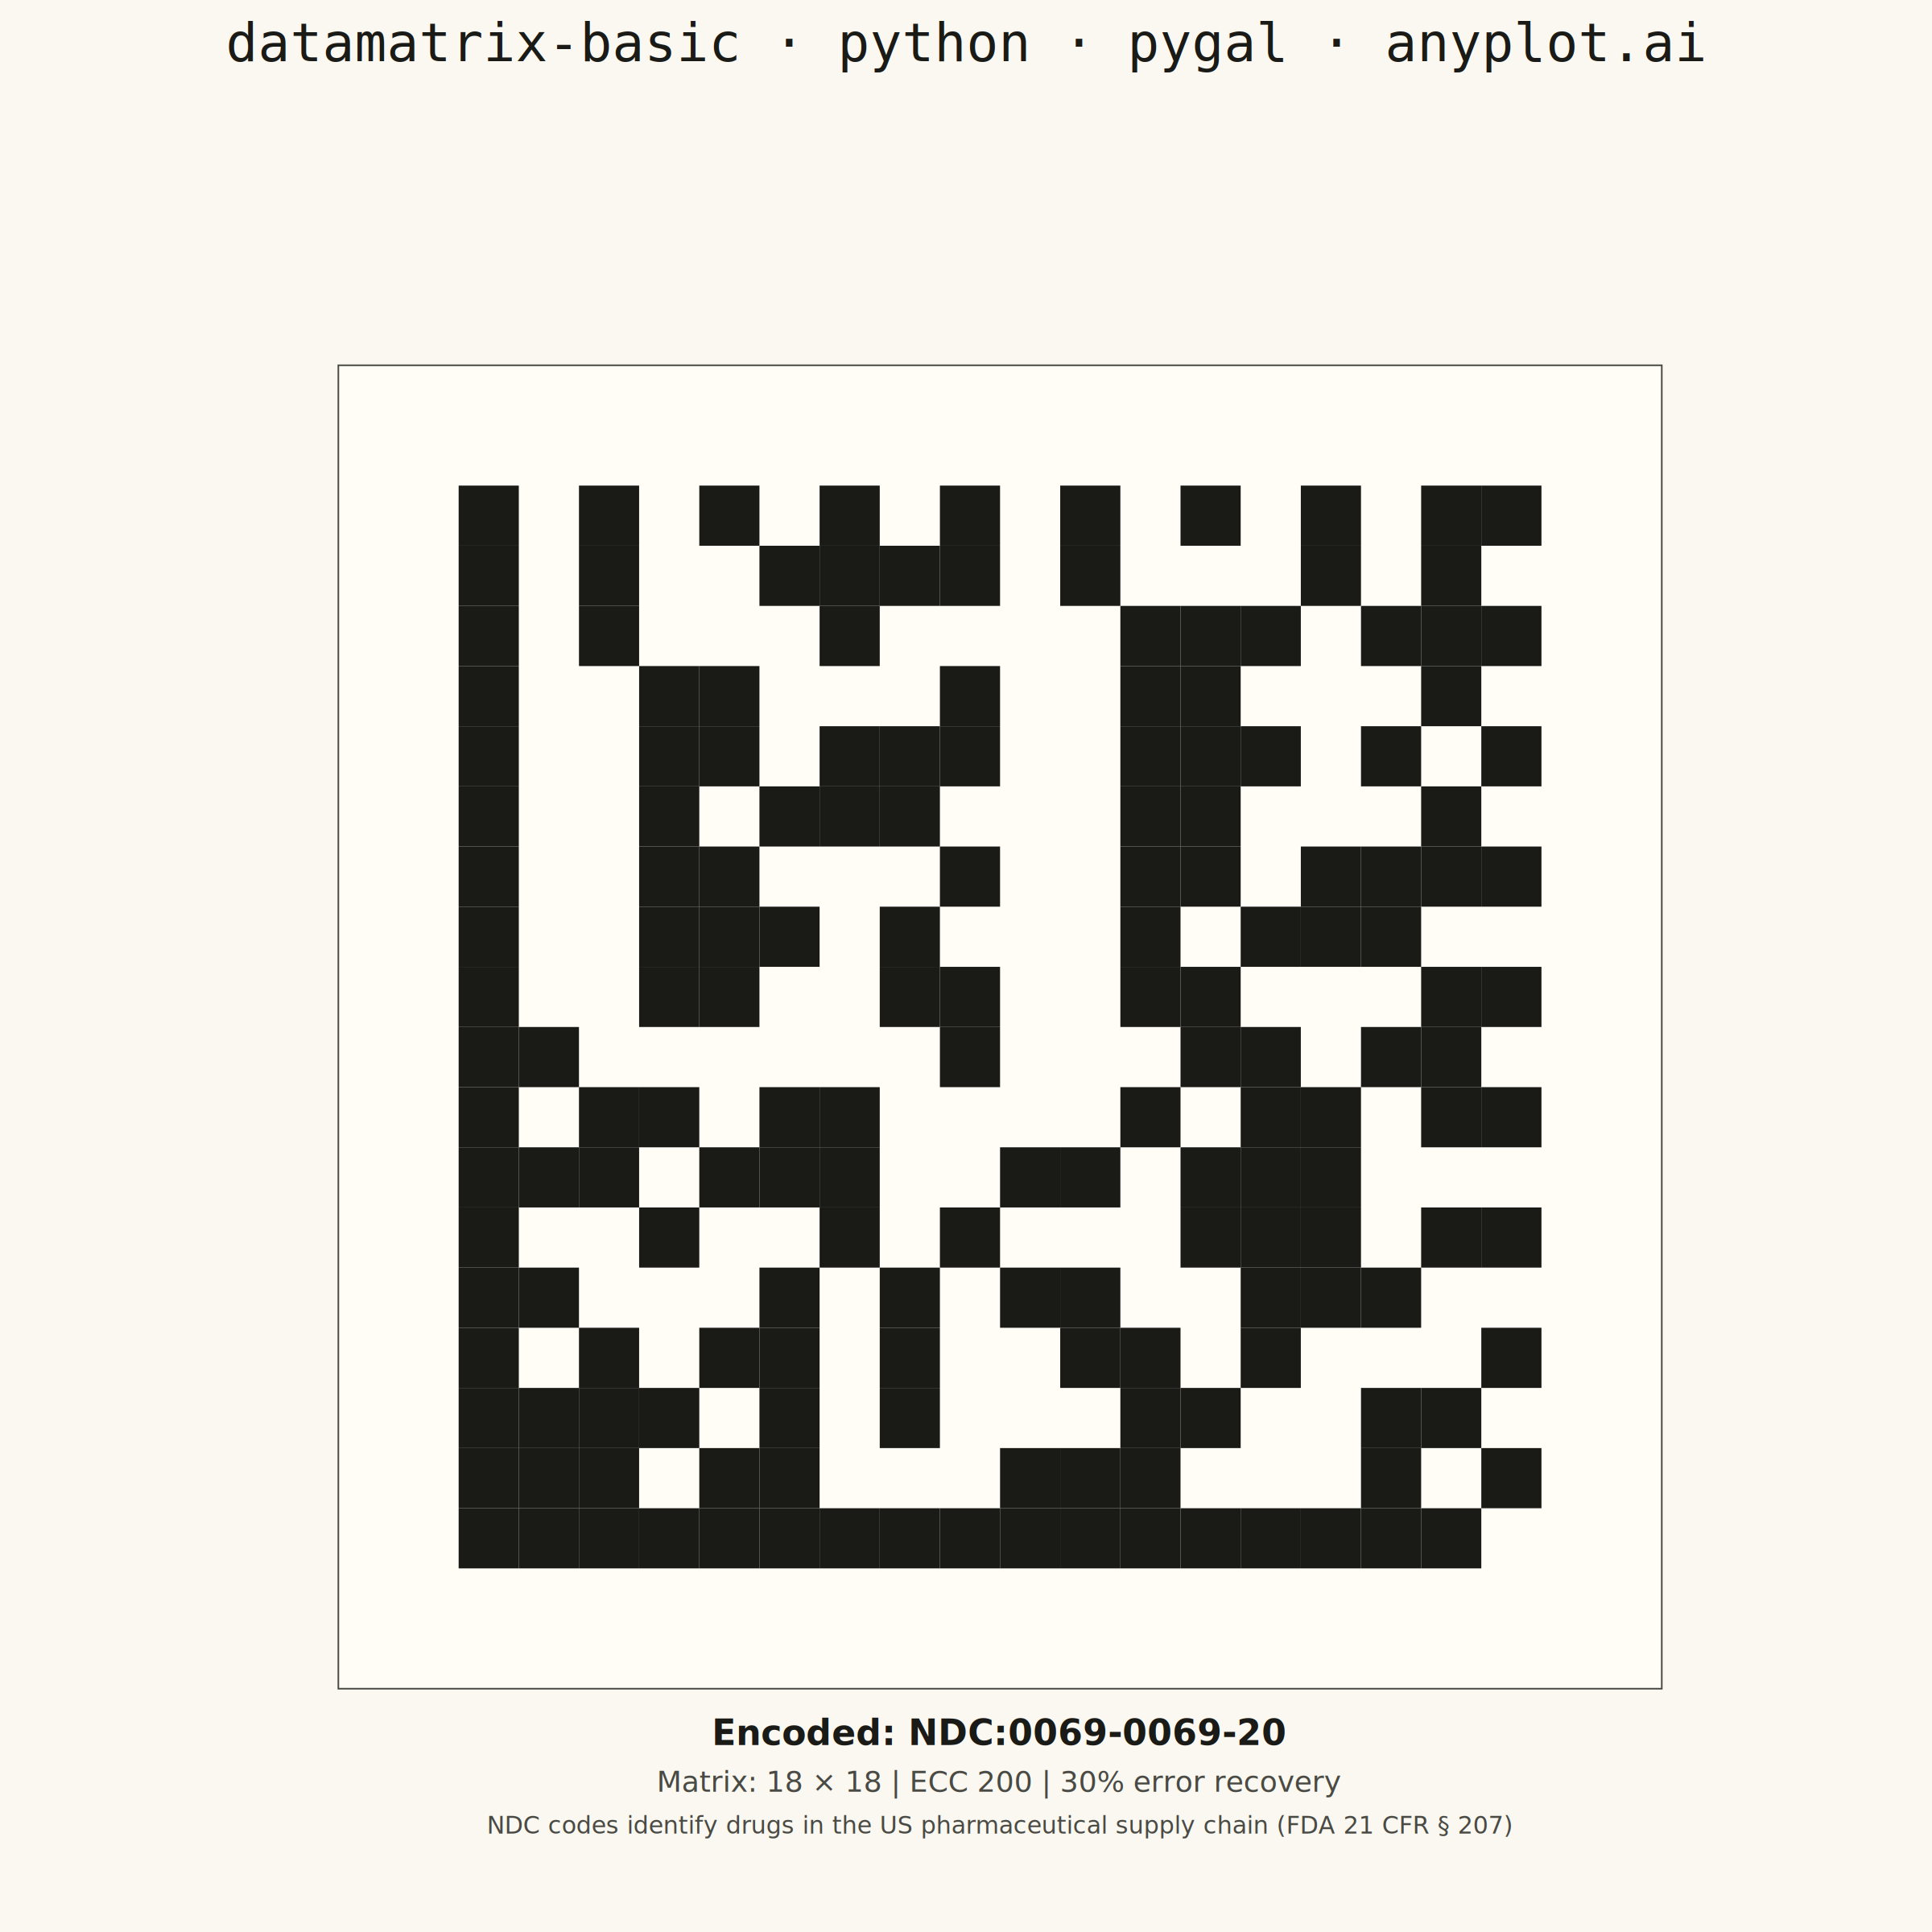
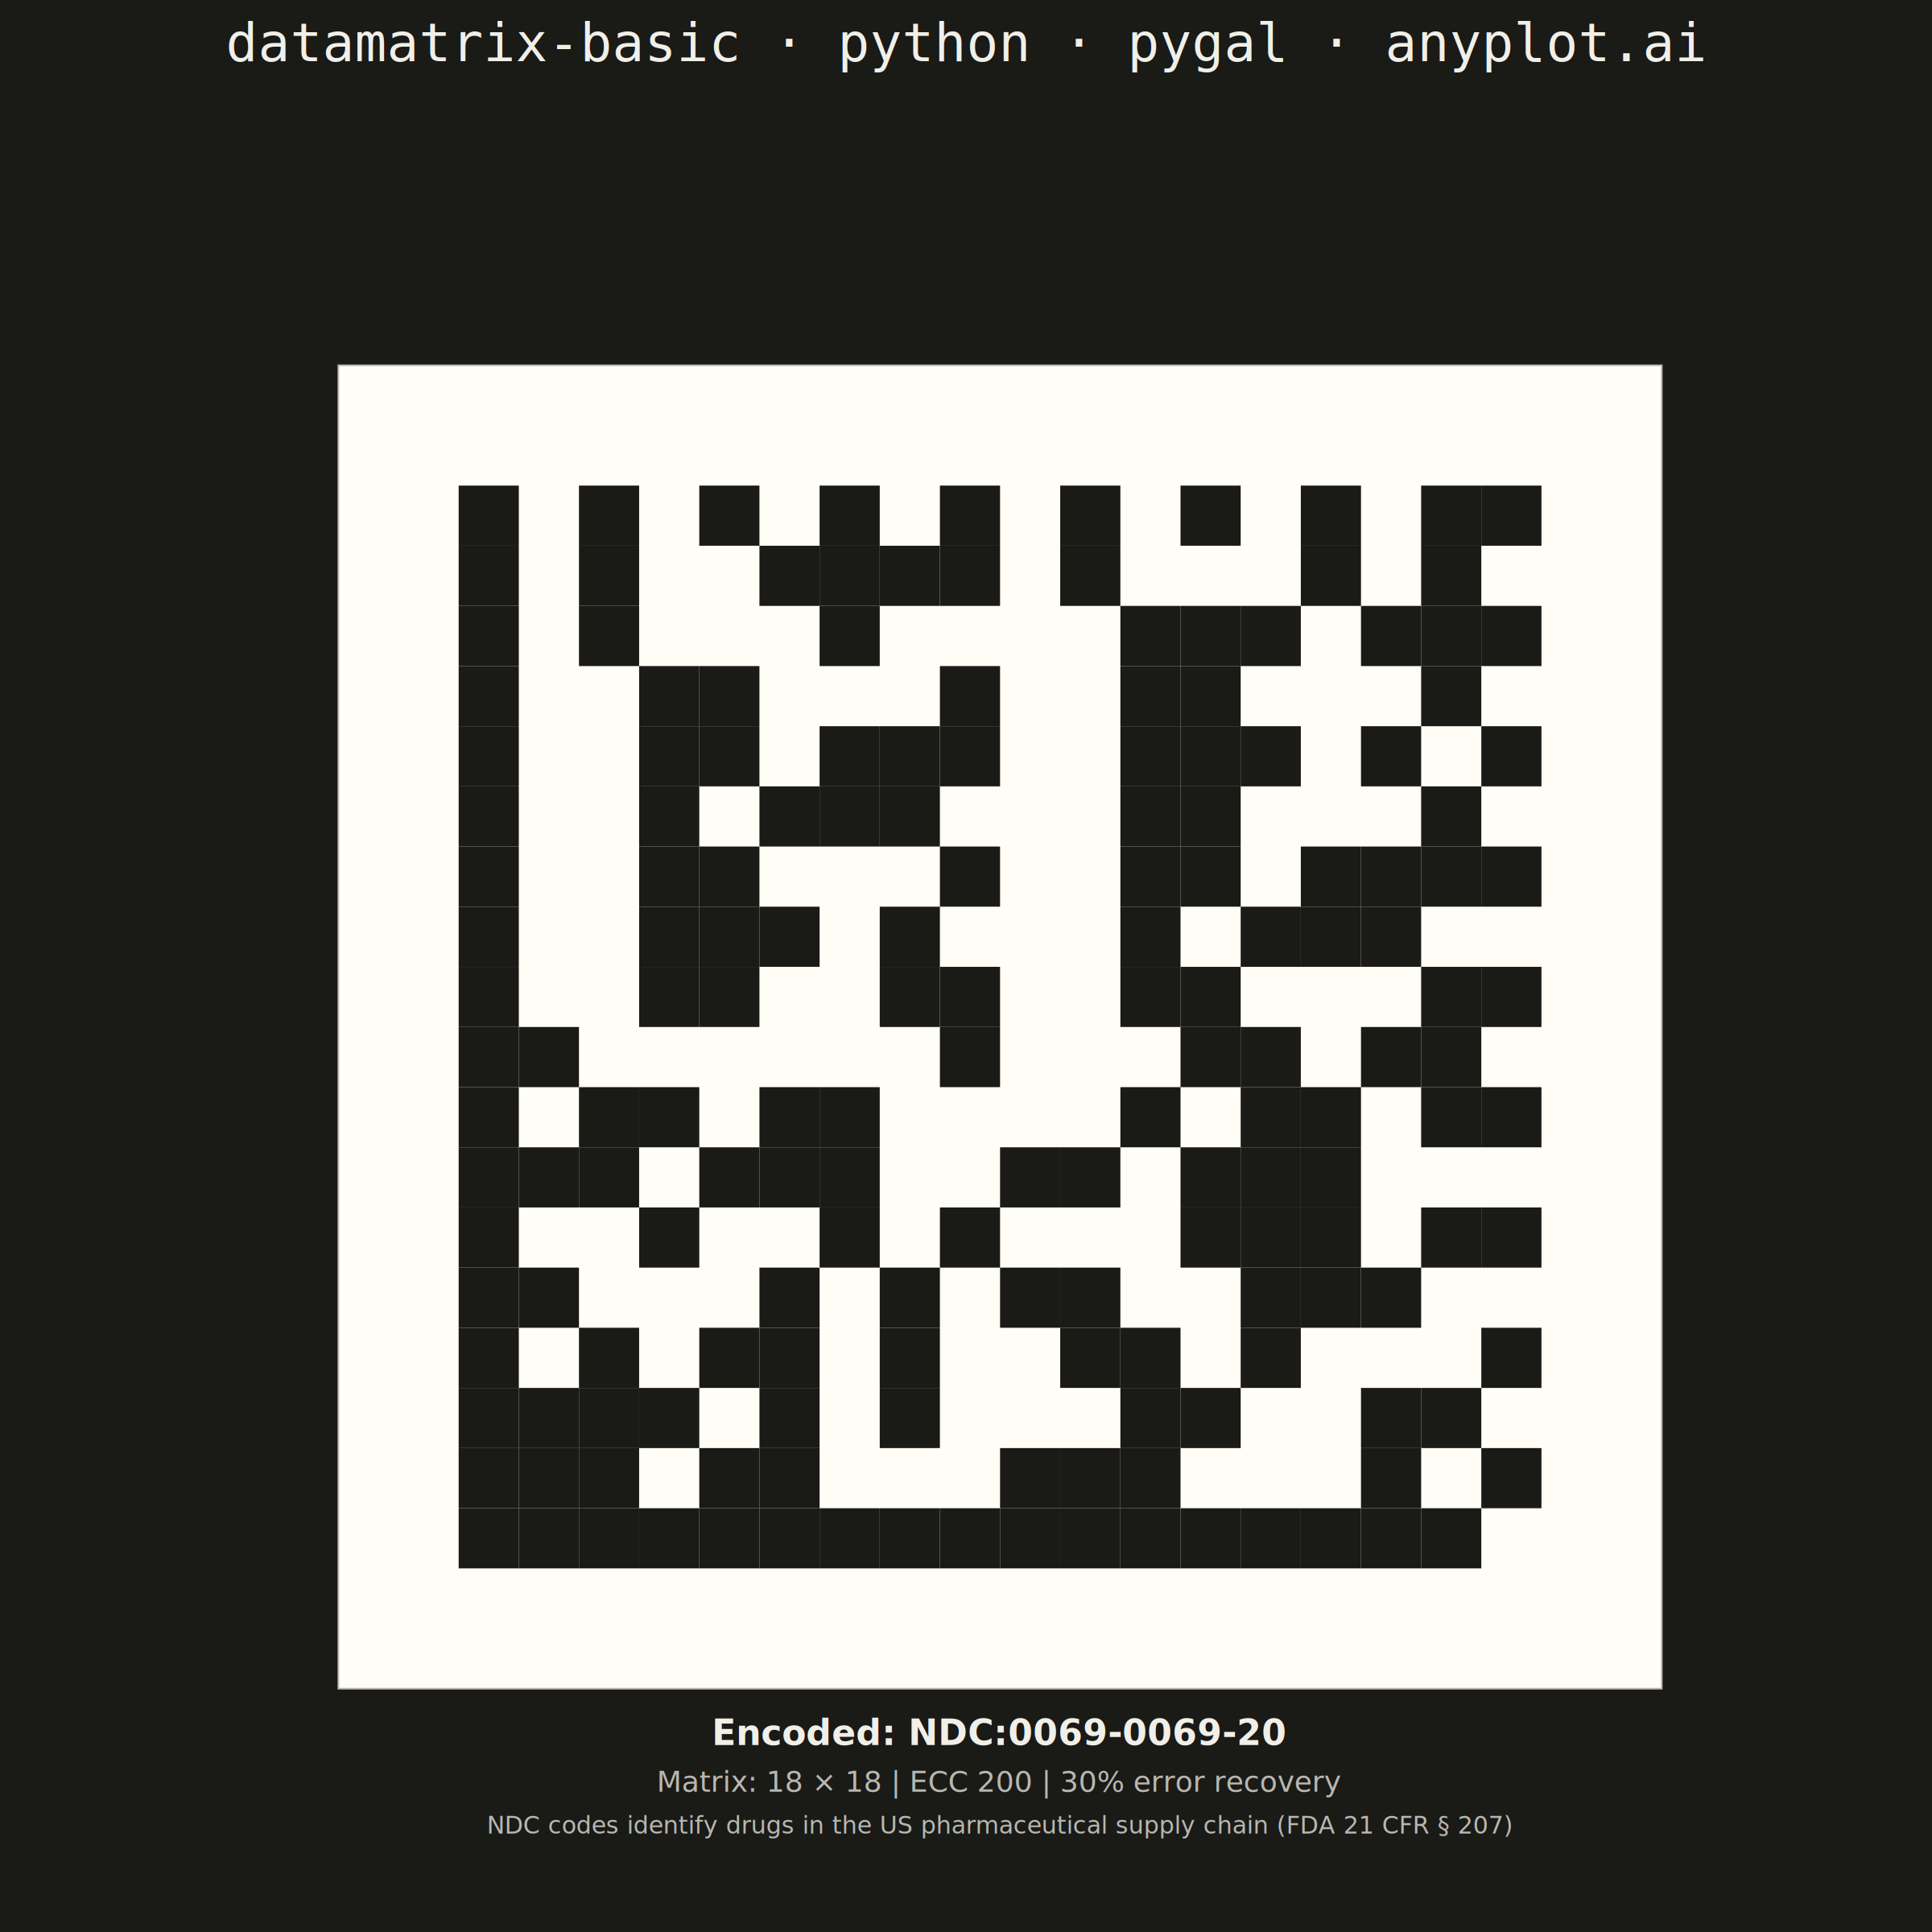
A Data Matrix 2D barcode visualization that encodes data into a compact square or rectangular matrix of black and white cells. Data Matrix codes follow the ISO/IEC 16022 standard, featuring an L-shaped finder pattern (solid borders on two adjacent sides) and alternating timing patterns on the opposite sides. This barcode format is ideal for marking small items and supports high data density with built-in error correction (ECC 200).
""" anyplot.ai
datamatrix-basic: Basic Data Matrix 2D Barcode
Library: pygal 3.1.0 | Python 3.13.13
Quality: 82/100 | Updated: 2026-05-20
"""

import os
import sys

import cairosvg
import numpy as np


# This file is named pygal.py, which shadows the installed package.
# Temporarily remove the script directory from sys.path so the real package loads.
_script_dir = os.path.dirname(os.path.abspath(__file__))
_removed = [p for p in list(sys.path) if p in ("", ".") or os.path.abspath(p) == _script_dir]
for _p in _removed:
    sys.path.remove(_p)

try:
    from pygal.graph.graph import Graph
    from pygal.style import Style
finally:
    for _p in _removed:
        sys.path.insert(0, _p)


# Theme tokens
THEME = os.getenv("ANYPLOT_THEME", "light")
PAGE_BG = "#FAF8F1" if THEME == "light" else "#1A1A17"
INK = "#1A1A17" if THEME == "light" else "#F0EFE8"
INK_SOFT = "#4A4A44" if THEME == "light" else "#B8B7B0"
IMPRINT = ("#009E73", "#C475FD", "#4467A3", "#BD8233", "#AE3030", "#2ABCCD", "#954477")

# Data Matrix ECC 200 — symbol sizes: (rows, cols, data_codewords, ec_codewords)
SYMBOL_SIZES = [
    (10, 10, 3, 5),
    (12, 12, 5, 7),
    (14, 14, 8, 10),
    (16, 16, 12, 12),
    (18, 18, 18, 14),
    (20, 20, 22, 18),
    (22, 22, 30, 20),
    (24, 24, 36, 24),
    (26, 26, 44, 28),
]

# Galois field GF(256) tables — polynomial 0x12D (Data Matrix standard)
GF_EXP = [0] * 512
GF_LOG = [0] * 256
_x = 1
for _i in range(255):
    GF_EXP[_i] = _x
    GF_LOG[_x] = _i
    _x <<= 1
    if _x & 0x100:
        _x ^= 0x12D
for _i in range(255, 512):
    GF_EXP[_i] = GF_EXP[_i - 255]


def gf_mul(a, b):
    if a == 0 or b == 0:
        return 0
    return GF_EXP[(GF_LOG[a % 256] + GF_LOG[b % 256]) % 255]


def rs_encode(data, num_ec):
    data = [d % 256 for d in data]
    g = [1]
    for i in range(num_ec):
        new_g = [0] * (len(g) + 1)
        for j in range(len(g)):
            new_g[j] ^= gf_mul(g[j], GF_EXP[i])
            new_g[j + 1] ^= g[j]
        g = new_g
    encoded = list(data) + [0] * num_ec
    for i in range(len(data)):
        coef = encoded[i]
        if coef != 0:
            for j in range(len(g)):
                encoded[i + j] ^= gf_mul(g[j], coef)
    return encoded[len(data) :]


def generate_datamatrix(content):
    # ASCII encoding: each char → ordinal + 1
    codewords = [ord(c) + 1 for c in content if 0 <= ord(c) <= 127]

    # Select smallest fitting symbol size
    rows, cols, data_cap, ec_count = next((s for s in SYMBOL_SIZES if len(codewords) <= s[2]), SYMBOL_SIZES[-1])

    # Pad codewords to fill data capacity
    if len(codewords) < data_cap:
        codewords.append(129)
    while len(codewords) < data_cap:
        pad = 130 + (((149 * (len(codewords) + 1)) % 253) + 1) % 254
        codewords.append(pad)
    codewords = codewords[:data_cap]

    # Compute error correction and build full codeword stream
    all_codewords = codewords + rs_encode(codewords, ec_count)

    # Initialise matrix
    matrix = np.zeros((rows, cols), dtype=int)

    # L-shaped finder pattern: solid left column + solid bottom row
    matrix[:, 0] = 1
    matrix[rows - 1, :] = 1

    # Alternating timing patterns: top row and right column
    matrix[0, :] = np.arange(cols) % 2 == 0
    matrix[:, cols - 1] = np.arange(rows) % 2 == 0

    # Place data bits in the interior (column-major diagonal)
    data_rows, data_cols = rows - 2, cols - 2
    placed = np.zeros((data_rows, data_cols), dtype=bool)
    bit_idx = 0
    total_bits = len(all_codewords) * 8
    for module_num in range(data_rows * data_cols):
        if bit_idx >= total_bits:
            break
        r, c = module_num // data_cols, module_num % data_cols
        if not placed[r, c]:
            cw_idx, bit_pos = bit_idx // 8, 7 - (bit_idx % 8)
            if cw_idx < len(all_codewords):
                bit_value = (all_codewords[cw_idx] >> bit_pos) & 1
                ar, ac = r + 1, c + 1
                if 0 < ar < rows - 1 and 0 < ac < cols - 1:
                    matrix[ar, ac] = bit_value
            placed[r, c] = True
            bit_idx += 1

    return matrix


class DataMatrixChart(Graph):
    def __init__(self, *args, **kwargs):
        self.dm_data = kwargs.pop("dm_data", "ANYPLOT")
        self.module_color = kwargs.pop("module_color", "#1A1A17")
        self.cell_bg = kwargs.pop("cell_bg", "#FFFDF6")
        self.ink_color = kwargs.pop("ink_color", "#1A1A17")
        self.ink_soft_color = kwargs.pop("ink_soft_color", "#4A4A44")
        self.quiet_zone = kwargs.pop("quiet_zone", 2)
        super().__init__(*args, **kwargs)
        self._dm_matrix = None

    def _plot(self):
        self._dm_matrix = generate_datamatrix(self.dm_data)
        matrix_rows, matrix_cols = self._dm_matrix.shape
        total_rows = matrix_rows + 2 * self.quiet_zone
        total_cols = matrix_cols + 2 * self.quiet_zone

        plot_width = self.view.width
        plot_height = self.view.height
        margin = 160
        available_size = min(plot_width, plot_height) - 2 * margin
        cell_size = available_size / max(total_rows, total_cols)

        dm_width = total_cols * cell_size
        dm_height = total_rows * cell_size
        x_offset = self.view.x(0) + (plot_width - dm_width) / 2
        # Center vertically within the plot area
        y_offset = self.view.y(total_rows) + (plot_height - dm_height) / 2

        plot_node = self.nodes["plot"]
        dm_group = self.svg.node(plot_node, class_="datamatrix")

        # Barcode area background (always light for reliable scan contrast)
        bg_rect = self.svg.node(dm_group, "rect", x=x_offset, y=y_offset, width=dm_width, height=dm_height)
        bg_rect.set("fill", self.cell_bg)
        bg_rect.set("stroke", self.ink_soft_color)
        bg_rect.set("stroke-width", "2")

        # Draw filled modules
        for row in range(matrix_rows):
            for col in range(matrix_cols):
                if self._dm_matrix[row, col]:
                    x = x_offset + (col + self.quiet_zone) * cell_size
                    y = y_offset + (row + self.quiet_zone) * cell_size
                    rect = self.svg.node(dm_group, "rect", x=x, y=y, width=cell_size, height=cell_size)
                    rect.set("fill", self.module_color)

        # Labels below the barcode: encoded content, matrix spec, and context
        label_y = y_offset + dm_height + 70
        label_x = x_offset + dm_width / 2

        content_node = self.svg.node(dm_group, "text", x=label_x, y=label_y)
        content_node.set("text-anchor", "middle")
        content_node.set("fill", self.ink_color)
        content_node.set("style", "font-size:44px;font-weight:bold;font-family:sans-serif")
        content_node.text = f"Encoded: {self.dm_data}"

        info_node = self.svg.node(dm_group, "text", x=label_x, y=label_y + 58)
        info_node.set("text-anchor", "middle")
        info_node.set("fill", self.ink_soft_color)
        info_node.set("style", "font-size:36px;font-family:sans-serif")
        info_node.text = f"Matrix: {matrix_rows} × {matrix_cols} | ECC 200 | 30% error recovery"

        # Storytelling annotation: explains real-world significance
        story_node = self.svg.node(dm_group, "text", x=label_x, y=label_y + 110)
        story_node.set("text-anchor", "middle")
        story_node.set("fill", self.ink_soft_color)
        story_node.set("style", "font-size:30px;font-style:italic;font-family:sans-serif")
        story_node.text = "NDC codes identify drugs in the US pharmaceutical supply chain (FDA 21 CFR § 207)"

    def _compute(self):
        if self._dm_matrix is None:
            self._dm_matrix = generate_datamatrix(self.dm_data)
        matrix_rows, matrix_cols = self._dm_matrix.shape
        total_size = max(matrix_rows, matrix_cols) + 2 * self.quiet_zone
        self._box.xmin = 0
        self._box.xmax = total_size
        self._box.ymin = 0
        self._box.ymax = total_size


# Style
custom_style = Style(
    background=PAGE_BG,
    plot_background=PAGE_BG,
    foreground=INK,
    foreground_strong=INK,
    foreground_subtle=INK_SOFT,
    colors=IMPRINT,
    title_font_size=66,
    label_font_size=56,
    major_label_font_size=44,
    legend_font_size=44,
    value_font_size=36,
)

# Data — pharmaceutical NDC (National Drug Code) for drug authentication
dm_content = "NDC:0069-0069-20"

# Plot
chart = DataMatrixChart(
    width=2400,
    height=2400,
    style=custom_style,
    title="datamatrix-basic · python · pygal · anyplot.ai",
    dm_data=dm_content,
    module_color="#1A1A17",
    cell_bg="#FFFDF6",
    ink_color=INK,
    ink_soft_color=INK_SOFT,
    quiet_zone=2,
    show_legend=False,
    margin=100,
    margin_top=180,
    margin_bottom=180,
    show_x_labels=False,
    show_y_labels=False,
)

# Required: pygal's Graph._draw() only calls _plot() when series data is present
chart.add("", [0])

# Save
chart.render_to_file(f"plot-{THEME}.svg")
cairosvg.svg2png(url=f"plot-{THEME}.svg", write_to=f"plot-{THEME}.png", output_width=2400, output_height=2400)

svg_content = chart.render(is_unicode=True)
html_content = f"""<!DOCTYPE html>
<html>
<head>
    <meta charset="utf-8">
    <title>datamatrix-basic - python - pygal - anyplot.ai</title>
    <style>
        body {{
            margin: 0;
            display: flex;
            justify-content: center;
            align-items: center;
            min-height: 100vh;
            background: {PAGE_BG};
        }}
        .chart {{ max-width: 100%; height: auto; }}
    </style>
</head>
<body>
    <figure class="chart">
        {svg_content}
    </figure>
</body>
</html>
"""

with open(f"plot-{THEME}.html", "w", encoding="utf-8") as f:
    f.write(html_content)
Runnable source as JSON, for any HTTP client: https://api.anyplot.ai/specs/datamatrix-basic/pygal/code. Any spec id and library id listed in llms-full.txt fit the same URL shape; every URL below is complete and callable.
{
  "spec_id": "datamatrix-basic",
  "language": "python",
  "library": "pygal",
  "page": "https://anyplot.ai/datamatrix-basic/python/pygal",
  "hub": "https://anyplot.ai/datamatrix-basic",
  "code_json": "https://api.anyplot.ai/specs/datamatrix-basic/pygal/code",
  "spec_json": "https://api.anyplot.ai/specs/datamatrix-basic",
  "render_light_png": "https://storage.googleapis.com/anyplot-images/plots/datamatrix-basic/python/pygal/plot-light.png",
  "render_dark_png": "https://storage.googleapis.com/anyplot-images/plots/datamatrix-basic/python/pygal/plot-dark.png",
  "interactive_light_html": "https://storage.googleapis.com/anyplot-images/plots/datamatrix-basic/python/pygal/plot-light.html",
  "interactive_dark_html": "https://storage.googleapis.com/anyplot-images/plots/datamatrix-basic/python/pygal/plot-dark.html",
  "quality_score": 82.0,
  "license": "MIT",
  "guide": "https://anyplot.ai/llms.txt"
}
Part of Basic Data Matrix 2D Barcode on anyplot.ai.