The same plot in 14 other libraries — JavaScript: Chart.js, D3.js, Apache ECharts, Highcharts; Python: Altair, Bokeh, lets-plot, Matplotlib, Plotly, plotnine, Pygal, Seaborn; R: ggplot2; Julia: Makie.jl. Compare all 15 side by side: Basic Data Matrix 2D Barcode in Python, R, Julia and JavaScript.
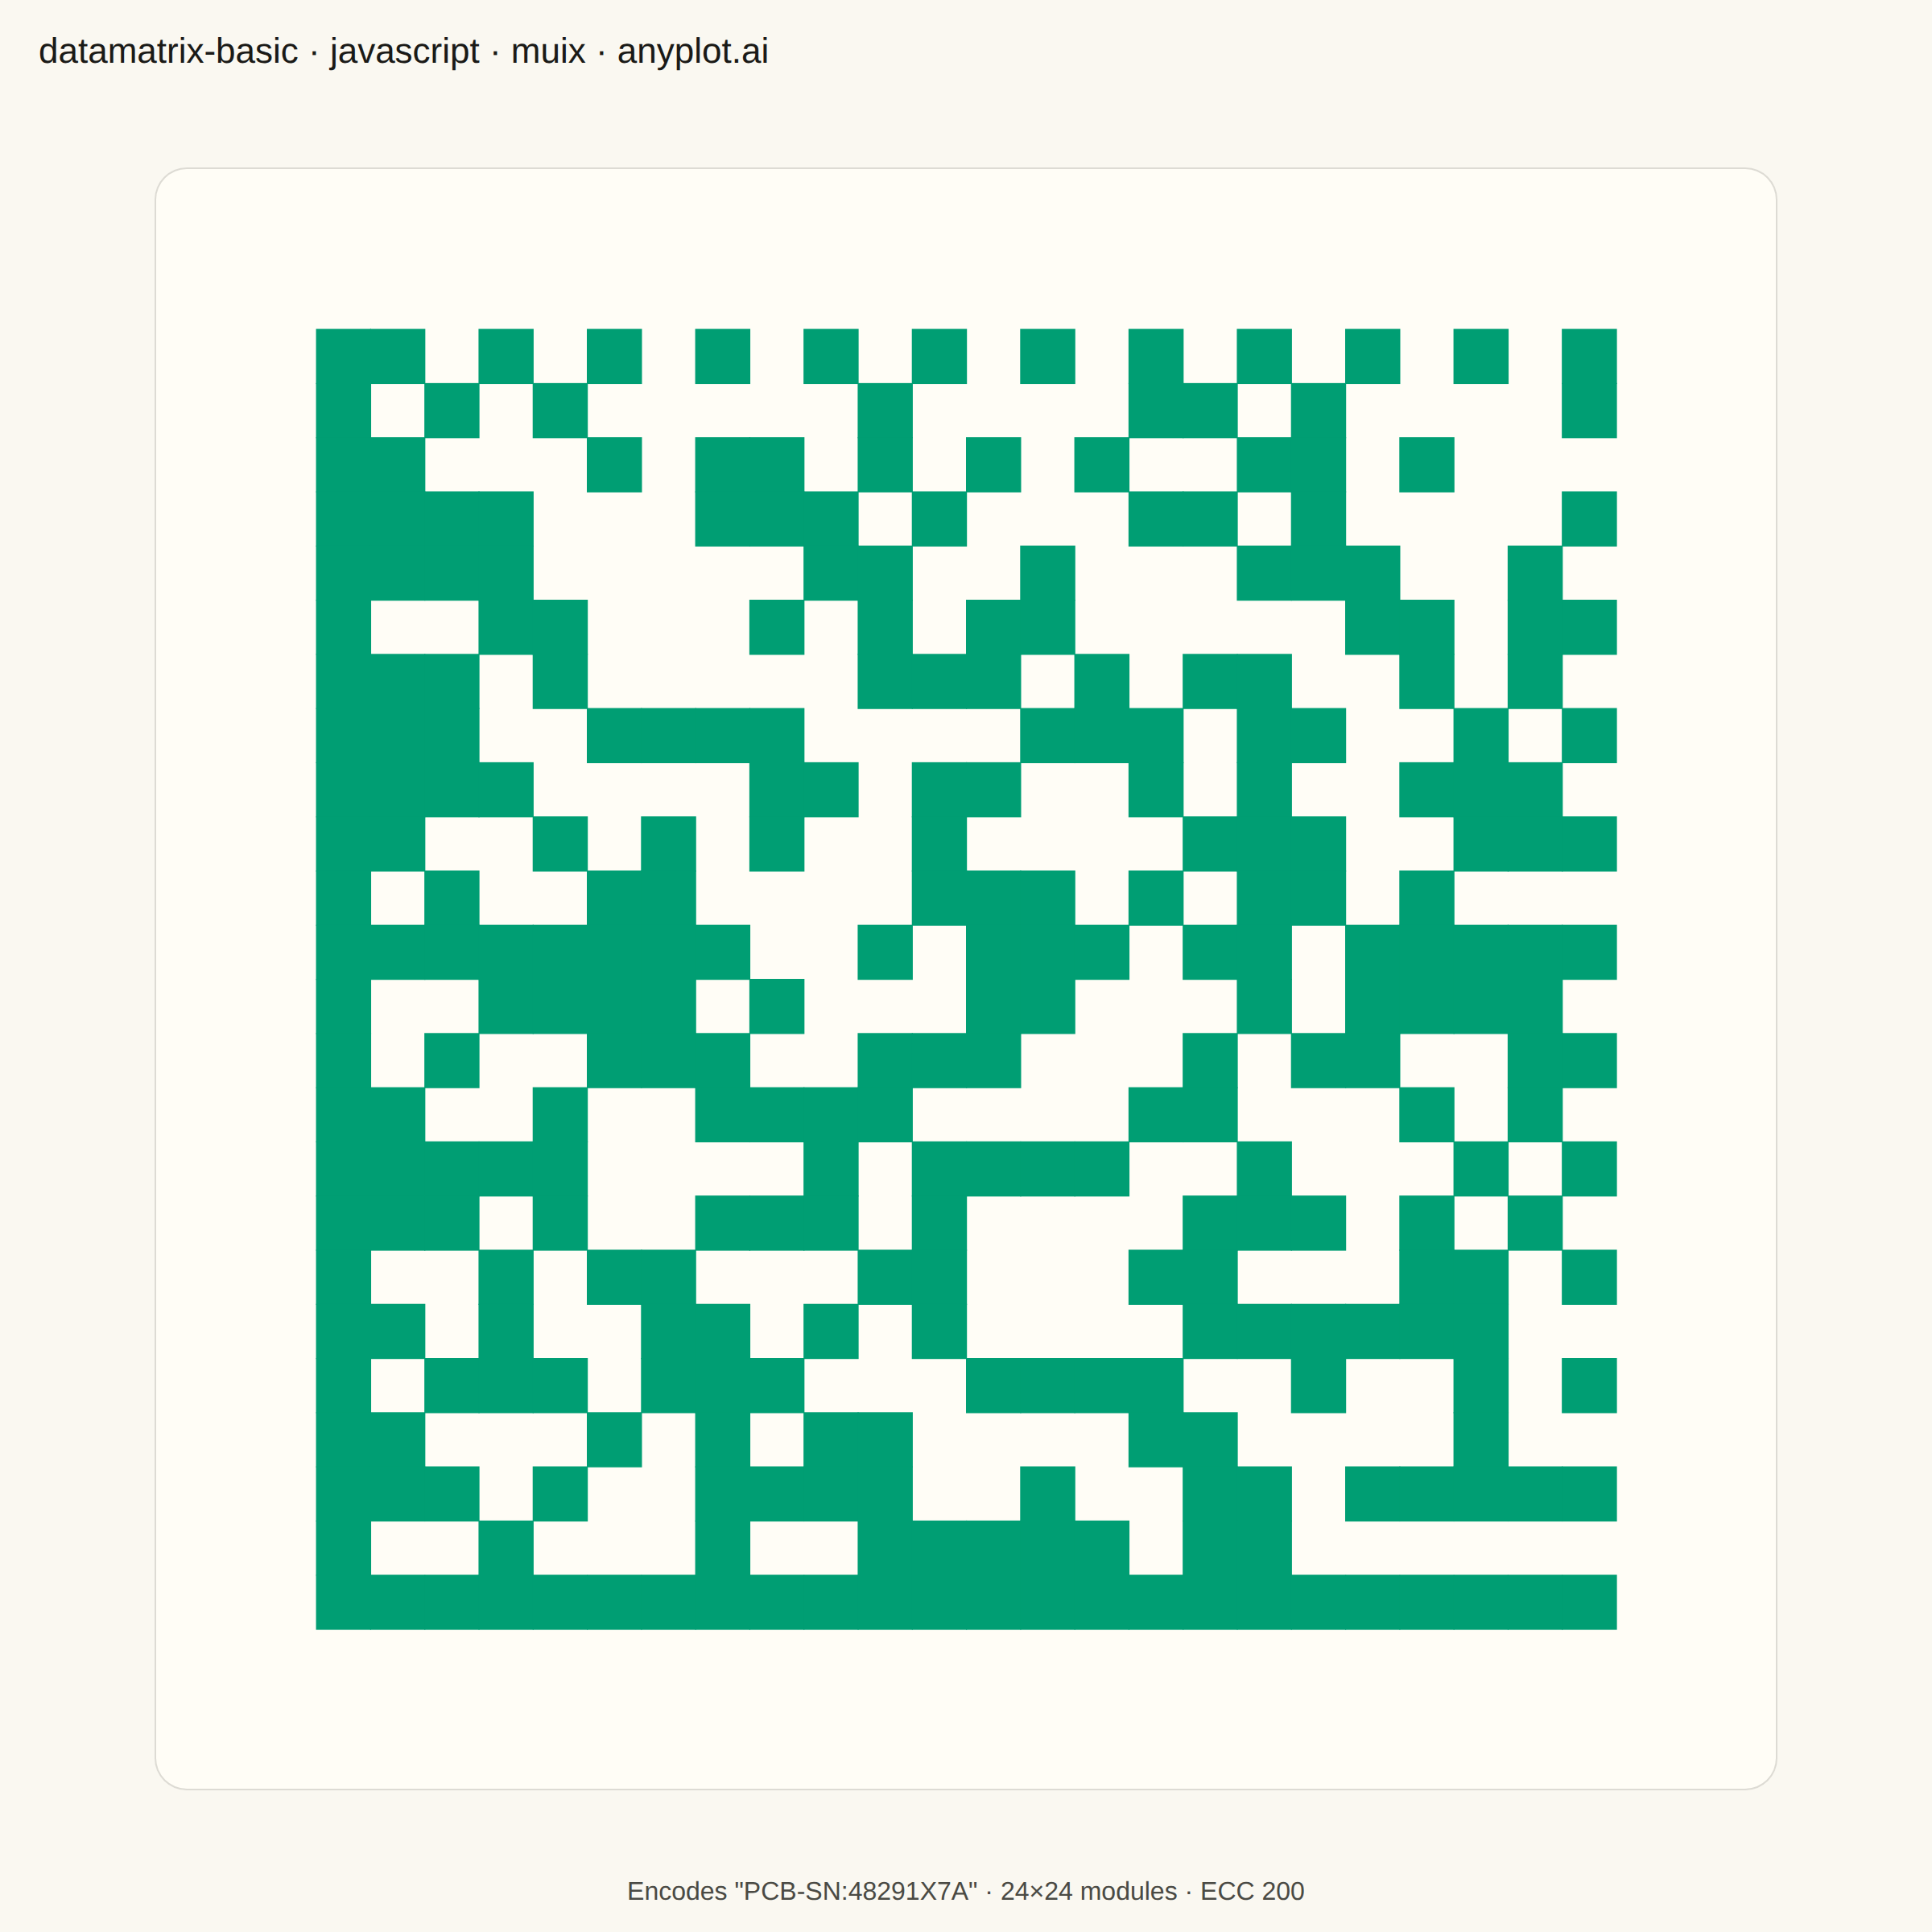
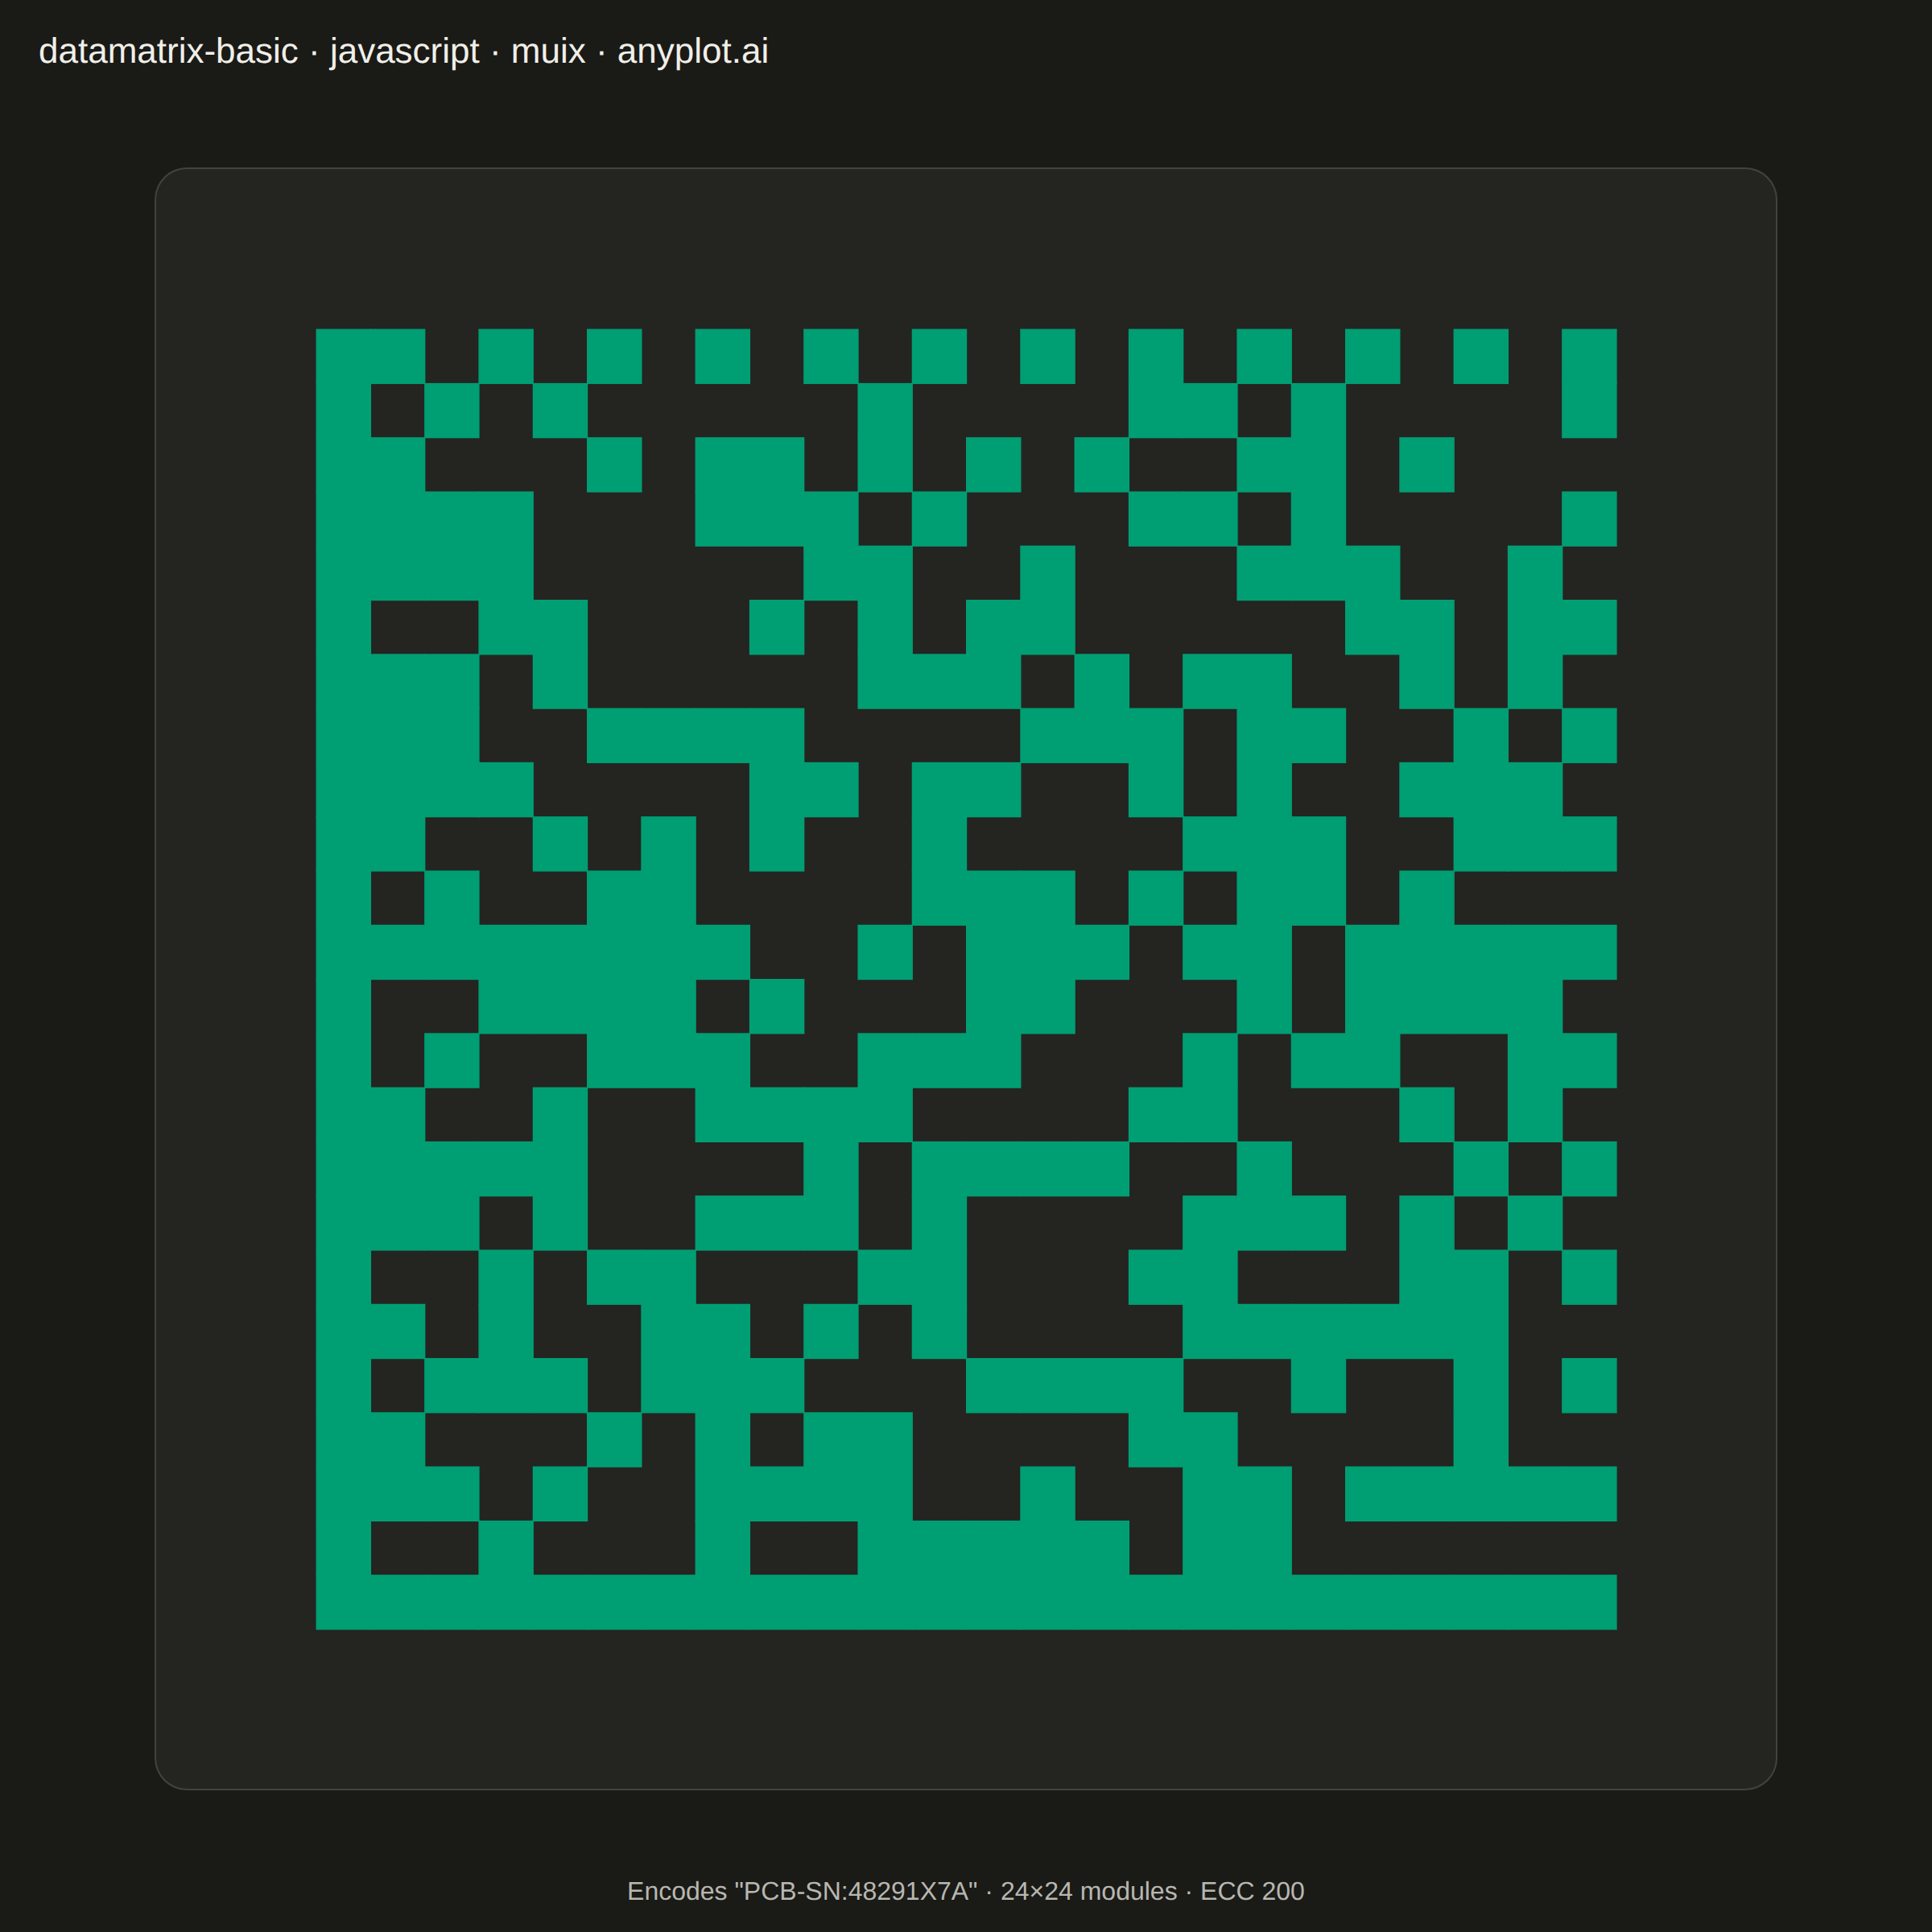
A Data Matrix 2D barcode visualization that encodes data into a compact square or rectangular matrix of black and white cells. Data Matrix codes follow the ISO/IEC 16022 standard, featuring an L-shaped finder pattern (solid borders on two adjacent sides) and alternating timing patterns on the opposite sides. This barcode format is ideal for marking small items and supports high data density with built-in error correction (ECC 200).
// anyplot.ai
// datamatrix-basic: Basic Data Matrix 2D Barcode
// Library: muix 7.29.1 | JavaScript 22.23.2
// Quality: 87/100 | Created: 2026-09-02
//# anyplot-orientation: square
// anyplot.ai
// datamatrix-basic: Basic Data Matrix 2D Barcode
// Library: MUI X Charts | React | Node 22
// License: @mui/x-charts — MIT (community). Pro/Premium are out of scope.
// Quality: pending | Created: 2026-09-02
import { ChartContainer } from "@mui/x-charts/ChartContainer";
import { useDrawingArea } from "@mui/x-charts/hooks";

const t = window.ANYPLOT_TOKENS;
const TITLE = "datamatrix-basic · javascript · muix · anyplot.ai";

// --- Data (in-memory, deterministic): part serial number for a small item ---
const CONTENT = "PCB-SN:48291X7A";
const MODULE_COUNT = 24; // ISO/IEC 16022 valid square symbol size
const QUIET_ZONE = 2; // modules of blank margin (spec requires >= 1)
const CAPTION = `Encodes "${CONTENT}" · ${MODULE_COUNT}×${MODULE_COUNT} modules · ECC 200`;
const TITLE_HEIGHT = 64;
const CAPTION_HEIGHT = 48;
const OUTER_MARGIN = 40; // page-level breathing room above/below the card, balancing the horizontal margin from centering it in the full-width canvas
const CARD_PADDING = 32; // uniform inset on all four sides between the card edge and the matrix's own quiet zone

// FNV-1a hash — used only to seed the deterministic filler LCG below.
function hashString(text) {
  let hash = 2166136261;
  for (let i = 0; i < text.length; i++) {
    hash ^= text.charCodeAt(i);
    hash = Math.imul(hash, 16777619);
  }
  return hash >>> 0;
}

// Packs the content's bits first, then fills remaining capacity with a
// fixed-seed LCG so the pattern is fully reproducible across renders.
function encodeBits(text, capacity) {
  const bits = [];
  for (let i = 0; i < text.length && bits.length < capacity; i++) {
    const code = text.charCodeAt(i);
    for (let shift = 7; shift >= 0 && bits.length < capacity; shift--) {
      bits.push((code >> shift) & 1);
    }
  }
  let state = hashString(text) || 1;
  while (bits.length < capacity) {
    state = (Math.imul(state, 1103515245) + 12345) >>> 0;
    bits.push((state >>> 16) & 1);
  }
  return bits;
}

// Builds the module grid: a solid L-shaped finder (left column + bottom row),
// an alternating clock track (top row + right column) for timing reference,
// and a data region carrying the encoded content.
function buildMatrix(text, size) {
  const grid = Array.from({ length: size }, () => new Array(size).fill(0));

  for (let r = 0; r < size; r++) grid[r][0] = 1;
  for (let c = 0; c < size; c++) grid[size - 1][c] = 1;
  for (let c = 1; c < size; c++) grid[0][c] = c % 2 === 1 ? 1 : 0;
  for (let r = 1; r < size - 1; r++) grid[r][size - 1] = r % 2 === 1 ? 1 : 0;

  const dataBits = encodeBits(text, (size - 2) * (size - 2));
  let bitIndex = 0;
  for (let r = 1; r < size - 1; r++) {
    for (let c = 1; c < size - 1; c++) {
      grid[r][c] = dataBits[bitIndex++];
    }
  }
  return grid;
}

const GRID = buildMatrix(CONTENT, MODULE_COUNT);

// --- Module squares, drawn directly in pixel space from the drawing area ---
// ScatterChart's marker is a fixed-radius circle, unsuited to gapless square
// modules — plain rects sized to the drawing area's own pitch tile exactly.
function DataMatrixModules() {
  const { left, top, width } = useDrawingArea();
  const totalUnits = MODULE_COUNT + QUIET_ZONE * 2;
  const cellSize = width / totalUnits;

  const modules = [];
  for (let r = 0; r < MODULE_COUNT; r++) {
    for (let c = 0; c < MODULE_COUNT; c++) {
      if (!GRID[r][c]) continue;
      modules.push(
        <rect
          key={`${r}-${c}`}
          x={left + (QUIET_ZONE + c) * cellSize}
          y={top + (QUIET_ZONE + r) * cellSize}
          width={cellSize + 0.6}
          height={cellSize + 0.6}
          fill={t.palette[0]}
        />,
      );
    }
  }
  return <g>{modules}</g>;
}

export default function Chart() {
  const size = window.ANYPLOT_SIZE;
  const cardSide = Math.min(
    size.width,
    size.height - TITLE_HEIGHT - CAPTION_HEIGHT - OUTER_MARGIN * 2,
  );
  const matrixSide = cardSide - CARD_PADDING * 2;

  return (
    <div
      style={{
        width: size.width,
        height: size.height,
        display: "flex",
        flexDirection: "column",
      }}
    >
      <div
        style={{
          height: TITLE_HEIGHT,
          lineHeight: `${TITLE_HEIGHT}px`,
          paddingLeft: 24,
          fontSize: 22,
          fontWeight: 500,
          color: t.ink,
        }}
      >
        {TITLE}
      </div>
      <div
        style={{
          flex: 1,
          display: "flex",
          alignItems: "center",
          justifyContent: "center",
        }}
      >
        <div
          style={{
            width: cardSide,
            height: cardSide,
            boxSizing: "border-box",
            padding: CARD_PADDING,
            backgroundColor: t.elevatedBg,
            border: `1px solid ${t.grid}`,
            borderRadius: 20,
            display: "flex",
            alignItems: "center",
            justifyContent: "center",
          }}
        >
          <ChartContainer
            width={matrixSide}
            height={matrixSide}
            series={[]}
            margin={{ top: 0, right: 0, bottom: 0, left: 0 }}
            skipAnimation
          >
            <DataMatrixModules />
          </ChartContainer>
        </div>
      </div>
      <div
        style={{
          height: CAPTION_HEIGHT,
          lineHeight: `${CAPTION_HEIGHT}px`,
          textAlign: "center",
          fontSize: 16,
          color: t.inkSoft,
        }}
      >
        {CAPTION}
      </div>
    </div>
  );
}
Runnable source as JSON, for any HTTP client: https://api.anyplot.ai/specs/datamatrix-basic/muix/code. Any spec id and library id listed in llms-full.txt fit the same URL shape; every URL below is complete and callable.
{
  "spec_id": "datamatrix-basic",
  "language": "javascript",
  "library": "muix",
  "page": "https://anyplot.ai/datamatrix-basic/javascript/muix",
  "hub": "https://anyplot.ai/datamatrix-basic",
  "code_json": "https://api.anyplot.ai/specs/datamatrix-basic/muix/code",
  "spec_json": "https://api.anyplot.ai/specs/datamatrix-basic",
  "render_light_png": "https://storage.googleapis.com/anyplot-images/plots/datamatrix-basic/javascript/muix/plot-light.png",
  "render_dark_png": "https://storage.googleapis.com/anyplot-images/plots/datamatrix-basic/javascript/muix/plot-dark.png",
  "interactive_light_html": "https://storage.googleapis.com/anyplot-images/plots/datamatrix-basic/javascript/muix/plot-light.html",
  "interactive_dark_html": "https://storage.googleapis.com/anyplot-images/plots/datamatrix-basic/javascript/muix/plot-dark.html",
  "quality_score": 87.0,
  "license": "MIT",
  "guide": "https://anyplot.ai/llms.txt"
}
Part of Basic Data Matrix 2D Barcode on anyplot.ai.