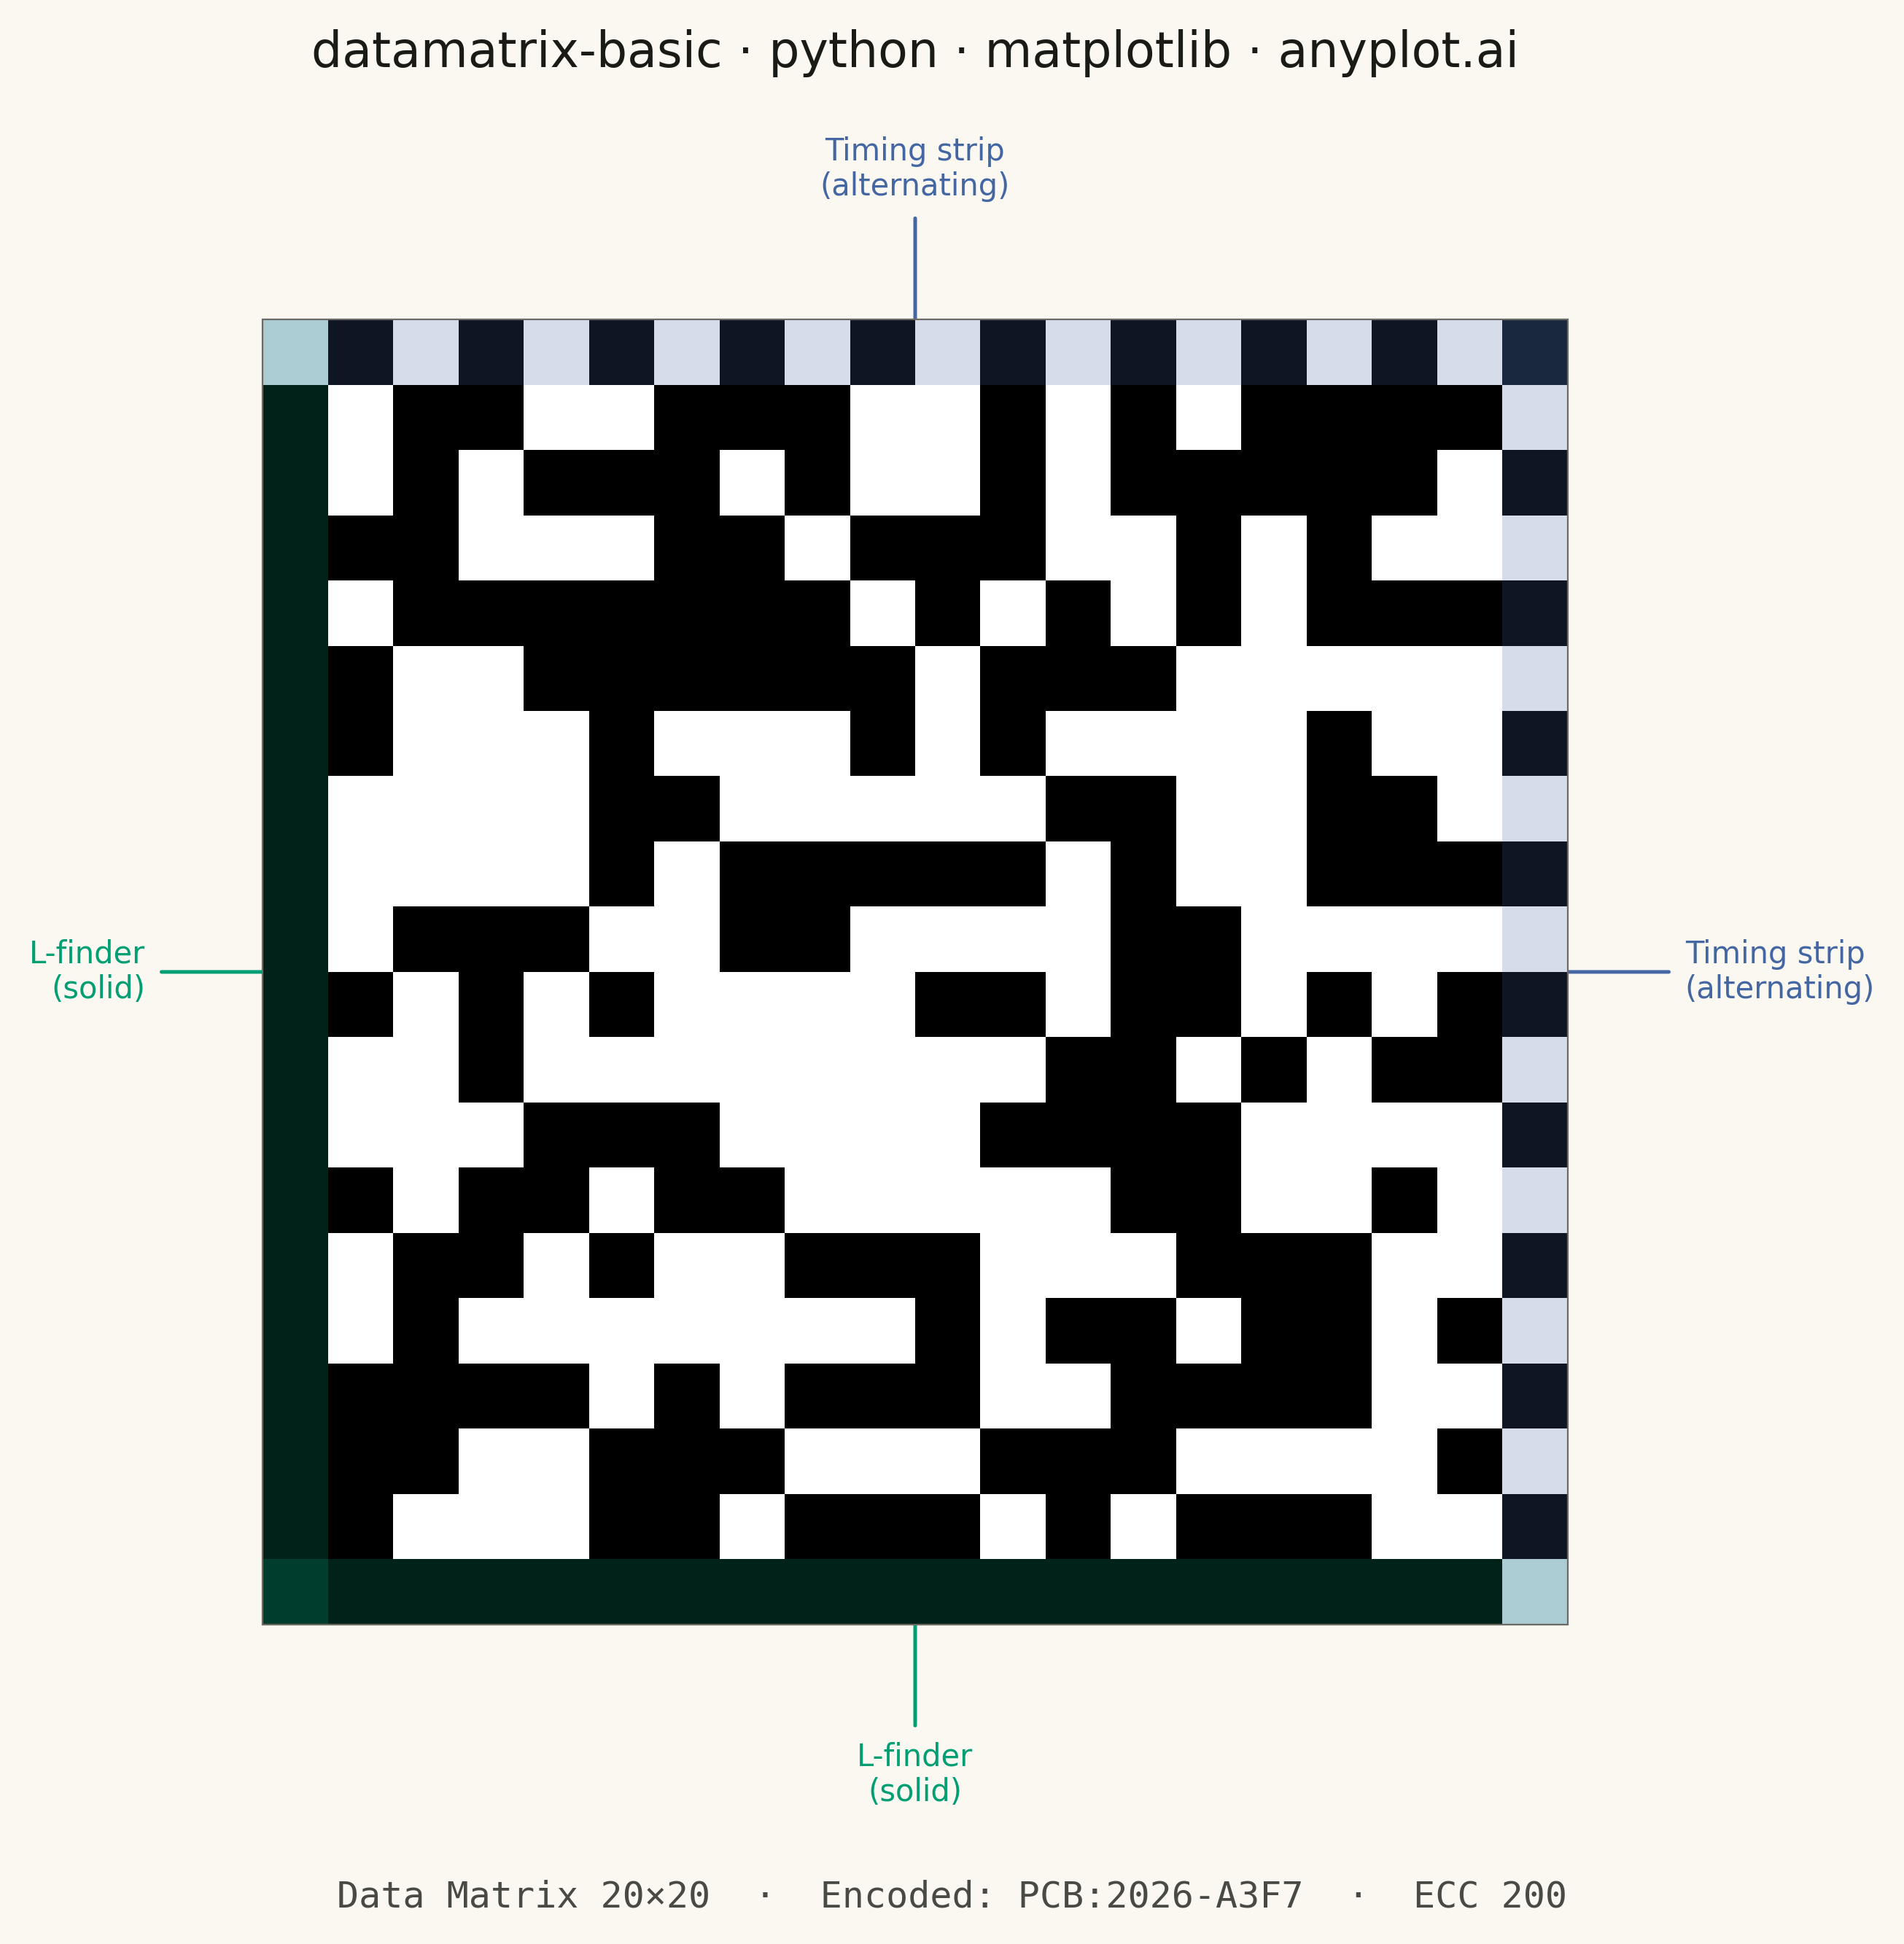
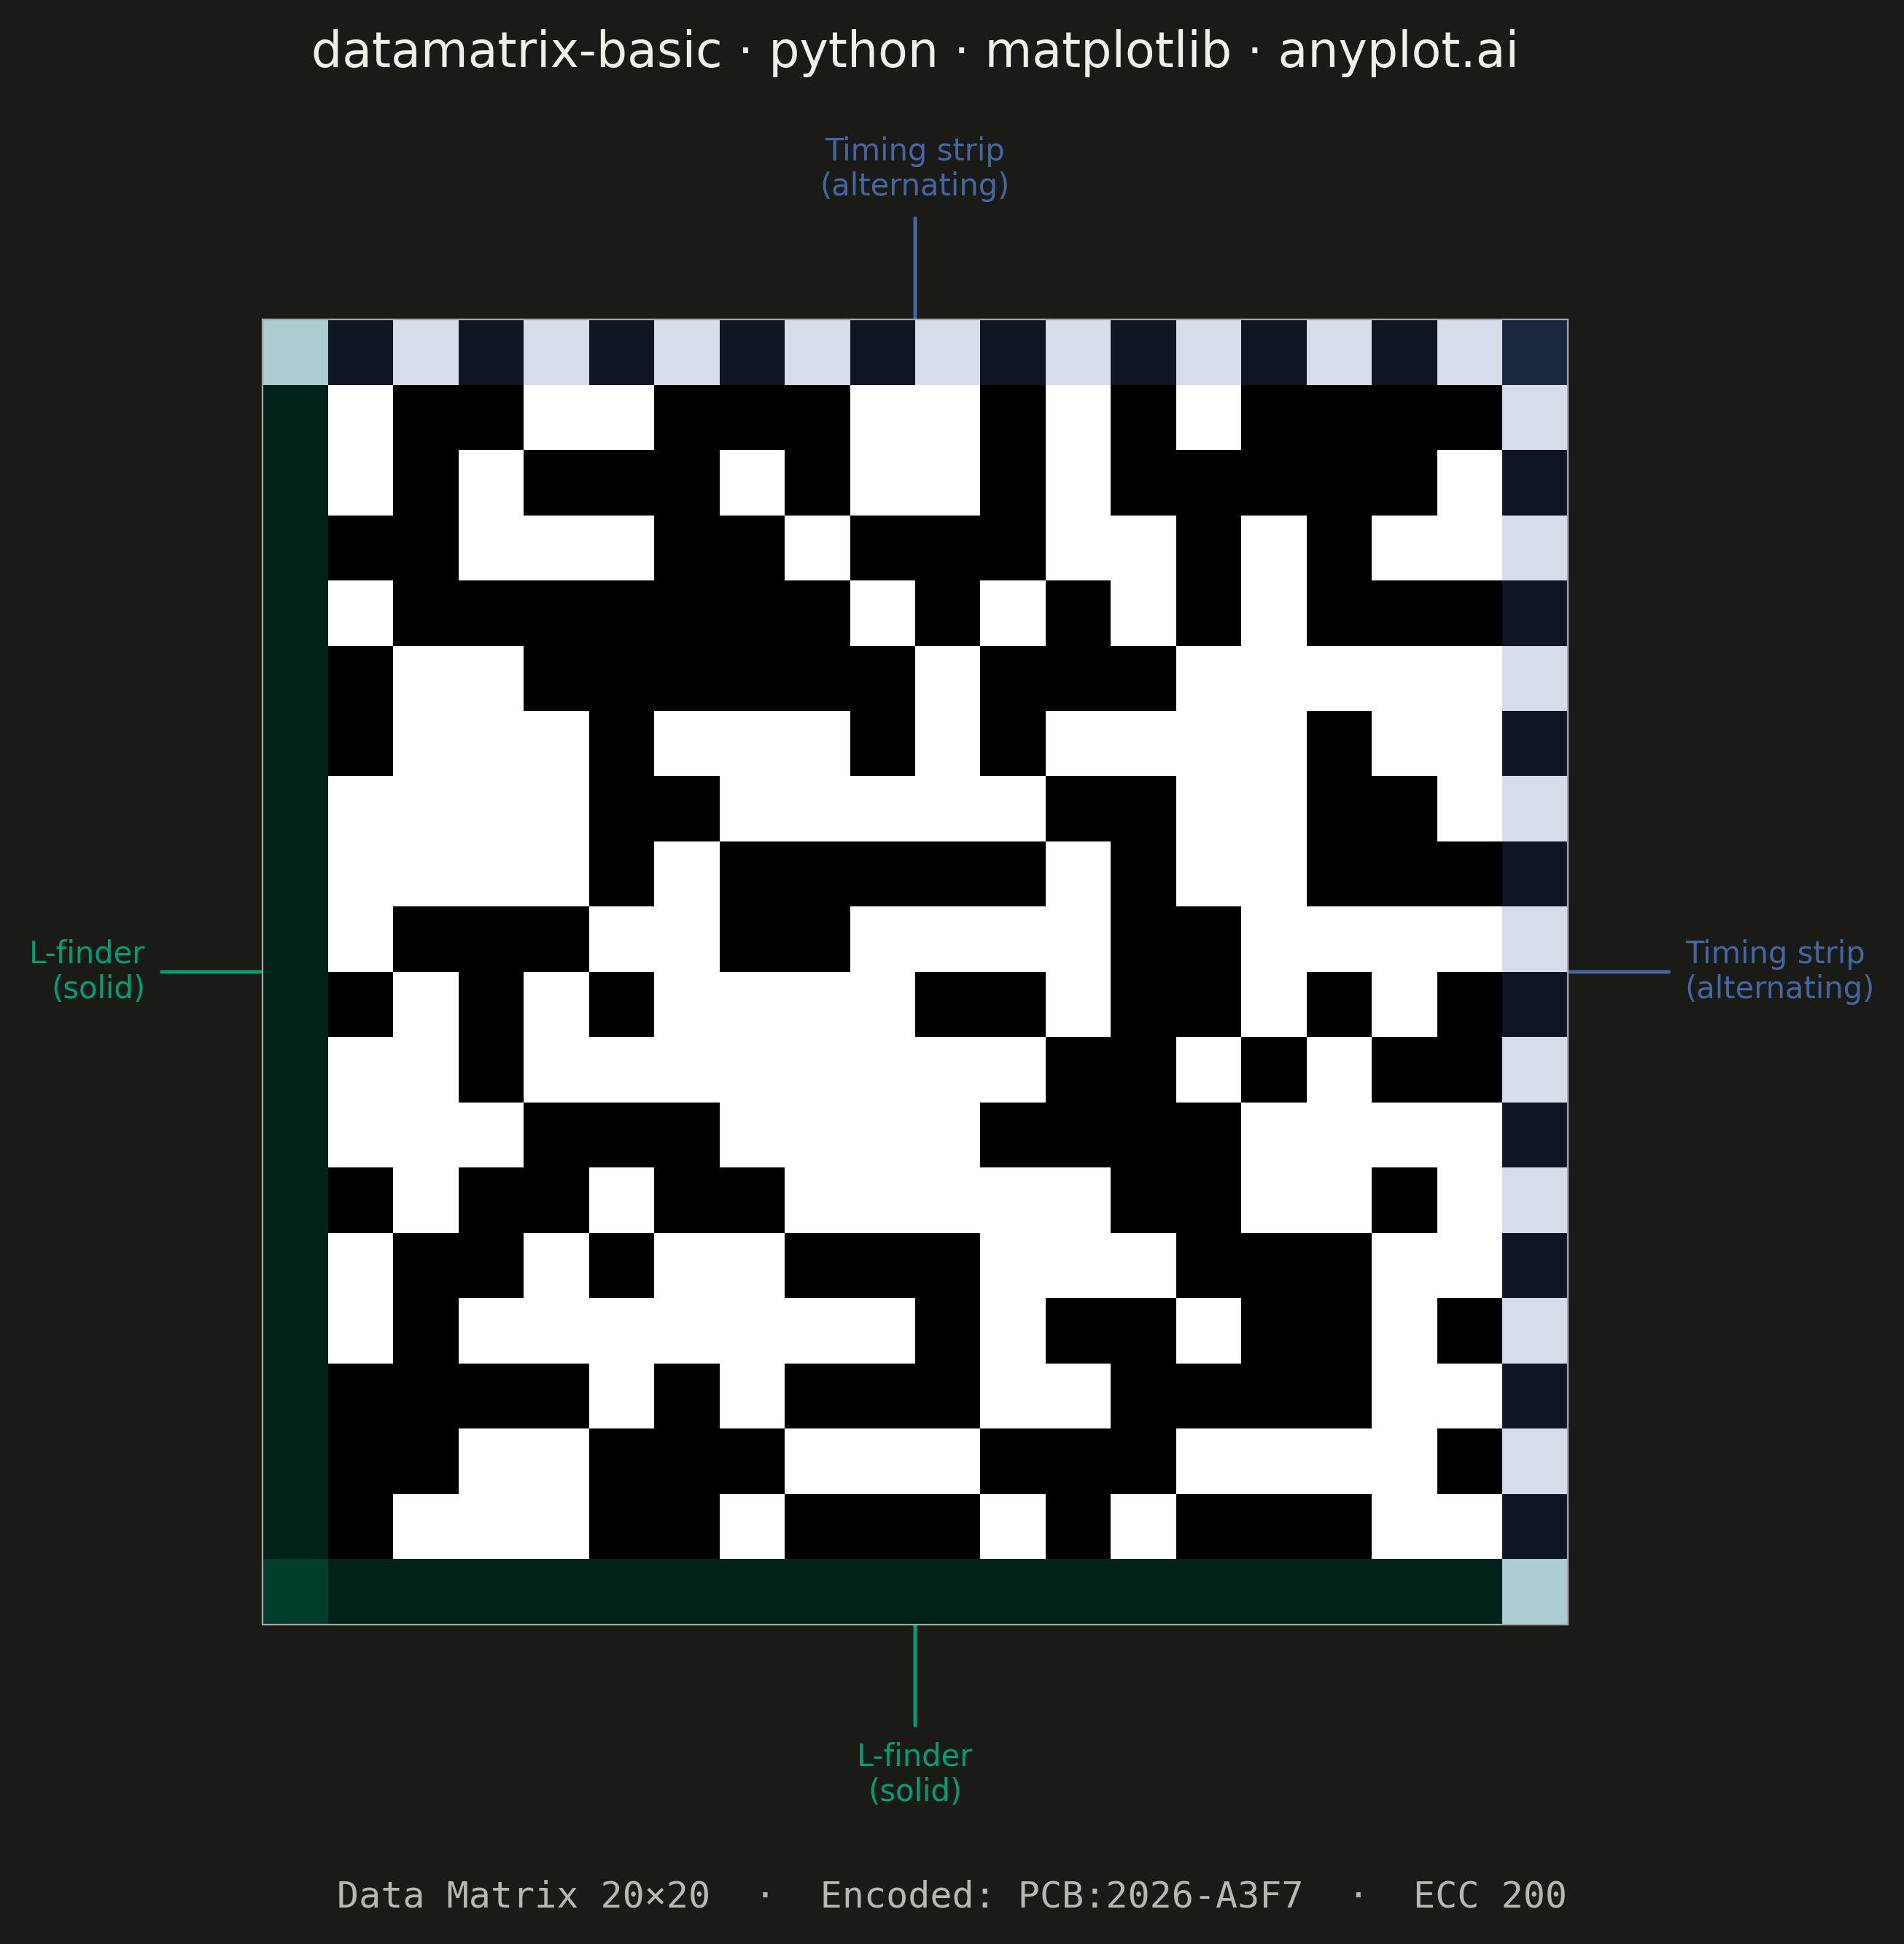
A Data Matrix 2D barcode visualization that encodes data into a compact square or rectangular matrix of black and white cells. Data Matrix codes follow the ISO/IEC 16022 standard, featuring an L-shaped finder pattern (solid borders on two adjacent sides) and alternating timing patterns on the opposite sides. This barcode format is ideal for marking small items and supports high data density with built-in error correction (ECC 200).
""" anyplot.ai
datamatrix-basic: Basic Data Matrix 2D Barcode
Library: matplotlib 3.10.9 | Python 3.13.13
Quality: 87/100 | Updated: 2026-05-20
"""

import importlib
import os
import sys


# This file is named matplotlib.py, which shadows the installed matplotlib package.
# Remove the script directory from sys.path so Python finds the real package.
_here = os.path.dirname(os.path.abspath(__file__))
sys.path = [p for p in sys.path if os.path.abspath(p or os.getcwd()) != _here]
del _here

plt = importlib.import_module("matplotlib.pyplot")
mpatches = importlib.import_module("matplotlib.patches")
np = importlib.import_module("numpy")

# Theme tokens
THEME = os.getenv("ANYPLOT_THEME", "light")
PAGE_BG = "#FAF8F1" if THEME == "light" else "#1A1A17"
INK = "#1A1A17" if THEME == "light" else "#F0EFE8"
INK_SOFT = "#4A4A44" if THEME == "light" else "#B8B7B0"
INK_MUTED = "#6B6A63" if THEME == "light" else "#A8A79F"

# Zone colors — Okabe-Ito, theme-constant (data encoding)
COLOR_FINDER = "#009E73"
COLOR_TIMING = "#4467A3"
COLOR_DATA = "#AE3030"

# Data — 20×20 Data Matrix for electronics component traceability
np.random.seed(42)
SIZE = 20
content = "PCB:2026-A3F7"

# Initialize matrix (0 = white, 1 = black)
matrix = np.zeros((SIZE, SIZE), dtype=int)

# L-shaped finder pattern: solid black left column + bottom row
matrix[:, 0] = 1
matrix[-1, :] = 1

# Alternating timing pattern on top row + right column
for i in range(SIZE):
    matrix[0, i] = i % 2  # top row: alternating, starts white
    matrix[i, -1] = (i + 1) % 2  # right col: alternating, starts black

# Interior data: deterministic pseudo-random seeded from content bytes
content_seed = sum(ord(c) for c in content)
interior = np.random.RandomState(content_seed).randint(0, 2, size=(SIZE - 2, SIZE - 2))
matrix[1:-1, 1:-1] = interior

# Canvas — 2800×2800 px (wider quiet zone to accommodate zone callout annotations)
fig, ax = plt.subplots(figsize=(7, 7), dpi=400, facecolor=PAGE_BG)
ax.set_facecolor("white")  # barcode scanning standard requires white cell background

# Render Data Matrix with pcolormesh for crisp pixel-grid cell boundaries
xc = np.arange(SIZE + 1)
yc = np.arange(SIZE + 1)
ax.pcolormesh(xc, yc, matrix[::-1], cmap="binary", edgecolors="none", linewidth=0, zorder=5)

ax.set_aspect("equal")
qz = 3.0
ax.set_xlim(-qz, SIZE + qz)
ax.set_ylim(-qz, SIZE + qz)
ax.axis("off")

# ── Structural zone overlays (matplotlib.patches.Rectangle) ───────────────
# After matrix[::-1] flip: y=0 (bottom) = L-finder row; y=SIZE-1 (top) = timing row
ax.add_patch(mpatches.Rectangle((0, 0), 1, SIZE, fc=COLOR_FINDER, alpha=0.22, ec="none", zorder=6))
ax.add_patch(mpatches.Rectangle((0, 0), SIZE, 1, fc=COLOR_FINDER, alpha=0.22, ec="none", zorder=6))
ax.add_patch(mpatches.Rectangle((0, SIZE - 1), SIZE, 1, fc=COLOR_TIMING, alpha=0.22, ec="none", zorder=6))
ax.add_patch(mpatches.Rectangle((SIZE - 1, 0), 1, SIZE, fc=COLOR_TIMING, alpha=0.22, ec="none", zorder=6))
ax.add_patch(mpatches.Rectangle((1, 1), SIZE - 2, SIZE - 2, fc=COLOR_DATA, alpha=0.07, ec="none", zorder=4))
# Quiet-zone border outlines the scanning area
ax.add_patch(mpatches.Rectangle((0, 0), SIZE, SIZE, fc="none", ec=INK_MUTED, lw=0.4, zorder=7))

# ── Zone callout annotations with arrows ──────────────────────────────────
ax.annotate(
    "L-finder\n(solid)",
    xy=(0.5, SIZE / 2),
    xytext=(-1.8, SIZE / 2),
    ha="right",
    va="center",
    fontsize=7.5,
    color=COLOR_FINDER,
    arrowprops={"arrowstyle": "->", "color": COLOR_FINDER, "lw": 0.9, "mutation_scale": 9},
)
ax.annotate(
    "L-finder\n(solid)",
    xy=(SIZE / 2, 0.5),
    xytext=(SIZE / 2, -1.8),
    ha="center",
    va="top",
    fontsize=7.5,
    color=COLOR_FINDER,
    arrowprops={"arrowstyle": "->", "color": COLOR_FINDER, "lw": 0.9, "mutation_scale": 9},
)
ax.annotate(
    "Timing strip\n(alternating)",
    xy=(SIZE / 2, SIZE - 0.5),
    xytext=(SIZE / 2, SIZE + 1.8),
    ha="center",
    va="bottom",
    fontsize=7.5,
    color=COLOR_TIMING,
    arrowprops={"arrowstyle": "->", "color": COLOR_TIMING, "lw": 0.9, "mutation_scale": 9},
)
ax.annotate(
    "Timing strip\n(alternating)",
    xy=(SIZE - 0.5, SIZE / 2),
    xytext=(SIZE + 1.8, SIZE / 2),
    ha="left",
    va="center",
    fontsize=7.5,
    color=COLOR_TIMING,
    arrowprops={"arrowstyle": "->", "color": COLOR_TIMING, "lw": 0.9, "mutation_scale": 9},
)
# ECC 200 data region label — center of interior
ax.annotate(
    "ECC 200\ndata region",
    xy=(SIZE / 2, SIZE / 2),
    xytext=(SIZE / 2, SIZE / 2),
    ha="center",
    va="center",
    fontsize=7,
    color=COLOR_DATA,
    alpha=0.65,
    arrowprops=None,
)

# Title
ax.set_title("datamatrix-basic · python · matplotlib · anyplot.ai", fontsize=12, fontweight="medium", color=INK, pad=14)

# Encoded content annotation
fig.text(
    0.5,
    0.055,
    f"Data Matrix 20×20  ·  Encoded: {content}  ·  ECC 200",
    ha="center",
    va="bottom",
    fontsize=9,
    fontfamily="monospace",
    color=INK_SOFT,
)

plt.tight_layout(rect=[0, 0.08, 1, 1])
plt.savefig(f"plot-{THEME}.png", dpi=400, bbox_inches="tight", facecolor=PAGE_BG)
Runnable source as JSON, for any HTTP client: https://api.anyplot.ai/specs/datamatrix-basic/matplotlib/code. Any spec id and library id listed in llms-full.txt fit the same URL shape; every URL below is complete and callable.
{
  "spec_id": "datamatrix-basic",
  "language": "python",
  "library": "matplotlib",
  "page": "https://anyplot.ai/datamatrix-basic/python/matplotlib",
  "hub": "https://anyplot.ai/datamatrix-basic",
  "code_json": "https://api.anyplot.ai/specs/datamatrix-basic/matplotlib/code",
  "spec_json": "https://api.anyplot.ai/specs/datamatrix-basic",
  "render_light_png": "https://storage.googleapis.com/anyplot-images/plots/datamatrix-basic/python/matplotlib/plot-light.png",
  "render_dark_png": "https://storage.googleapis.com/anyplot-images/plots/datamatrix-basic/python/matplotlib/plot-dark.png",
  "quality_score": 87.0,
  "license": "MIT",
  "guide": "https://anyplot.ai/llms.txt"
}
Part of Basic Data Matrix 2D Barcode on anyplot.ai.