The same plot in 14 other libraries — Python: Altair, Bokeh, lets-plot, Matplotlib, Plotly, plotnine, Pygal, Seaborn; R: ggplot2; JavaScript: Chart.js, D3.js, Apache ECharts, Highcharts, MUI X Charts. Compare all 15 side by side: Basic Data Matrix 2D Barcode in Python, R, Julia and JavaScript.
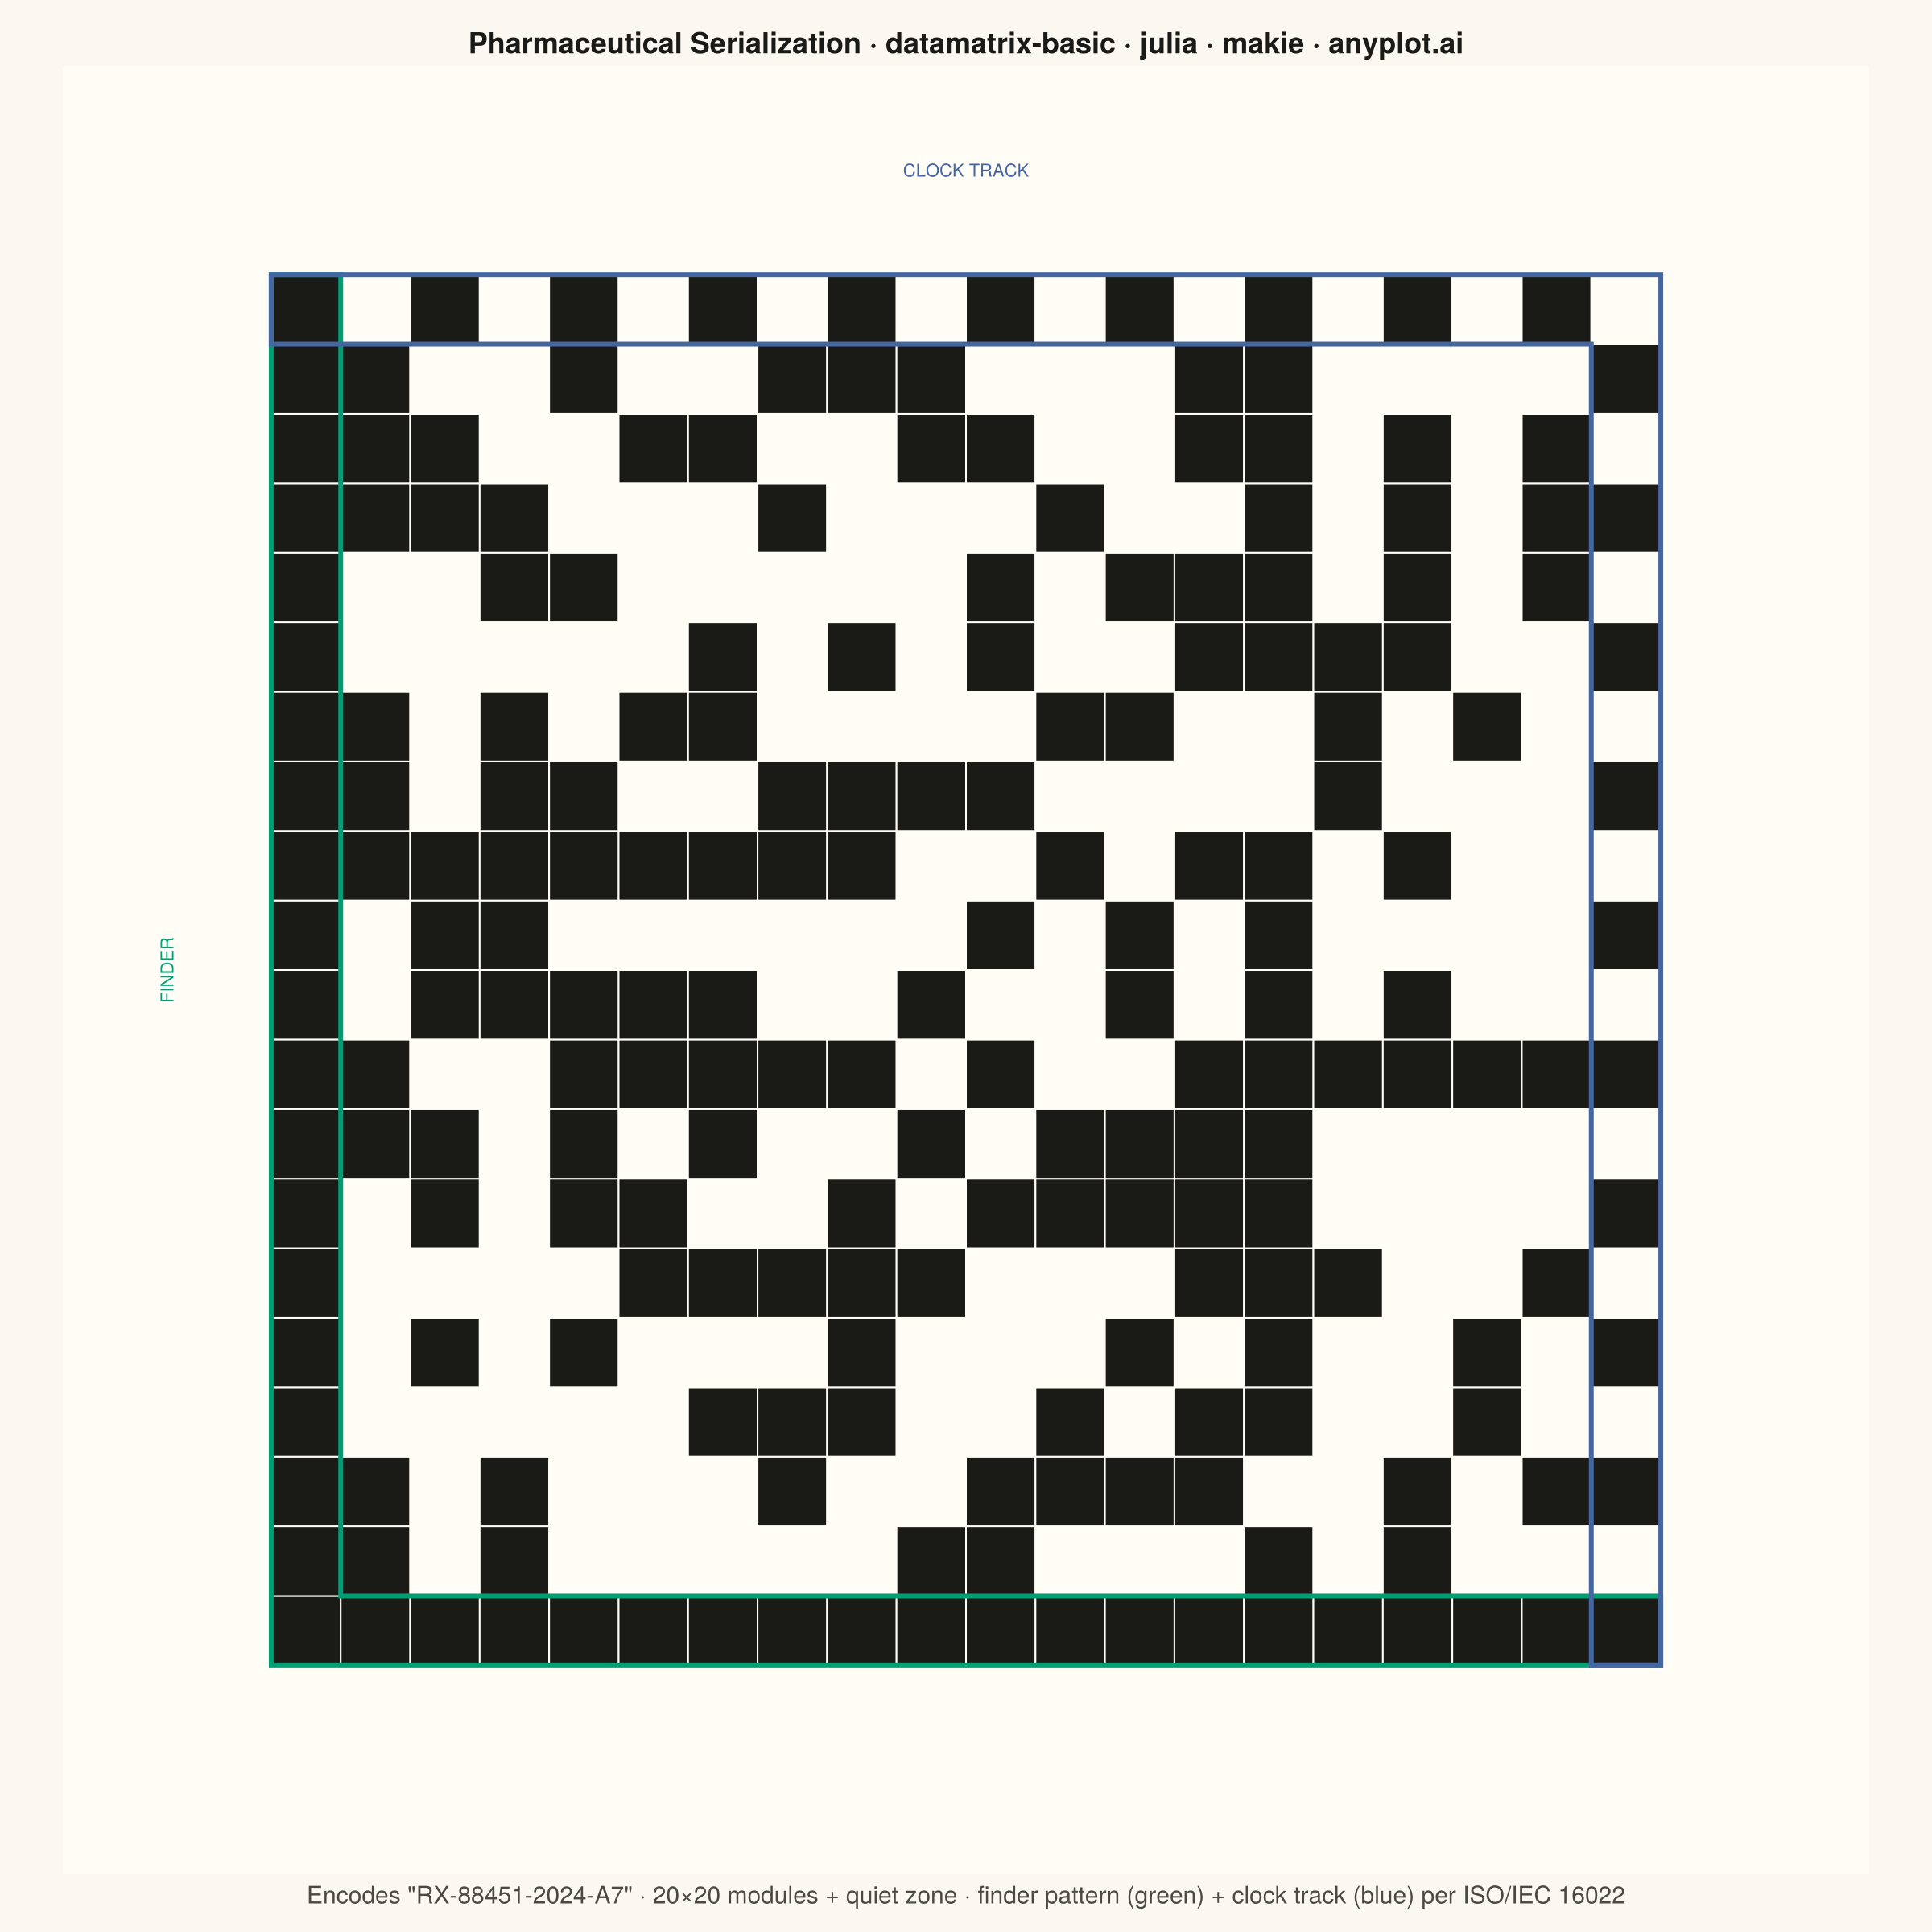
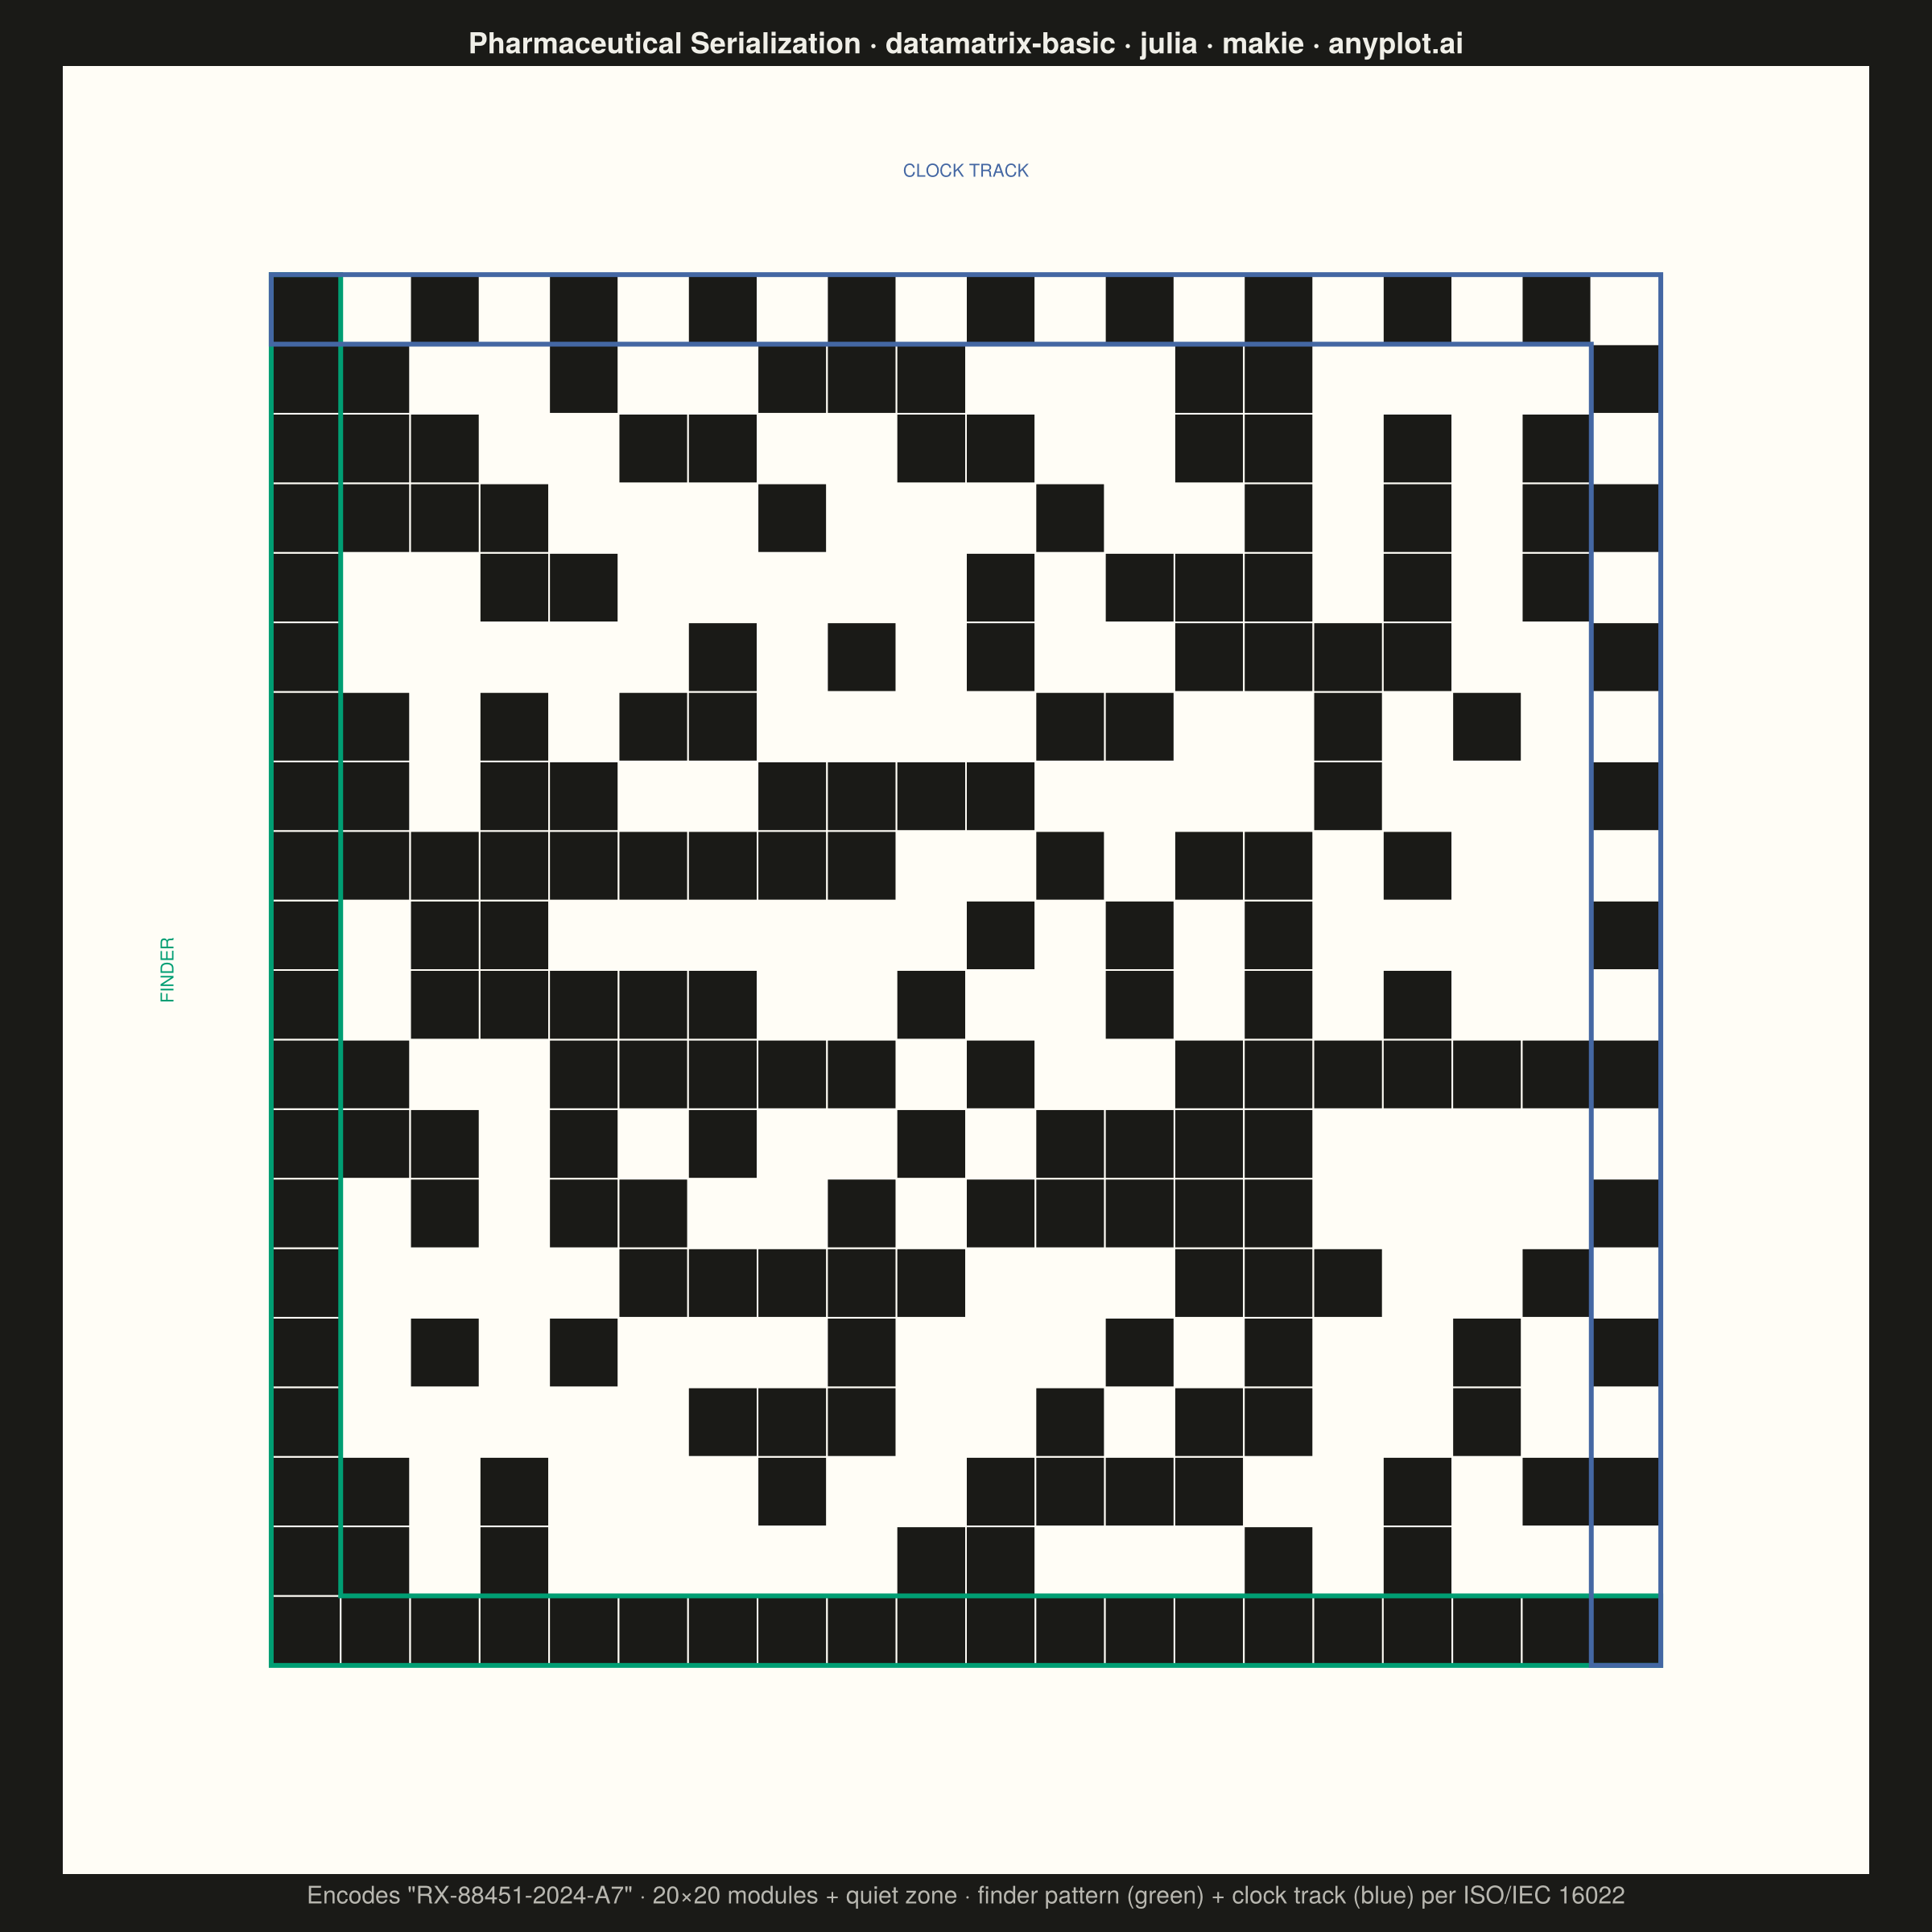
A Data Matrix 2D barcode visualization that encodes data into a compact square or rectangular matrix of black and white cells. Data Matrix codes follow the ISO/IEC 16022 standard, featuring an L-shaped finder pattern (solid borders on two adjacent sides) and alternating timing patterns on the opposite sides. This barcode format is ideal for marking small items and supports high data density with built-in error correction (ECC 200).
# anyplot.ai
# datamatrix-basic: Basic Data Matrix 2D Barcode
# Library: makie 0.21.9 | Julia 1.11.9
# Quality: 90/100 | Created: 2026-09-02

using CairoMakie
using Colors
using Random

const THEME    = get(ENV, "ANYPLOT_THEME", "light")
const PAGE_BG  = THEME == "light" ? colorant"#FAF8F1" : colorant"#1A1A17"
const INK      = THEME == "light" ? colorant"#1A1A17" : colorant"#F0EFE8"
const INK_SOFT = THEME == "light" ? colorant"#4A4A44" : colorant"#B8B7B0"

# A printed Data Matrix code is black-on-white for scanner contrast under any
# lighting, so it does not follow the page theme the way surrounding chrome
# does — these two stay fixed instead of branching on THEME.
const DM_BG  = colorant"#FFFDF6"
const DM_INK = colorant"#1A1A17"

# --- Data ---------------------------------------------------------------
# Pharmaceutical serialization code, one of the spec's listed applications.
content = "RX-88451-2024-A7"
n       = 20  # modules per side, including the finder + clock-track border
quiet   = 3   # ISO/IEC 16022 quiet zone, in modules (spec asks for >= 1)
m       = n + 2 * quiet

Random.seed!(42)
z = zeros(Bool, m, m)
for x in 1:n, y in 1:n
    gx, gy = quiet + x, quiet + y
    z[gx, gy] =
        if x == 1
            true         # left column: solid L-shaped finder pattern
        elseif y == 1
            true         # bottom row: solid L-shaped finder pattern
        elseif y == n
            isodd(x)     # top row: alternating clock (timing) track
        elseif x == n
            isodd(y)     # right column: alternating clock (timing) track
        else
            rand(Bool)   # data region: representative module fill — full
                          # ECC200 Reed-Solomon codeword placement is out of
                          # scope for this static illustration
        end
end

# --- Plot -----------------------------------------------------------------
# Structural-region accent colors: annotation chrome that teaches the
# ISO/IEC 16022 layout, kept fixed across themes like other categorical
# data colors (only page/ink chrome flips with THEME).
const FINDER_COLOR = colorant"#009E73"  # Imprint palette 1 — L-shaped finder pattern
const CLOCK_COLOR  = colorant"#4467A3"  # Imprint palette 3 — alternating clock track

title_str      = "Pharmaceutical Serialization · datamatrix-basic · julia · makie · anyplot.ai"
title_fontsize = max(13, round(Int, 20 * min(1.0, 67 / length(title_str))))

fig = Figure(
    size            = (1200, 1200),
    fontsize        = 14,
    backgroundcolor = PAGE_BG,
)

ax = Axis(
    fig[1, 1];
    aspect             = DataAspect(),
    backgroundcolor    = DM_BG,
    title              = title_str,
    titlesize          = title_fontsize,
    titlecolor         = INK,
    xlabel             = "Encodes \"$content\" · $(n)×$(n) modules + quiet zone · finder pattern (green) + clock track (blue) per ISO/IEC 16022",
    xlabelsize         = 15,
    xlabelcolor        = INK_SOFT,
    topspinevisible    = false,
    rightspinevisible  = false,
    leftspinevisible   = false,
    bottomspinevisible = false,
    xticksvisible      = false,
    yticksvisible      = false,
    xticklabelsvisible = false,
    yticklabelsvisible = false,
    xgridvisible       = false,
    ygridvisible       = false,
)

# Per-module rectangles via `poly!` (rather than `heatmap!`) give crisp,
# individually stroked cell borders — a distinctive Makie layered-plotting
# feature — and let us overlay colored structure annotations on top.
cell(x0, y0) = Point2f[(x0, y0), (x0 + 1, y0), (x0 + 1, y0 + 1), (x0, y0 + 1)]
cells  = vec([cell(x - 1, y - 1) for x in 1:m, y in 1:m])
fills  = vec([z[x, y] ? DM_INK : DM_BG for x in 1:m, y in 1:m])
poly!(ax, cells; color = fills, strokecolor = DM_BG, strokewidth = 1.0)

# Highlight the L-shaped finder pattern (left column + bottom row) and the
# alternating clock track (top row + right column) with colored outlines,
# so the ISO/IEC 16022 structure reads directly from the image instead of
# relying solely on the caption text.
finder_outline = Point2f[
    (quiet, quiet + n), (quiet, quiet), (quiet + n, quiet),
    (quiet + n, quiet + 1), (quiet + 1, quiet + 1), (quiet + 1, quiet + n),
    (quiet, quiet + n),
]
clock_outline = Point2f[
    (quiet, quiet + n), (quiet + n, quiet + n), (quiet + n, quiet),
    (quiet + n - 1, quiet), (quiet + n - 1, quiet + n - 1), (quiet, quiet + n - 1),
    (quiet, quiet + n),
]
lines!(ax, finder_outline; color = FINDER_COLOR, linewidth = 3)
lines!(ax, clock_outline; color = CLOCK_COLOR, linewidth = 3)

text!(ax, "FINDER";
    position  = Point2f(quiet - 1.5, quiet + n / 2),
    rotation  = pi / 2,
    align     = (:center, :center),
    color     = FINDER_COLOR,
    fontsize  = 11,
)
text!(ax, "CLOCK TRACK";
    position  = Point2f(quiet + n / 2, quiet + n + 1.5),
    align     = (:center, :center),
    color     = CLOCK_COLOR,
    fontsize  = 11,
)

limits!(ax, 0, m, 0, m)

save("plot-$(THEME).png", fig; px_per_unit = 2)
Runnable source as JSON, for any HTTP client: https://api.anyplot.ai/specs/datamatrix-basic/makie/code. Any spec id and library id listed in llms-full.txt fit the same URL shape; every URL below is complete and callable.
{
  "spec_id": "datamatrix-basic",
  "language": "julia",
  "library": "makie",
  "page": "https://anyplot.ai/datamatrix-basic/julia/makie",
  "hub": "https://anyplot.ai/datamatrix-basic",
  "code_json": "https://api.anyplot.ai/specs/datamatrix-basic/makie/code",
  "spec_json": "https://api.anyplot.ai/specs/datamatrix-basic",
  "render_light_png": "https://storage.googleapis.com/anyplot-images/plots/datamatrix-basic/julia/makie/plot-light.png",
  "render_dark_png": "https://storage.googleapis.com/anyplot-images/plots/datamatrix-basic/julia/makie/plot-dark.png",
  "quality_score": 90.0,
  "license": "MIT",
  "guide": "https://anyplot.ai/llms.txt"
}
Part of Basic Data Matrix 2D Barcode on anyplot.ai.