The same plot in 14 other libraries — JavaScript: Chart.js, D3.js, Highcharts, MUI X Charts; Python: Altair, Bokeh, lets-plot, Matplotlib, Plotly, plotnine, Pygal, Seaborn; R: ggplot2; Julia: Makie.jl. Compare all 15 side by side: Basic Data Matrix 2D Barcode in Python, R, Julia and JavaScript.
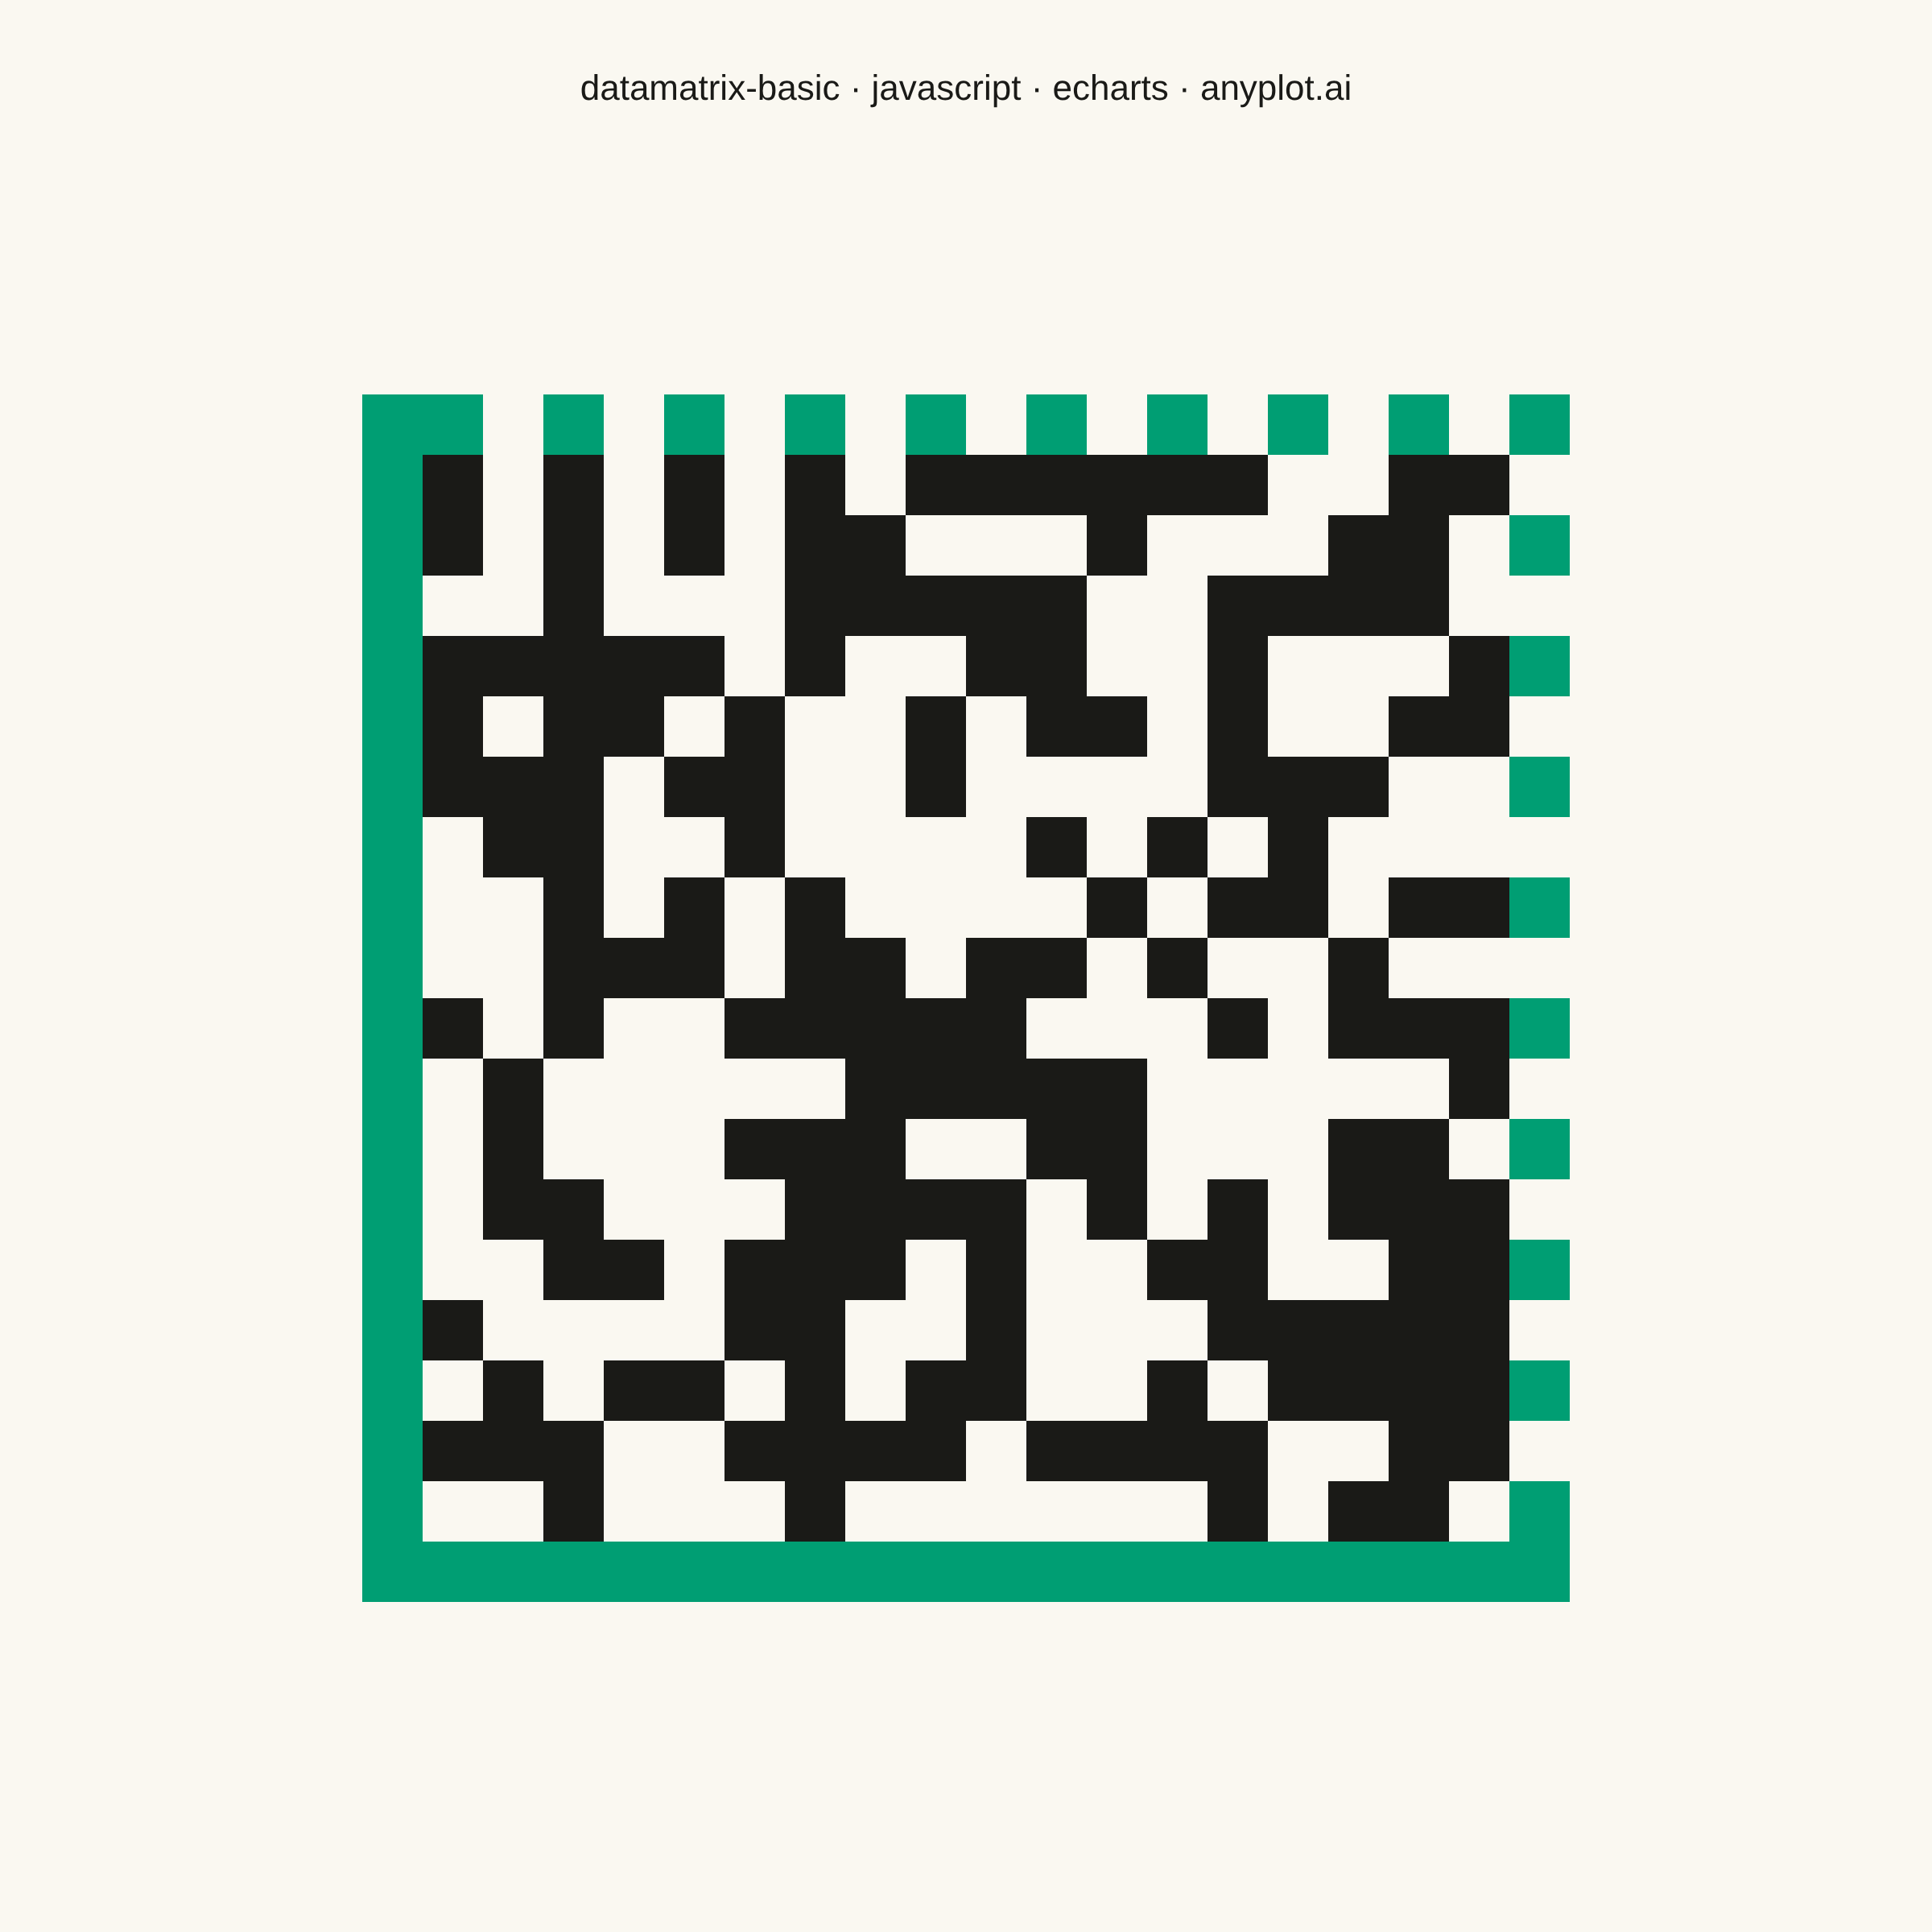
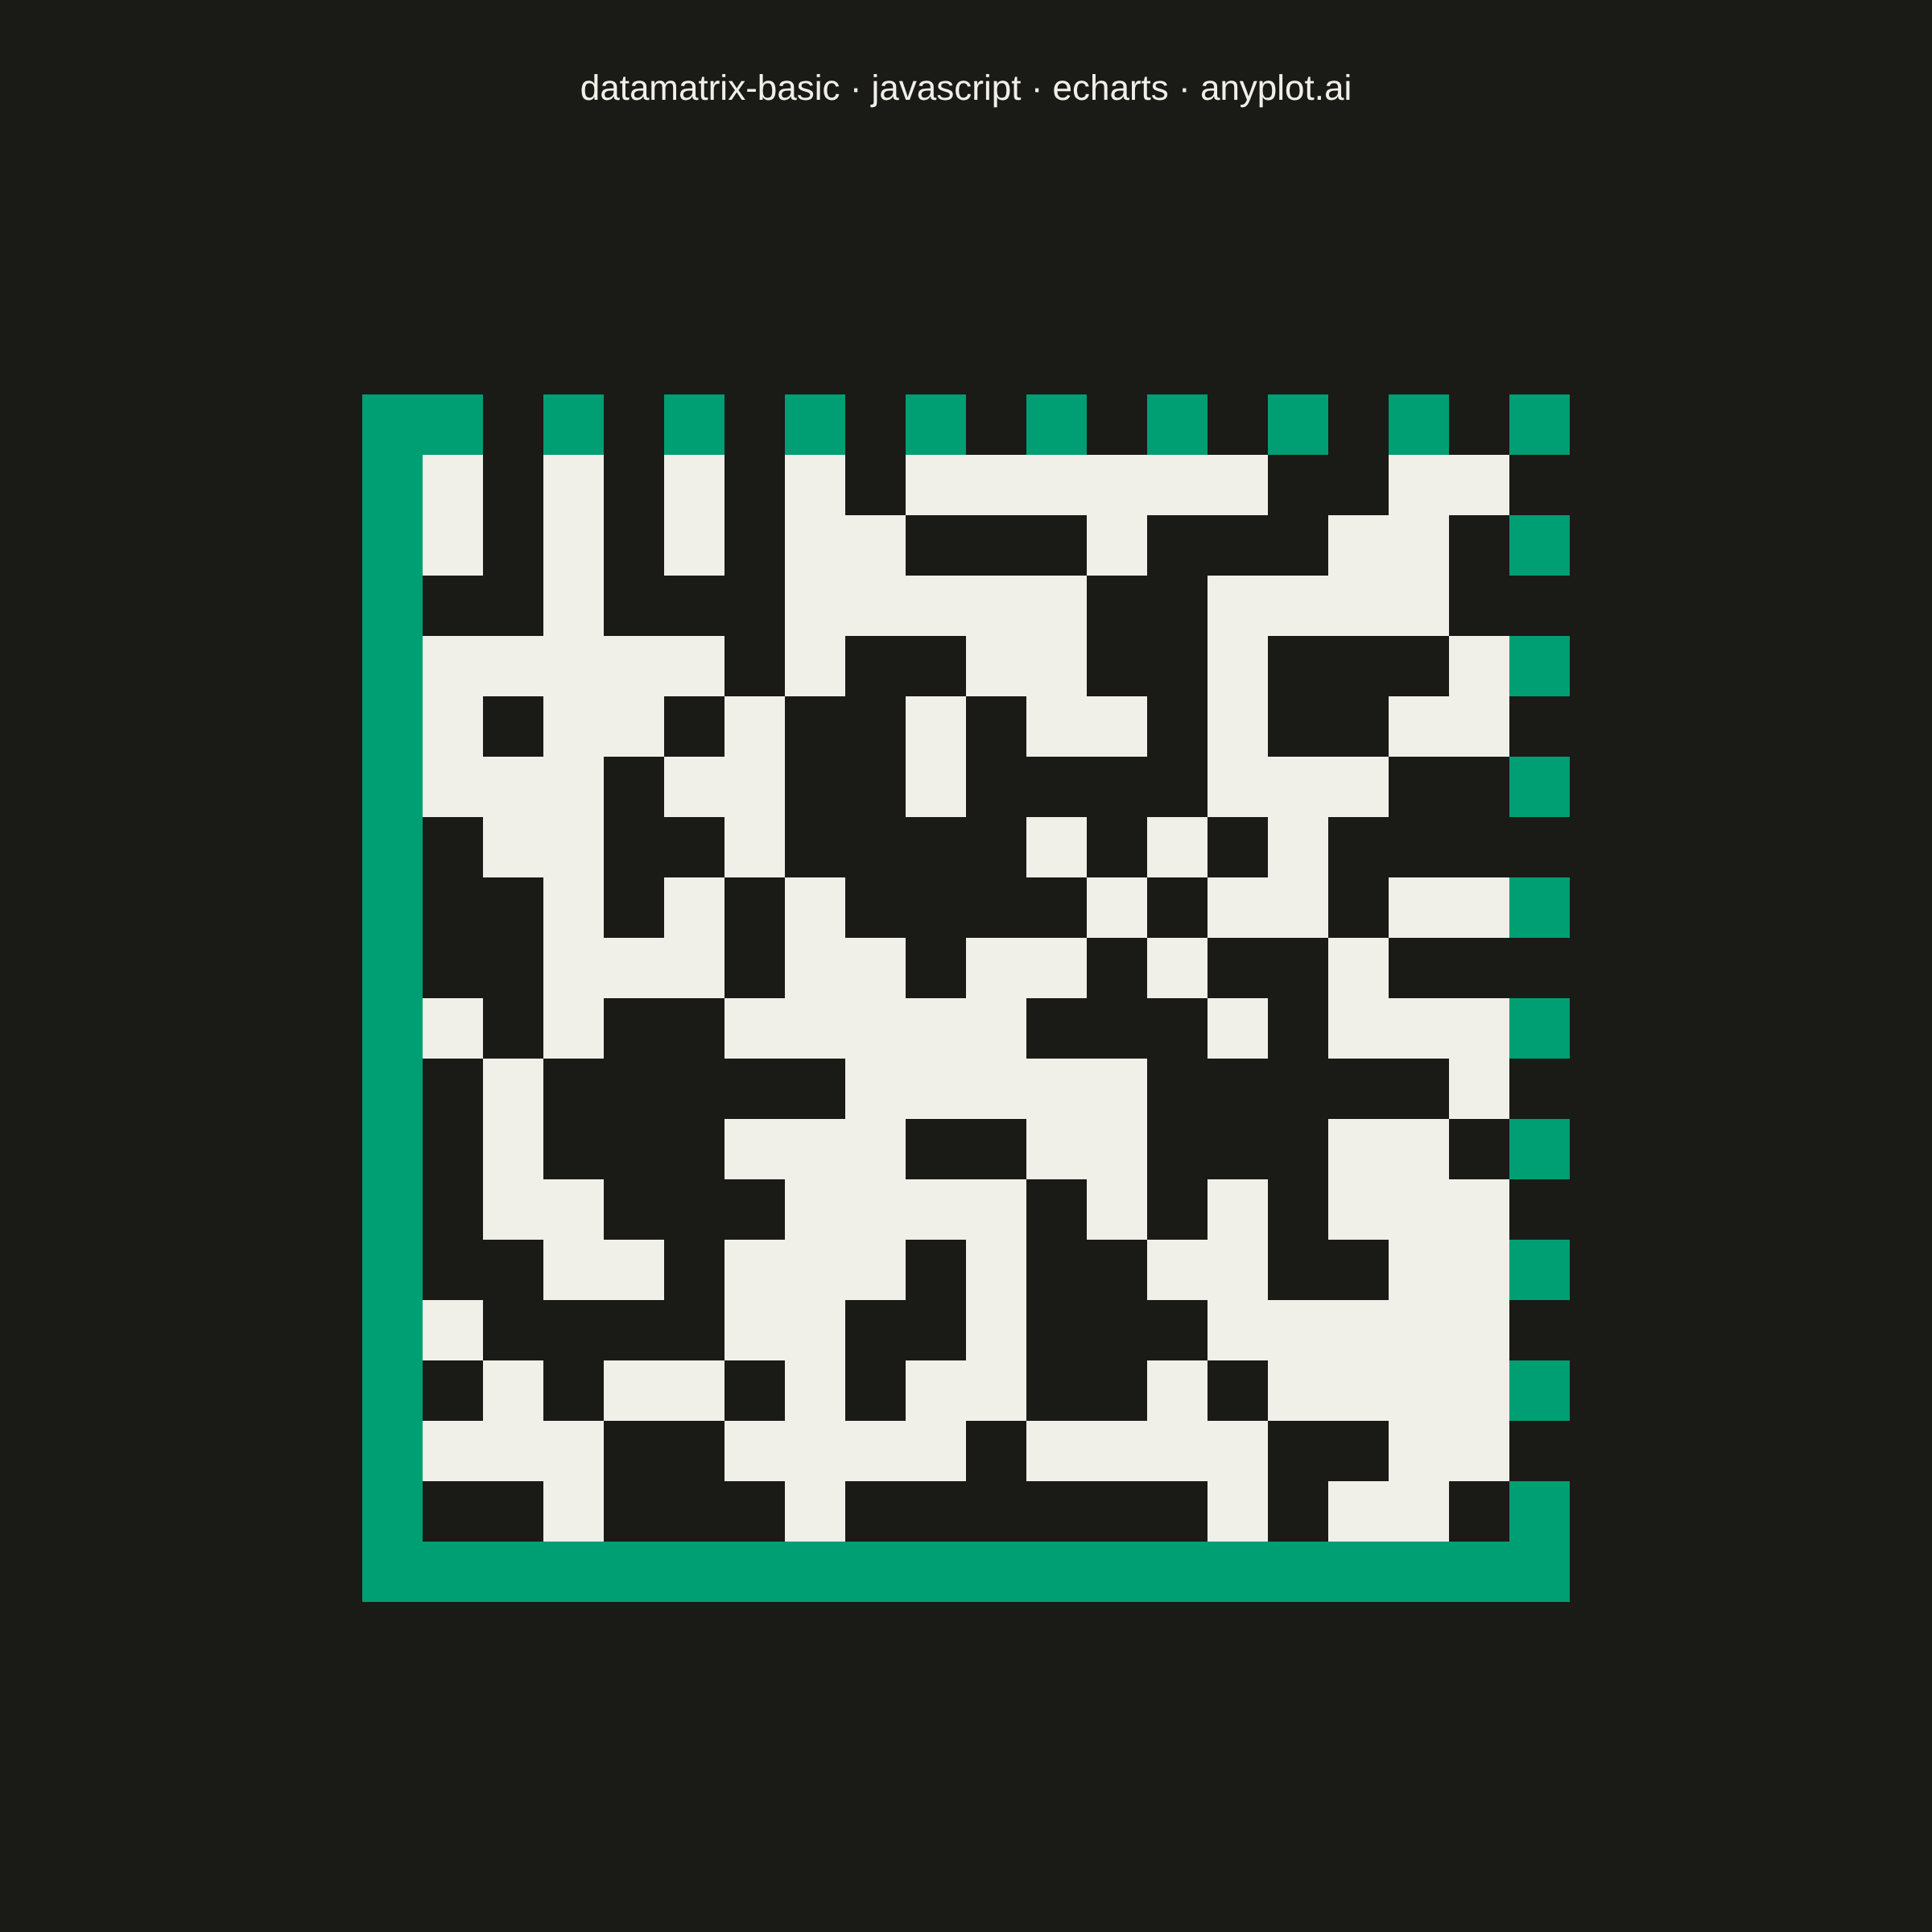
A Data Matrix 2D barcode visualization that encodes data into a compact square or rectangular matrix of black and white cells. Data Matrix codes follow the ISO/IEC 16022 standard, featuring an L-shaped finder pattern (solid borders on two adjacent sides) and alternating timing patterns on the opposite sides. This barcode format is ideal for marking small items and supports high data density with built-in error correction (ECC 200).
// anyplot.ai
// datamatrix-basic: Basic Data Matrix 2D Barcode
// Library: echarts 6.1.0 | JavaScript 22.23.2
// Quality: 91/100 | Created: 2026-09-02
//# anyplot-orientation: square

const t = window.ANYPLOT_TOKENS;

// --- Data (in-memory, deterministic) ----------------------------------------
// ISO/IEC 16022 Data Matrix layout: a solid L-shaped finder pattern runs the
// full left column + bottom row for orientation lock, and an alternating
// "clock track" runs the top row + right column as a module-size reference.
// Everything inside that border is the ECC 200 encoded payload. No barcode
// encoder is available in the browser sandbox, so the interior is filled with
// a deterministic pseudo-random pattern seeded from the payload string — a
// faithful stand-in for the visual density of encoded data, not a scannable
// symbol.
const content = "PART:TRQ-4471/LOT:2609A";
const symbolSize = 20; // modules per side of the encoded symbol (even, per ISO 16022)
const quietZone = 2; // modules of clear space required on every side
const gridSize = symbolSize + quietZone * 2;

const mulberry32 = (seed) => () => {
  seed = (seed + 0x6d2b79f5) | 0;
  let x = Math.imul(seed ^ (seed >>> 15), 1 | seed);
  x = (x + Math.imul(x ^ (x >>> 7), 61 | x)) ^ x;
  return ((x ^ (x >>> 14)) >>> 0) / 4294967296;
};
let seed = 42;
for (let i = 0; i < content.length; i += 1) {
  seed = (seed * 31 + content.charCodeAt(i)) >>> 0;
}
const rand = mulberry32(seed);

const indices = Array.from({ length: gridSize }, (_, i) => String(i));
// Structural modules (finder + timing pattern) are the fixed orientation/
// reference border; payload modules are the ECC 200 stand-in interior. Split
// into two groups so structure and data read as visually distinct regions.
const structuralModules = [];
const payloadModules = [];
for (let row = 0; row < gridSize; row += 1) {
  for (let col = 0; col < gridSize; col += 1) {
    const sRow = row - quietZone;
    const sCol = col - quietZone;
    const inSymbol = sRow >= 0 && sRow < symbolSize && sCol >= 0 && sCol < symbolSize;
    if (!inSymbol) continue; // quiet zone stays blank (page background)

    const onLeftFinder = sCol === 0;
    const onBottomFinder = sRow === 0;
    const onTopTiming = sRow === symbolSize - 1;
    const onRightTiming = sCol === symbolSize - 1;
    const onStructure = onLeftFinder || onBottomFinder || onTopTiming || onRightTiming;

    let dark;
    if (onLeftFinder || onBottomFinder) {
      dark = true; // solid L-shaped finder pattern
    } else if (onTopTiming || onRightTiming) {
      dark = (sRow + sCol) % 2 === 0; // alternating clock/timing pattern
    } else {
      dark = rand() < 0.5; // ECC 200 payload stand-in
    }
    if (!dark) continue;
    (onStructure ? structuralModules : payloadModules).push([String(col), String(row)]);
  }
}

// --- Init ---------------------------------------------------------------
const chart = echarts.init(document.getElementById("container"));

// --- Option ---------------------------------------------------------------
chart.setOption({
  animation: false,
  backgroundColor: "transparent",
  title: {
    text: "datamatrix-basic · javascript · echarts · anyplot.ai",
    left: "center",
    top: 40,
    textStyle: { color: t.ink, fontSize: 22, fontWeight: 500 },
  },
  grid: { left: "center", top: 170, width: 900, height: 900 },
  xAxis: {
    type: "category",
    data: indices,
    axisLine: { show: false },
    axisTick: { show: false },
    axisLabel: { show: false },
    splitLine: { show: false },
  },
  yAxis: {
    type: "category",
    data: indices,
    axisLine: { show: false },
    axisTick: { show: false },
    axisLabel: { show: false },
    splitLine: { show: false },
  },
  series: [
    {
      // Finder + timing pattern (fixed orientation/reference border) render
      // in the Imprint brand green (palette[0]), a theme-independent accent
      // that gives the reader a visual hierarchy cue distinguishing the
      // symbol's structural chrome from its encoded payload.
      type: "custom",
      coordinateSystem: "cartesian2d",
      data: structuralModules,
      renderItem: (params, api) => {
        const center = api.coord([api.value(0), api.value(1)]);
        const size = api.size([1, 1]);
        return {
          type: "rect",
          shape: {
            x: center[0] - size[0] / 2,
            y: center[1] - size[1] / 2,
            width: size[0],
            height: size[1],
          },
          style: { fill: t.palette[0] },
          silent: true,
        };
      },
      z: 1,
    },
    {
      // Payload modules stay in ink/page-background: the spec mandates
      // "high contrast black on white for maximum readability" for the
      // encoded ECC 200 data region.
      type: "custom",
      coordinateSystem: "cartesian2d",
      data: payloadModules,
      renderItem: (params, api) => {
        const center = api.coord([api.value(0), api.value(1)]);
        const size = api.size([1, 1]);
        return {
          type: "rect",
          shape: {
            x: center[0] - size[0] / 2,
            y: center[1] - size[1] / 2,
            width: size[0],
            height: size[1],
          },
          style: { fill: t.ink },
          silent: true,
        };
      },
      z: 1,
    },
  ],
});

chart.on("finished", () => {
  window.__anyplotReady = true;
});
Runnable source as JSON, for any HTTP client: https://api.anyplot.ai/specs/datamatrix-basic/echarts/code. Any spec id and library id listed in llms-full.txt fit the same URL shape; every URL below is complete and callable.
{
  "spec_id": "datamatrix-basic",
  "language": "javascript",
  "library": "echarts",
  "page": "https://anyplot.ai/datamatrix-basic/javascript/echarts",
  "hub": "https://anyplot.ai/datamatrix-basic",
  "code_json": "https://api.anyplot.ai/specs/datamatrix-basic/echarts/code",
  "spec_json": "https://api.anyplot.ai/specs/datamatrix-basic",
  "render_light_png": "https://storage.googleapis.com/anyplot-images/plots/datamatrix-basic/javascript/echarts/plot-light.png",
  "render_dark_png": "https://storage.googleapis.com/anyplot-images/plots/datamatrix-basic/javascript/echarts/plot-dark.png",
  "interactive_light_html": "https://storage.googleapis.com/anyplot-images/plots/datamatrix-basic/javascript/echarts/plot-light.html",
  "interactive_dark_html": "https://storage.googleapis.com/anyplot-images/plots/datamatrix-basic/javascript/echarts/plot-dark.html",
  "quality_score": 91.0,
  "license": "MIT",
  "guide": "https://anyplot.ai/llms.txt"
}
Part of Basic Data Matrix 2D Barcode on anyplot.ai.