The same plot in 14 other libraries — JavaScript: Chart.js, D3.js, Apache ECharts, MUI X Charts; Python: Altair, Bokeh, lets-plot, Matplotlib, Plotly, plotnine, Pygal, Seaborn; R: ggplot2; Julia: Makie.jl. Compare all 15 side by side: Basic Data Matrix 2D Barcode in Python, R, Julia and JavaScript.
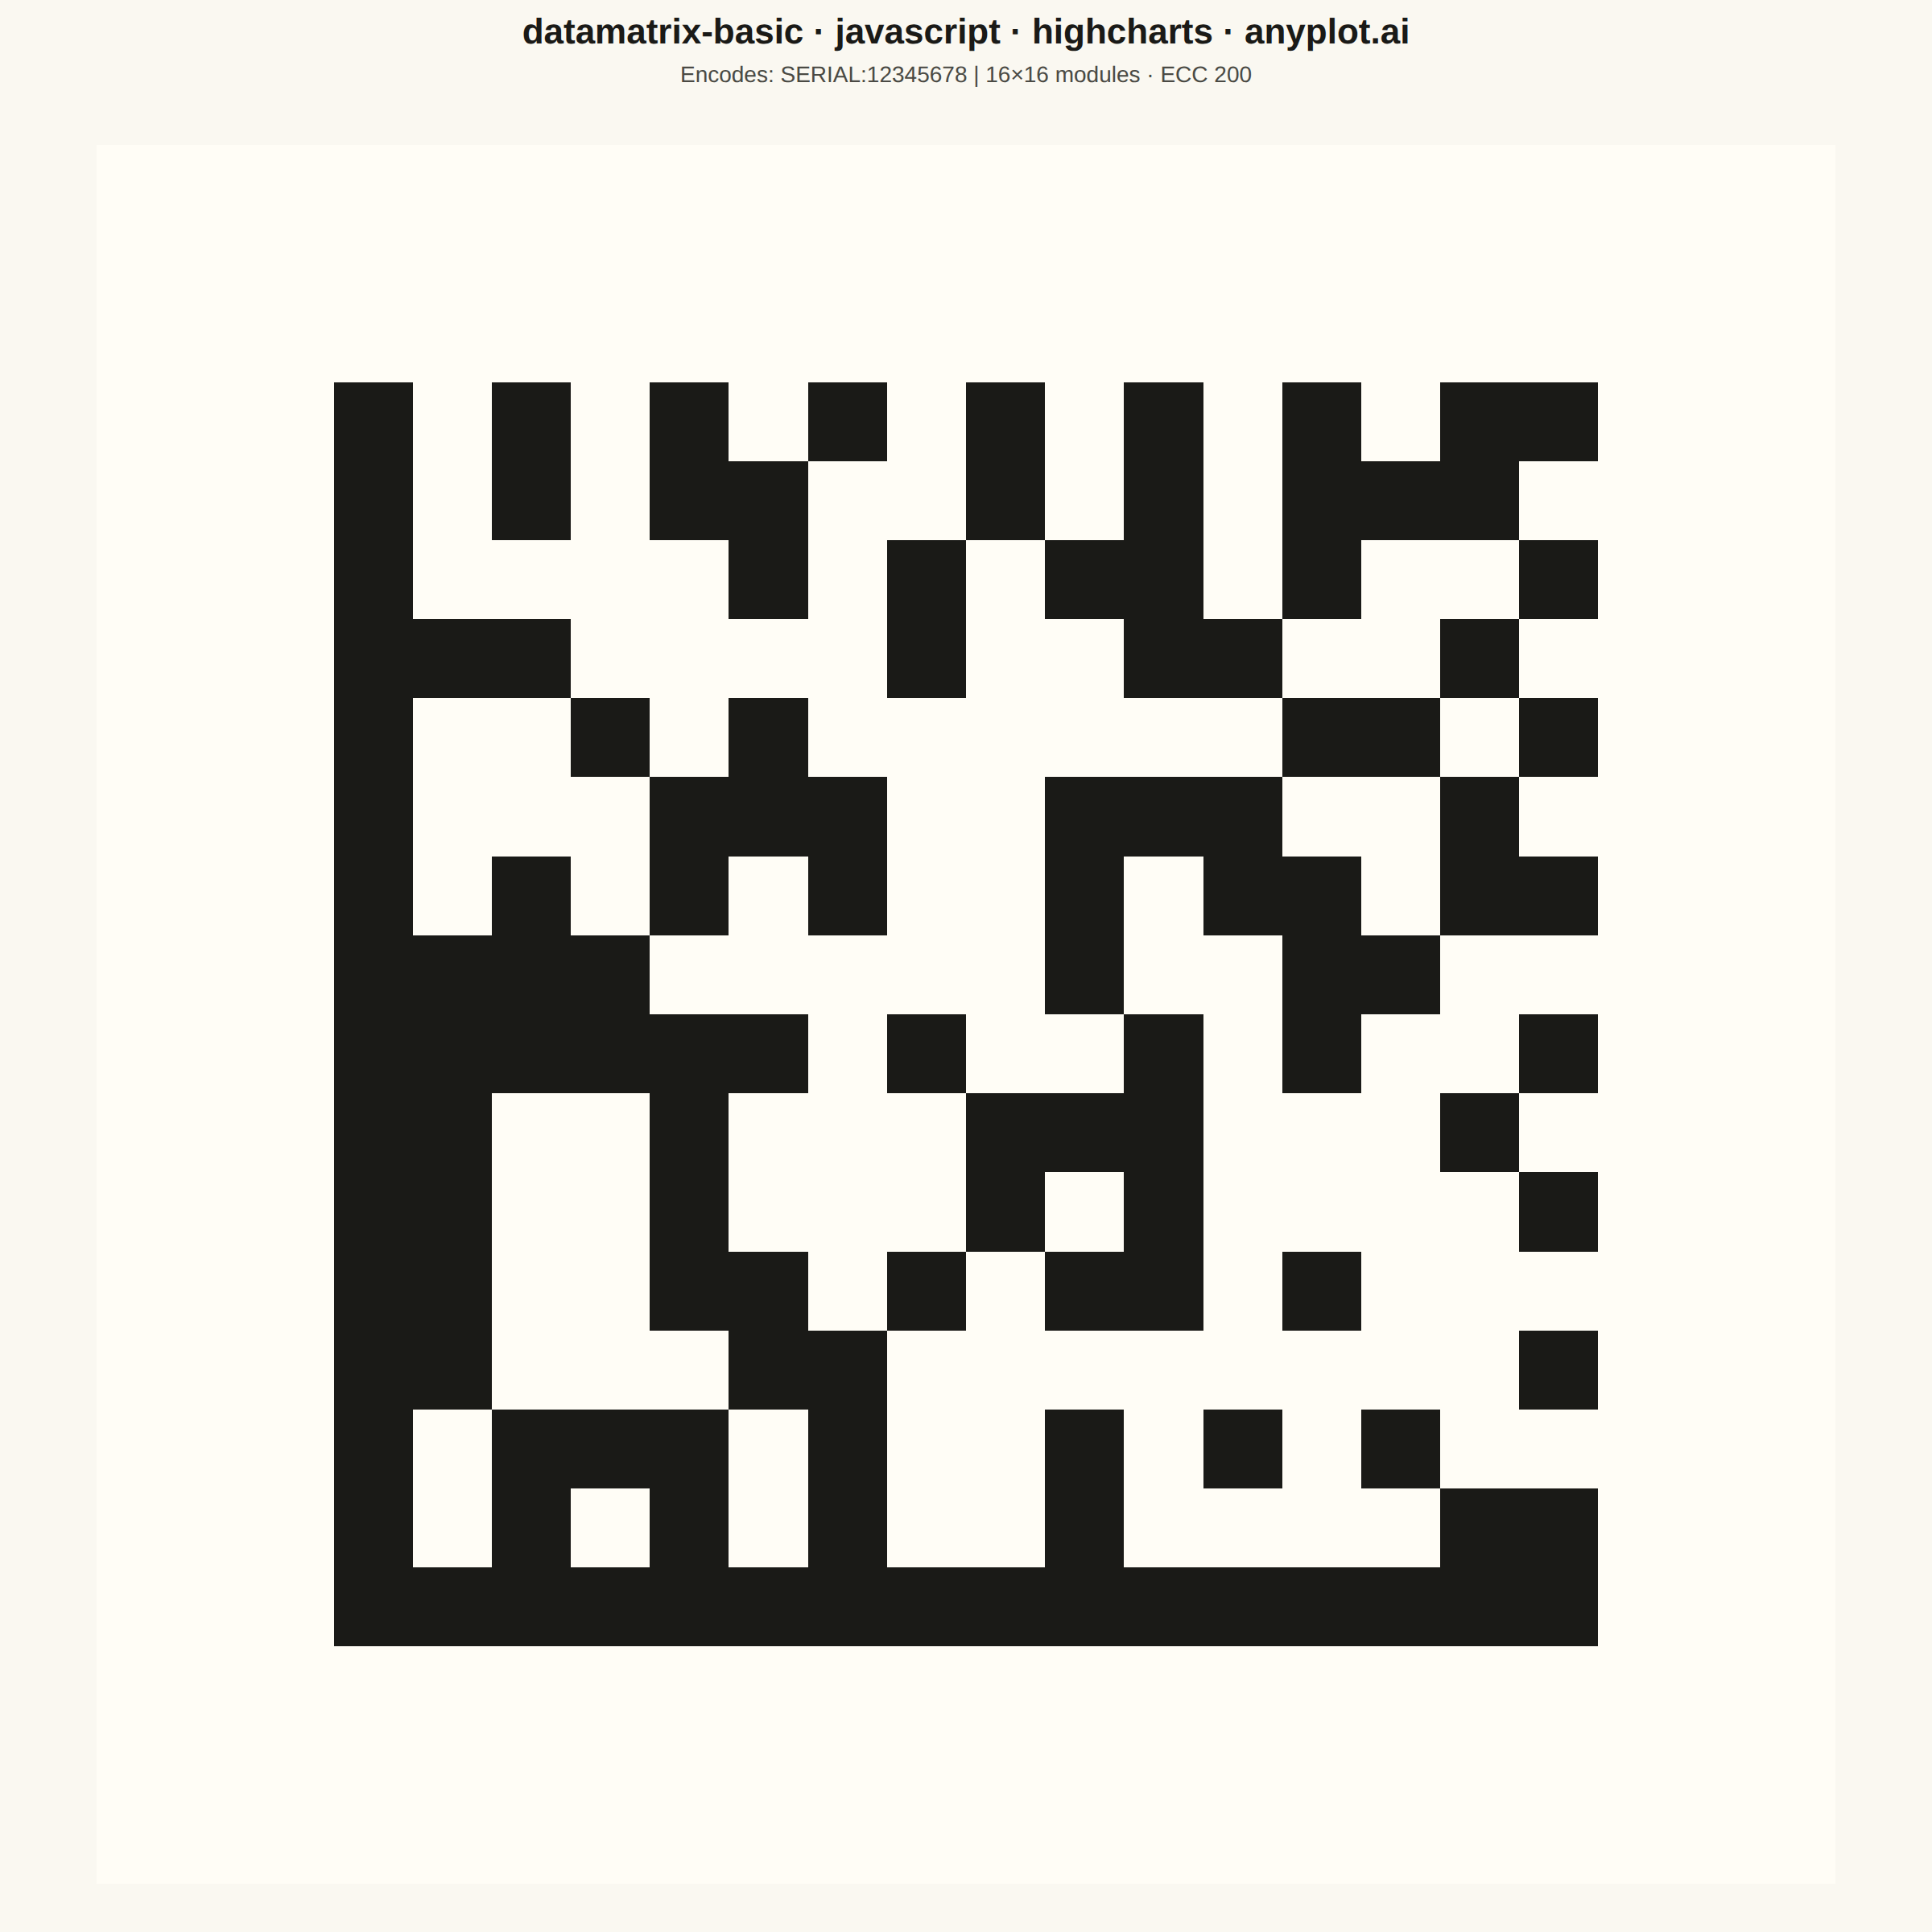
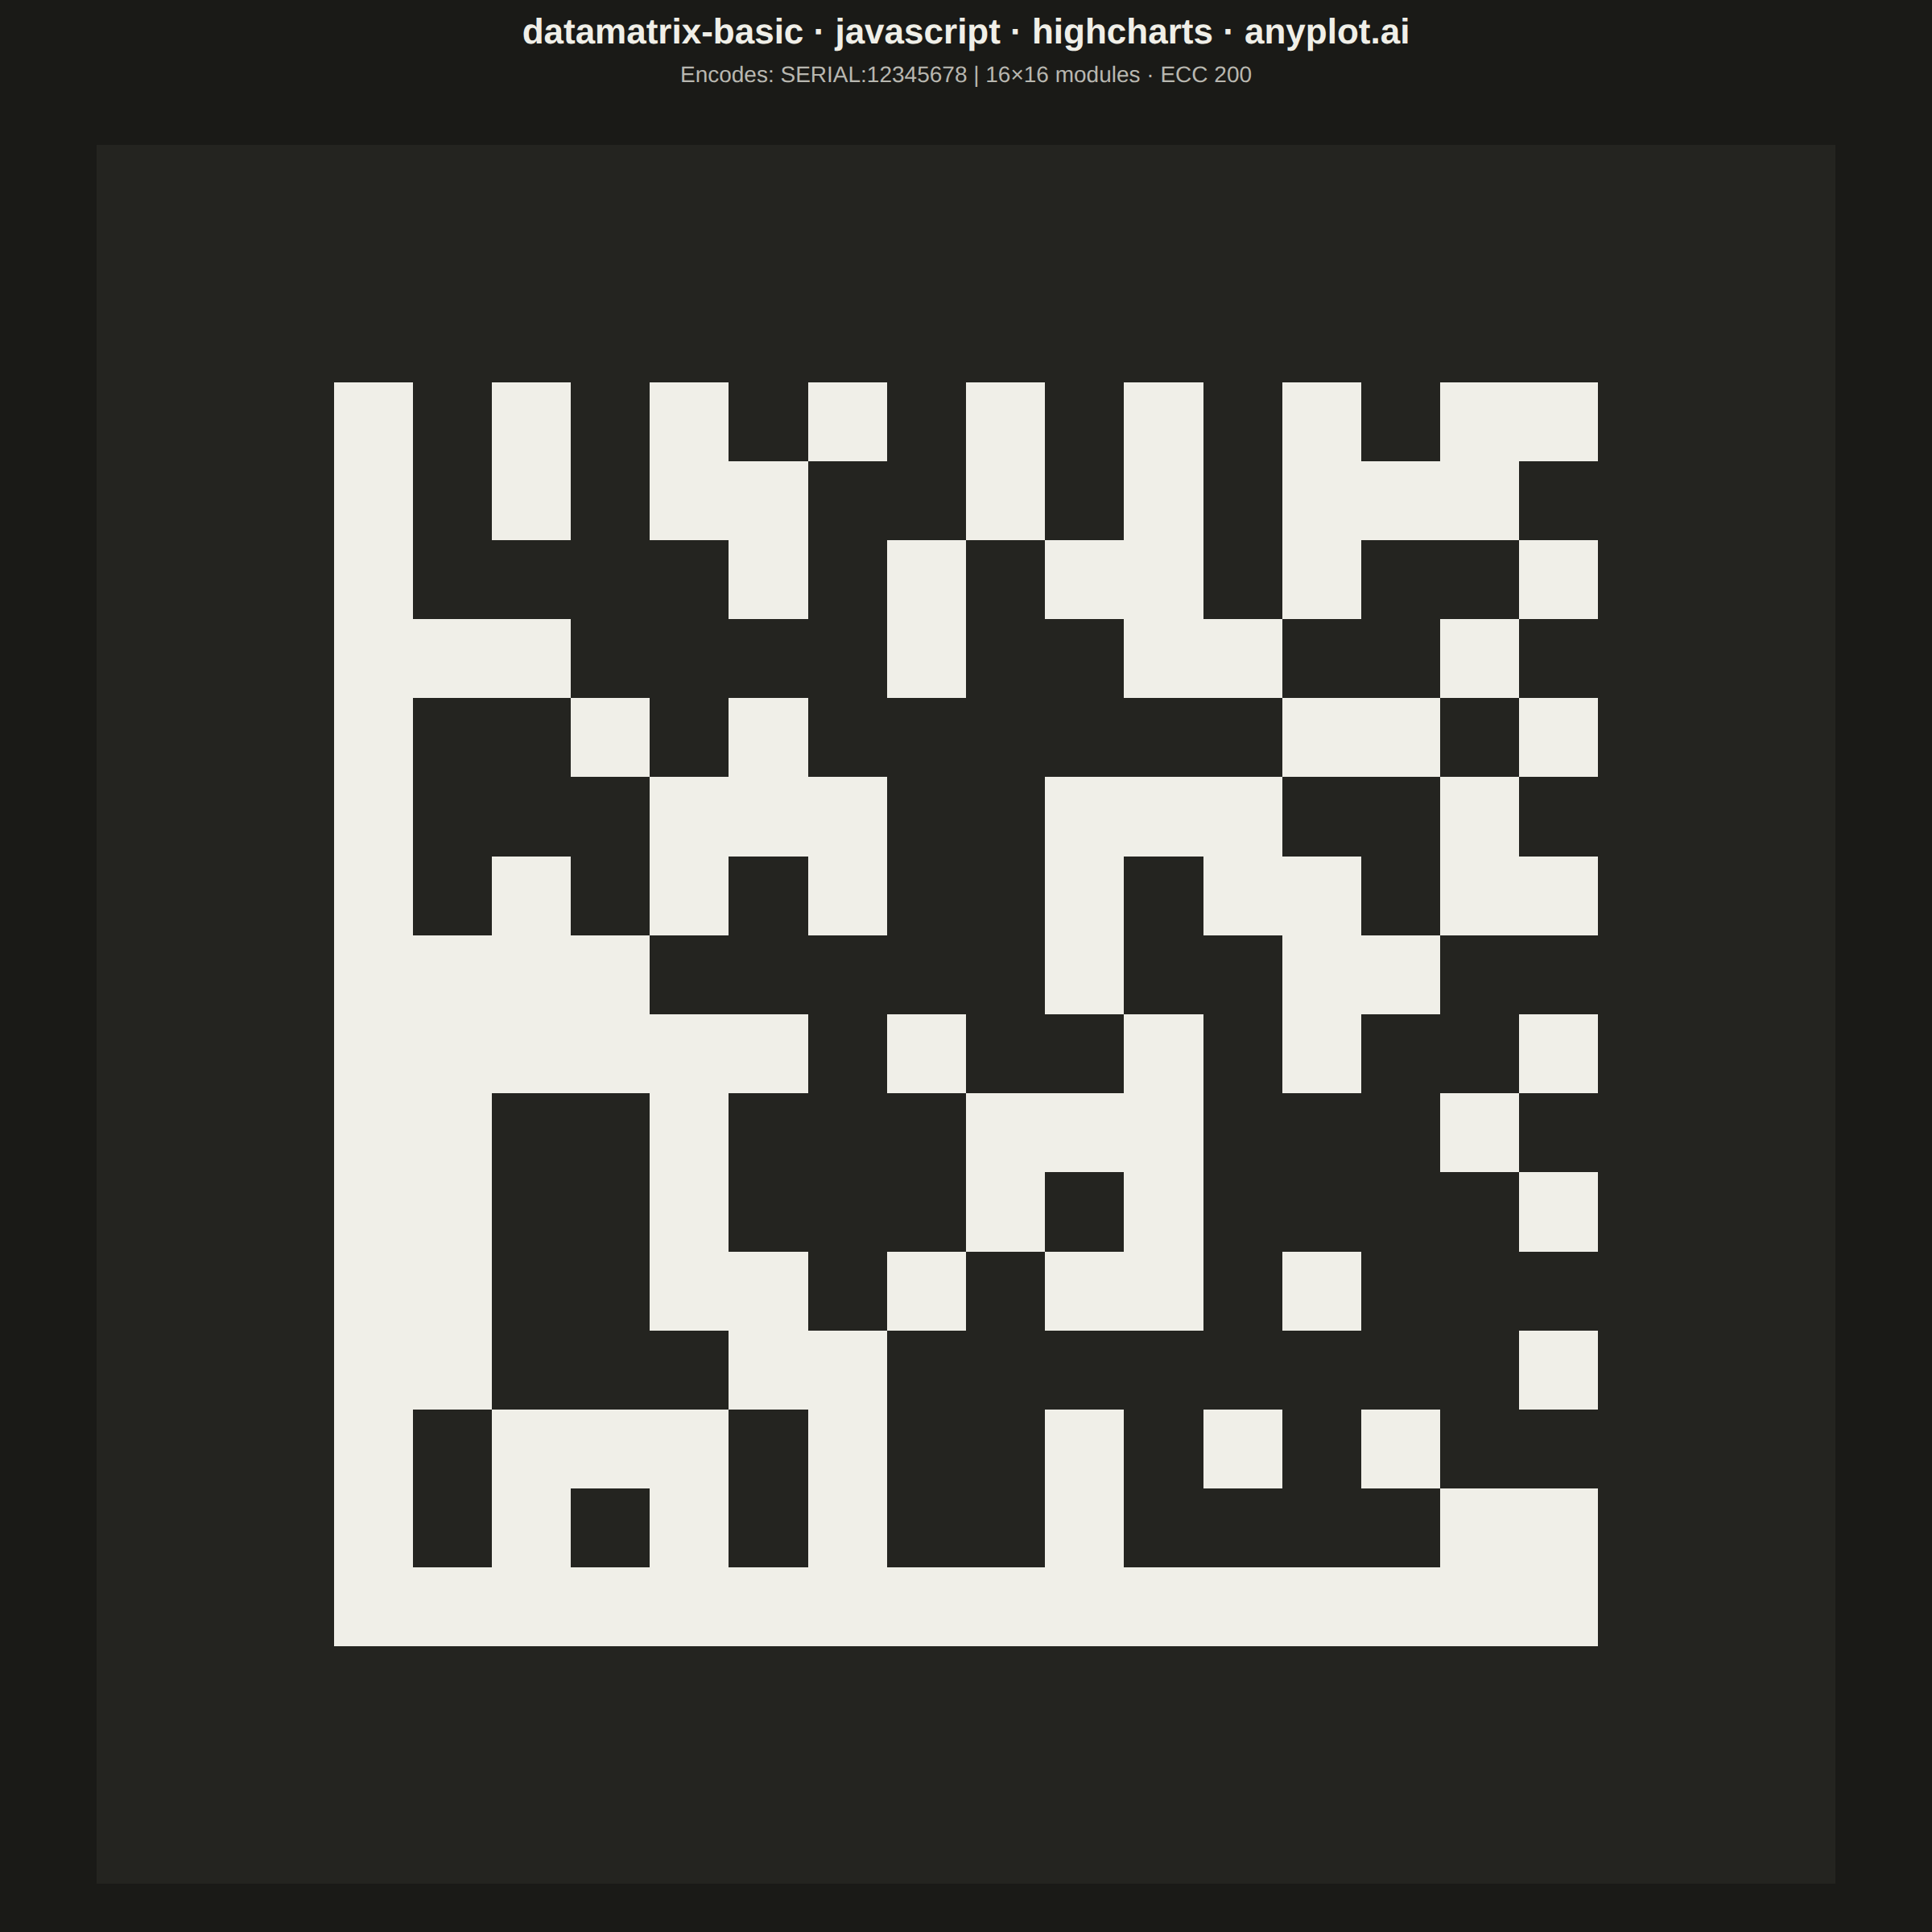
A Data Matrix 2D barcode visualization that encodes data into a compact square or rectangular matrix of black and white cells. Data Matrix codes follow the ISO/IEC 16022 standard, featuring an L-shaped finder pattern (solid borders on two adjacent sides) and alternating timing patterns on the opposite sides. This barcode format is ideal for marking small items and supports high data density with built-in error correction (ECC 200).
// anyplot.ai
// datamatrix-basic: Basic Data Matrix 2D Barcode
// Library: highcharts 12.6.0 | JavaScript 22.23.2
// Quality: 90/100 | Created: 2026-09-02
//# anyplot-orientation: square

const t = window.ANYPLOT_TOKENS;

// Real ECC 200 Data Matrix, 16x16 modules, encoding "SERIAL:12345678"
// (ASCII encodation: letters/':' as ASCII+1, digit pairs 12/34/56/78 as
// value+130, padded with codeword 129; GF(256) Reed-Solomon over the ISO
// 16022 field poly 0x12D with 12 correction codewords; module placement via
// the standard ISO/IEC 16022 Annex F "utah" corner-wrap algorithm). Row 0 and
// the last column carry the alternating timing pattern; column 0 and the
// last row carry the solid L-shaped finder pattern.
const DM_MATRIX = [
  [1,0,1,0,1,0,1,0,1,0,1,0,1,0,1,1],
  [1,0,1,0,1,1,0,0,1,0,1,0,1,1,1,0],
  [1,0,0,0,0,1,0,1,0,1,1,0,1,0,0,1],
  [1,1,1,0,0,0,0,1,0,0,1,1,0,0,1,0],
  [1,0,0,1,0,1,0,0,0,0,0,0,1,1,0,1],
  [1,0,0,0,1,1,1,0,0,1,1,1,0,0,1,0],
  [1,0,1,0,1,0,1,0,0,1,0,1,1,0,1,1],
  [1,1,1,1,0,0,0,0,0,1,0,0,1,1,0,0],
  [1,1,1,1,1,1,0,1,0,0,1,0,1,0,0,1],
  [1,1,0,0,1,0,0,0,1,1,1,0,0,0,1,0],
  [1,1,0,0,1,0,0,0,1,0,1,0,0,0,0,1],
  [1,1,0,0,1,1,0,1,0,1,1,0,1,0,0,0],
  [1,1,0,0,0,1,1,0,0,0,0,0,0,0,0,1],
  [1,0,1,1,1,0,1,0,0,1,0,1,0,1,0,0],
  [1,0,1,0,1,0,1,0,0,1,0,0,0,0,1,1],
  [1,1,1,1,1,1,1,1,1,1,1,1,1,1,1,1],
];

const ENCODED_CONTENT = "SERIAL:12345678";
const TITLE = "datamatrix-basic · javascript · highcharts · anyplot.ai";

// Module colors: dark ink on cream (light) / near-white on near-black (dark)
const MODULE_COLOR = t.ink;
// Elevated (not page) background so the quiet zone reads as a distinct
// region against the page in both themes, not just in light mode.
const DM_BG = t.elevatedBg;

// Chart — square, transparent background, no axes
const chart = Highcharts.chart("container", {
  chart: {
    backgroundColor: "transparent",
    animation: false,
    style: { fontFamily: "inherit" },
    margin: [90, 60, 30, 60],
  },
  credits: { enabled: false },
  colors: t.palette,
  title: {
    text: TITLE,
    style: { color: t.ink, fontSize: "22px", fontWeight: "600" },
    margin: 20,
  },
  subtitle: {
    text: "Encodes: " + ENCODED_CONTENT + "  |  16×16 modules  ·  ECC 200",
    style: { color: t.inkSoft, fontSize: "14px" },
  },
  xAxis: { visible: false },
  yAxis: { visible: false },
  legend: { enabled: false },
  plotOptions: { series: { animation: false } },
  series: [],
});

// Draw the Data Matrix using the Highcharts SVG renderer
const dmSize = DM_MATRIX.length; // 16 modules
const quietZone = 3; // >= 1 module quiet zone required for reliable scanning
const totalMods = dmSize + 2 * quietZone;

const plotW = chart.plotWidth;
const plotH = chart.plotHeight;

// Center a square code area within the plot area
const codeAreaSize = Math.min(plotW, plotH);
const offsetX = chart.plotLeft + (plotW - codeAreaSize) / 2;
const offsetY = chart.plotTop + (plotH - codeAreaSize) / 2;

const cellSize = codeAreaSize / totalMods;

// Quiet-zone background
chart.renderer
  .rect(offsetX, offsetY, codeAreaSize, codeAreaSize)
  .attr({ fill: DM_BG, zIndex: 3, "shape-rendering": "crispEdges" })
  .add();

// Dark modules (finder L-pattern, timing pattern, and encoded data region)
for (let row = 0; row < dmSize; row++) {
  for (let col = 0; col < dmSize; col++) {
    if (DM_MATRIX[row][col]) {
      chart.renderer
        .rect(
          offsetX + (col + quietZone) * cellSize,
          offsetY + (row + quietZone) * cellSize,
          cellSize,
          cellSize
        )
        .attr({ fill: MODULE_COLOR, zIndex: 4, "shape-rendering": "crispEdges" })
        .add();
    }
  }
}
Runnable source as JSON, for any HTTP client: https://api.anyplot.ai/specs/datamatrix-basic/highcharts/code. Any spec id and library id listed in llms-full.txt fit the same URL shape; every URL below is complete and callable.
{
  "spec_id": "datamatrix-basic",
  "language": "javascript",
  "library": "highcharts",
  "page": "https://anyplot.ai/datamatrix-basic/javascript/highcharts",
  "hub": "https://anyplot.ai/datamatrix-basic",
  "code_json": "https://api.anyplot.ai/specs/datamatrix-basic/highcharts/code",
  "spec_json": "https://api.anyplot.ai/specs/datamatrix-basic",
  "render_light_png": "https://storage.googleapis.com/anyplot-images/plots/datamatrix-basic/javascript/highcharts/plot-light.png",
  "render_dark_png": "https://storage.googleapis.com/anyplot-images/plots/datamatrix-basic/javascript/highcharts/plot-dark.png",
  "interactive_light_html": "https://storage.googleapis.com/anyplot-images/plots/datamatrix-basic/javascript/highcharts/plot-light.html",
  "interactive_dark_html": "https://storage.googleapis.com/anyplot-images/plots/datamatrix-basic/javascript/highcharts/plot-dark.html",
  "quality_score": 90.0,
  "license": "MIT",
  "guide": "https://anyplot.ai/llms.txt"
}
Part of Basic Data Matrix 2D Barcode on anyplot.ai.