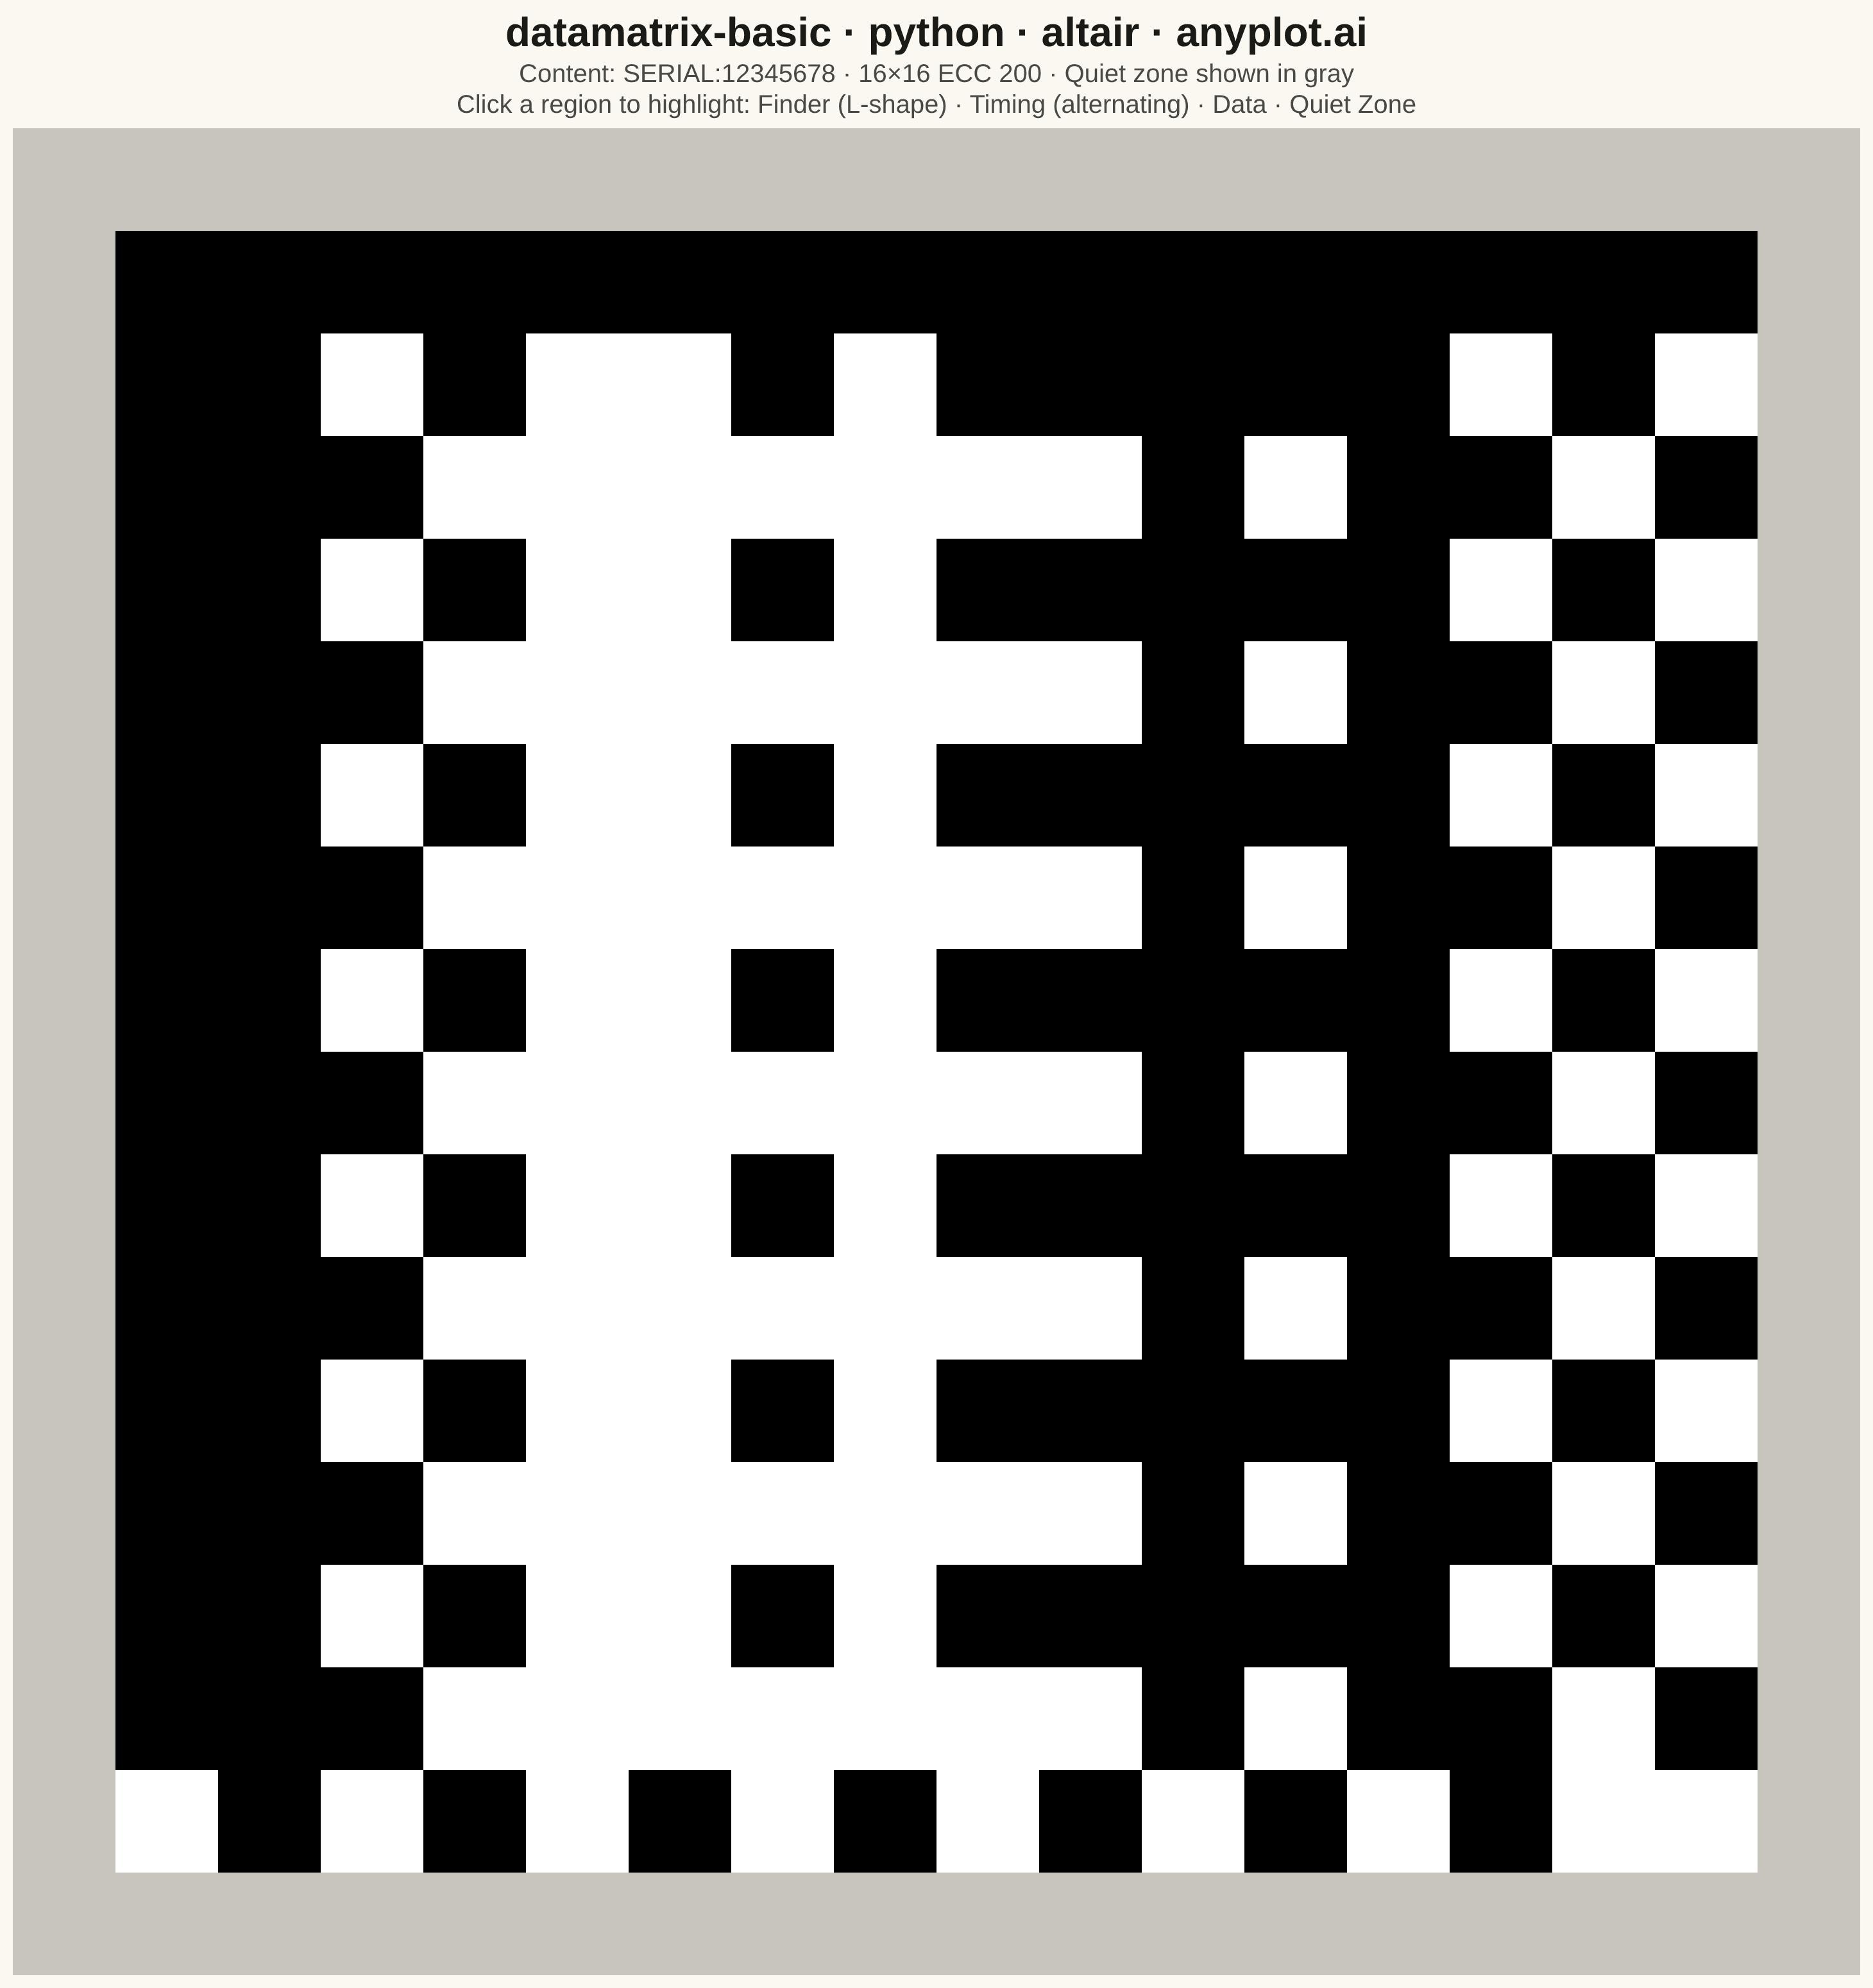
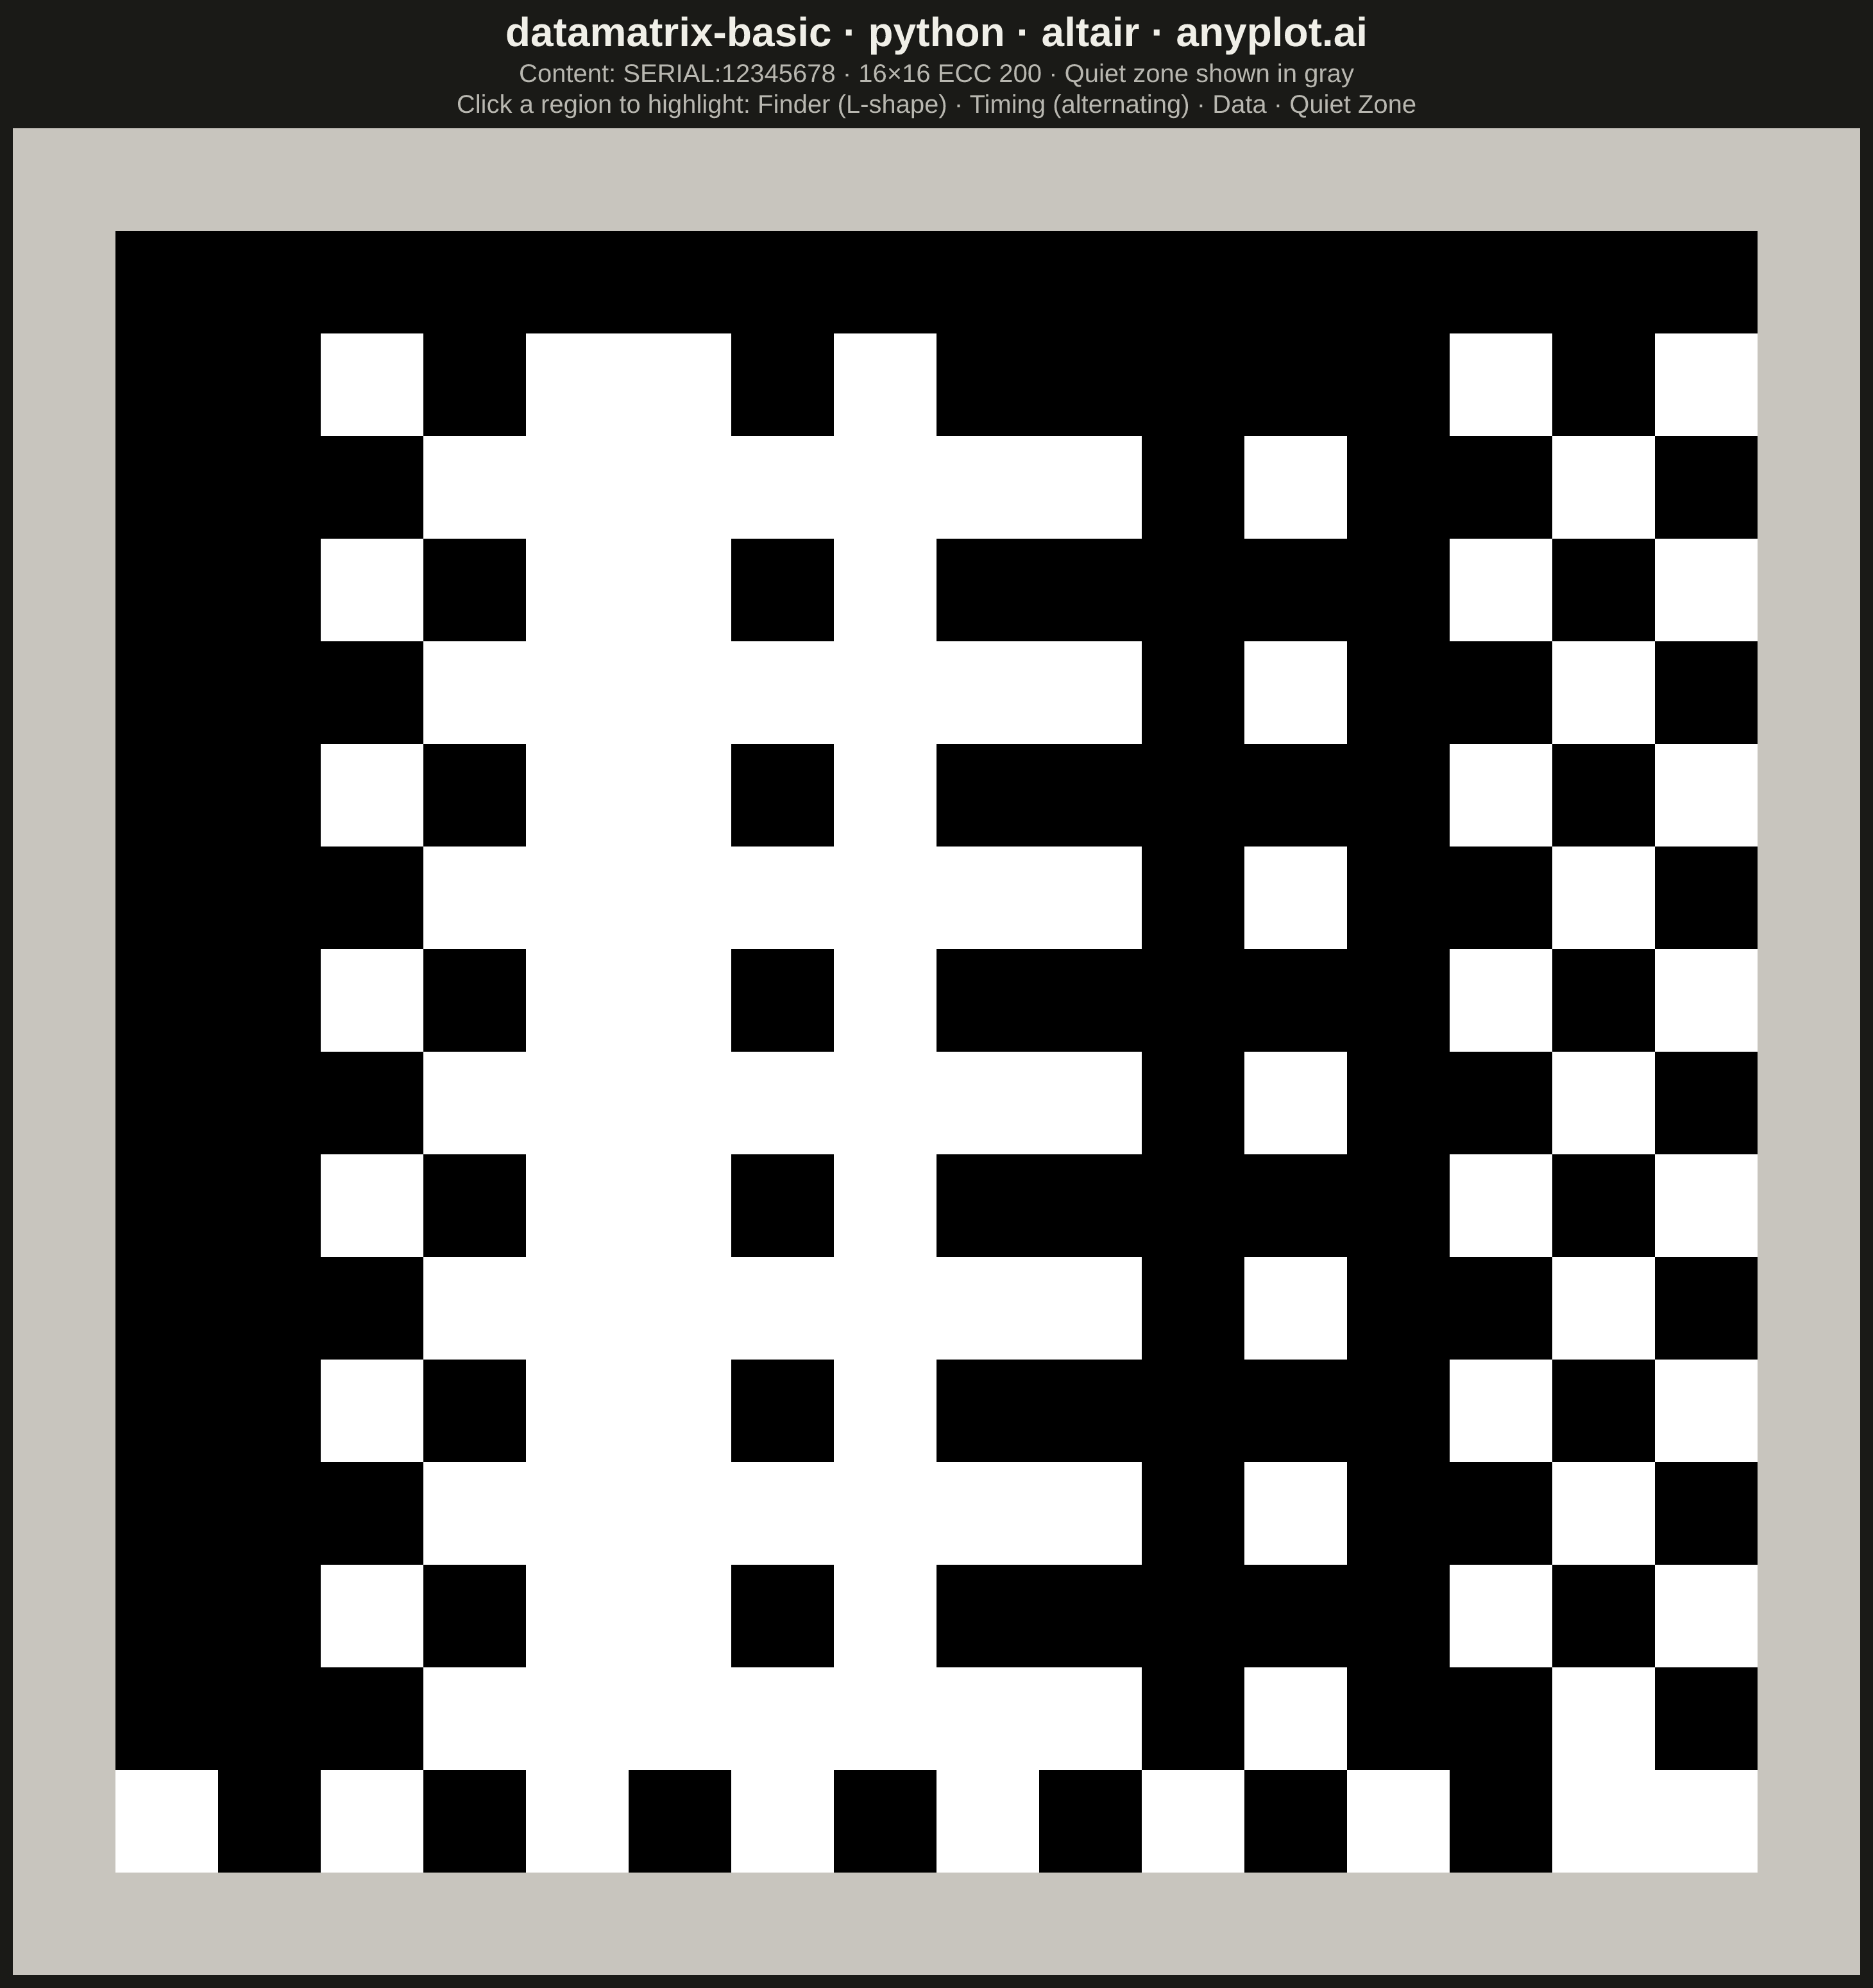
A Data Matrix 2D barcode visualization that encodes data into a compact square or rectangular matrix of black and white cells. Data Matrix codes follow the ISO/IEC 16022 standard, featuring an L-shaped finder pattern (solid borders on two adjacent sides) and alternating timing patterns on the opposite sides. This barcode format is ideal for marking small items and supports high data density with built-in error correction (ECC 200).
""" anyplot.ai
datamatrix-basic: Basic Data Matrix 2D Barcode
Library: altair 6.1.0 | Python 3.13.13
Quality: 90/100 | Updated: 2026-05-20
"""

import os
import sys
import zlib


# Remove this file's directory from sys.path to avoid circular import with the altair package
if sys.path and os.path.exists(os.path.join(sys.path[0] or ".", "altair.py")):
    sys.path = sys.path[1:]

import altair as alt
import numpy as np
import pandas as pd


# Theme tokens
THEME = os.getenv("ANYPLOT_THEME", "light")
PAGE_BG = "#FAF8F1" if THEME == "light" else "#1A1A17"
INK = "#1A1A17" if THEME == "light" else "#F0EFE8"
INK_SOFT = "#4A4A44" if THEME == "light" else "#B8B7B0"
QUIET_FILL = "#C8C5BE"  # warm gray on white inner bg shows quiet zone in both themes

# Data — 16×16 Data Matrix ECC 200 barcode encoding "SERIAL:12345678"
np.random.seed(42)
size = 16
quiet_zone = 1  # minimum 1 module per spec
total_size = size + 2 * quiet_zone  # 18

matrix = np.zeros((total_size, total_size), dtype=int)

# L-shaped finder pattern: solid black on left and bottom edges
for row in range(size):
    matrix[quiet_zone + row, quiet_zone] = 1
for col in range(size):
    matrix[quiet_zone + size - 1, quiet_zone + col] = 1

# Alternating timing pattern on top and right edges
for col in range(size):
    matrix[quiet_zone, quiet_zone + col] = col % 2
for row in range(size):
    matrix[quiet_zone + row, quiet_zone + size - 1] = row % 2

# Interior data area: deterministic bit pattern derived from content
content = "SERIAL:12345678"
hash_val = zlib.crc32(content.encode())  # zlib.crc32 is deterministic unlike hash()
for row in range(1, size - 1):
    for col in range(1, size - 1):
        idx = row * size + col
        matrix[quiet_zone + row, quiet_zone + col] = ((hash_val >> (idx % 32)) ^ (idx * 13)) % 2

# Convert to DataFrame; color_key collapses cell_type × value for Altair's color encoding
rows = []
for row in range(total_size):
    for col in range(total_size):
        r, c = row - quiet_zone, col - quiet_zone
        if r < 0 or r >= size or c < 0 or c >= size:
            cell_type = "Quiet Zone"
        elif c == 0 or r == size - 1:
            cell_type = "Finder Pattern"
        elif r == 0 or c == size - 1:
            cell_type = "Timing Pattern"
        else:
            cell_type = "Data Cell"
        val = matrix[row, col]
        color_key = "quiet" if cell_type == "Quiet Zone" else ("on" if val == 1 else "off")
        rows.append(
            {
                "x": col,
                "y": total_size - 1 - row,  # flip y so row=0 maps to chart top
                "value": val,
                "cell_type": cell_type,
                "color_key": color_key,
            }
        )
df = pd.DataFrame(rows)

# Interactive selection — click a region type to highlight it; empty=True keeps all opaque when idle
region_sel = alt.selection_point(fields=["cell_type"], on="click", empty=True, clear="dblclick")

# 720×720 plot area: 18 cells × 40 px/cell = 720 px (integer — eliminates sub-pixel gap artifacts)
no_pad = alt.Scale(paddingInner=0, paddingOuter=0)
color_scale = alt.Scale(domain=["on", "off", "quiet"], range=["#000000", "#FFFFFF", QUIET_FILL])

chart = (
    alt.Chart(df)
    .mark_rect(stroke=None)
    .encode(
        x=alt.X("x:O", axis=None, scale=no_pad),
        y=alt.Y("y:O", axis=None, scale=no_pad),
        color=alt.Color("color_key:N", scale=color_scale, legend=None),
        opacity=alt.condition(region_sel, alt.value(1.0), alt.value(0.35)),
        tooltip=[
            alt.Tooltip("cell_type:N", title="Region"),
            alt.Tooltip("x:O", title="Column"),
            alt.Tooltip("y:O", title="Row"),
        ],
    )
    .add_params(region_sel)
    .properties(
        width=720,
        height=720,
        background=PAGE_BG,
        title=alt.Title(
            "datamatrix-basic · python · altair · anyplot.ai",
            subtitle=[
                "Content: SERIAL:12345678  ·  16×16 ECC 200  ·  Quiet zone shown in gray",
                "Click a region to highlight: Finder (L-shape) · Timing (alternating) · Data · Quiet Zone",
            ],
            fontSize=16,
            subtitleFontSize=10,
            color=INK,
            subtitleColor=INK_SOFT,
            anchor="middle",
        ),
    )
    .configure_view(fill="#FFFFFF", strokeWidth=0)
    .configure_axis(grid=False)
)

# Save
chart.save(f"plot-{THEME}.png", scale_factor=4.0)
chart.save(f"plot-{THEME}.html")
Runnable source as JSON, for any HTTP client: https://api.anyplot.ai/specs/datamatrix-basic/altair/code. Any spec id and library id listed in llms-full.txt fit the same URL shape; every URL below is complete and callable.
{
  "spec_id": "datamatrix-basic",
  "language": "python",
  "library": "altair",
  "page": "https://anyplot.ai/datamatrix-basic/python/altair",
  "hub": "https://anyplot.ai/datamatrix-basic",
  "code_json": "https://api.anyplot.ai/specs/datamatrix-basic/altair/code",
  "spec_json": "https://api.anyplot.ai/specs/datamatrix-basic",
  "render_light_png": "https://storage.googleapis.com/anyplot-images/plots/datamatrix-basic/python/altair/plot-light.png",
  "render_dark_png": "https://storage.googleapis.com/anyplot-images/plots/datamatrix-basic/python/altair/plot-dark.png",
  "interactive_light_html": "https://storage.googleapis.com/anyplot-images/plots/datamatrix-basic/python/altair/plot-light.html",
  "interactive_dark_html": "https://storage.googleapis.com/anyplot-images/plots/datamatrix-basic/python/altair/plot-dark.html",
  "quality_score": 90.0,
  "license": "MIT",
  "guide": "https://anyplot.ai/llms.txt"
}
Part of Basic Data Matrix 2D Barcode on anyplot.ai.