Source code in 15 libraries — Python: Altair, Bokeh, lets-plot, Matplotlib, Plotly, plotnine, Pygal, Seaborn; R: ggplot2; Julia: Makie.jl; JavaScript: Chart.js, D3.js, Apache ECharts, Highcharts, MUI X Charts.
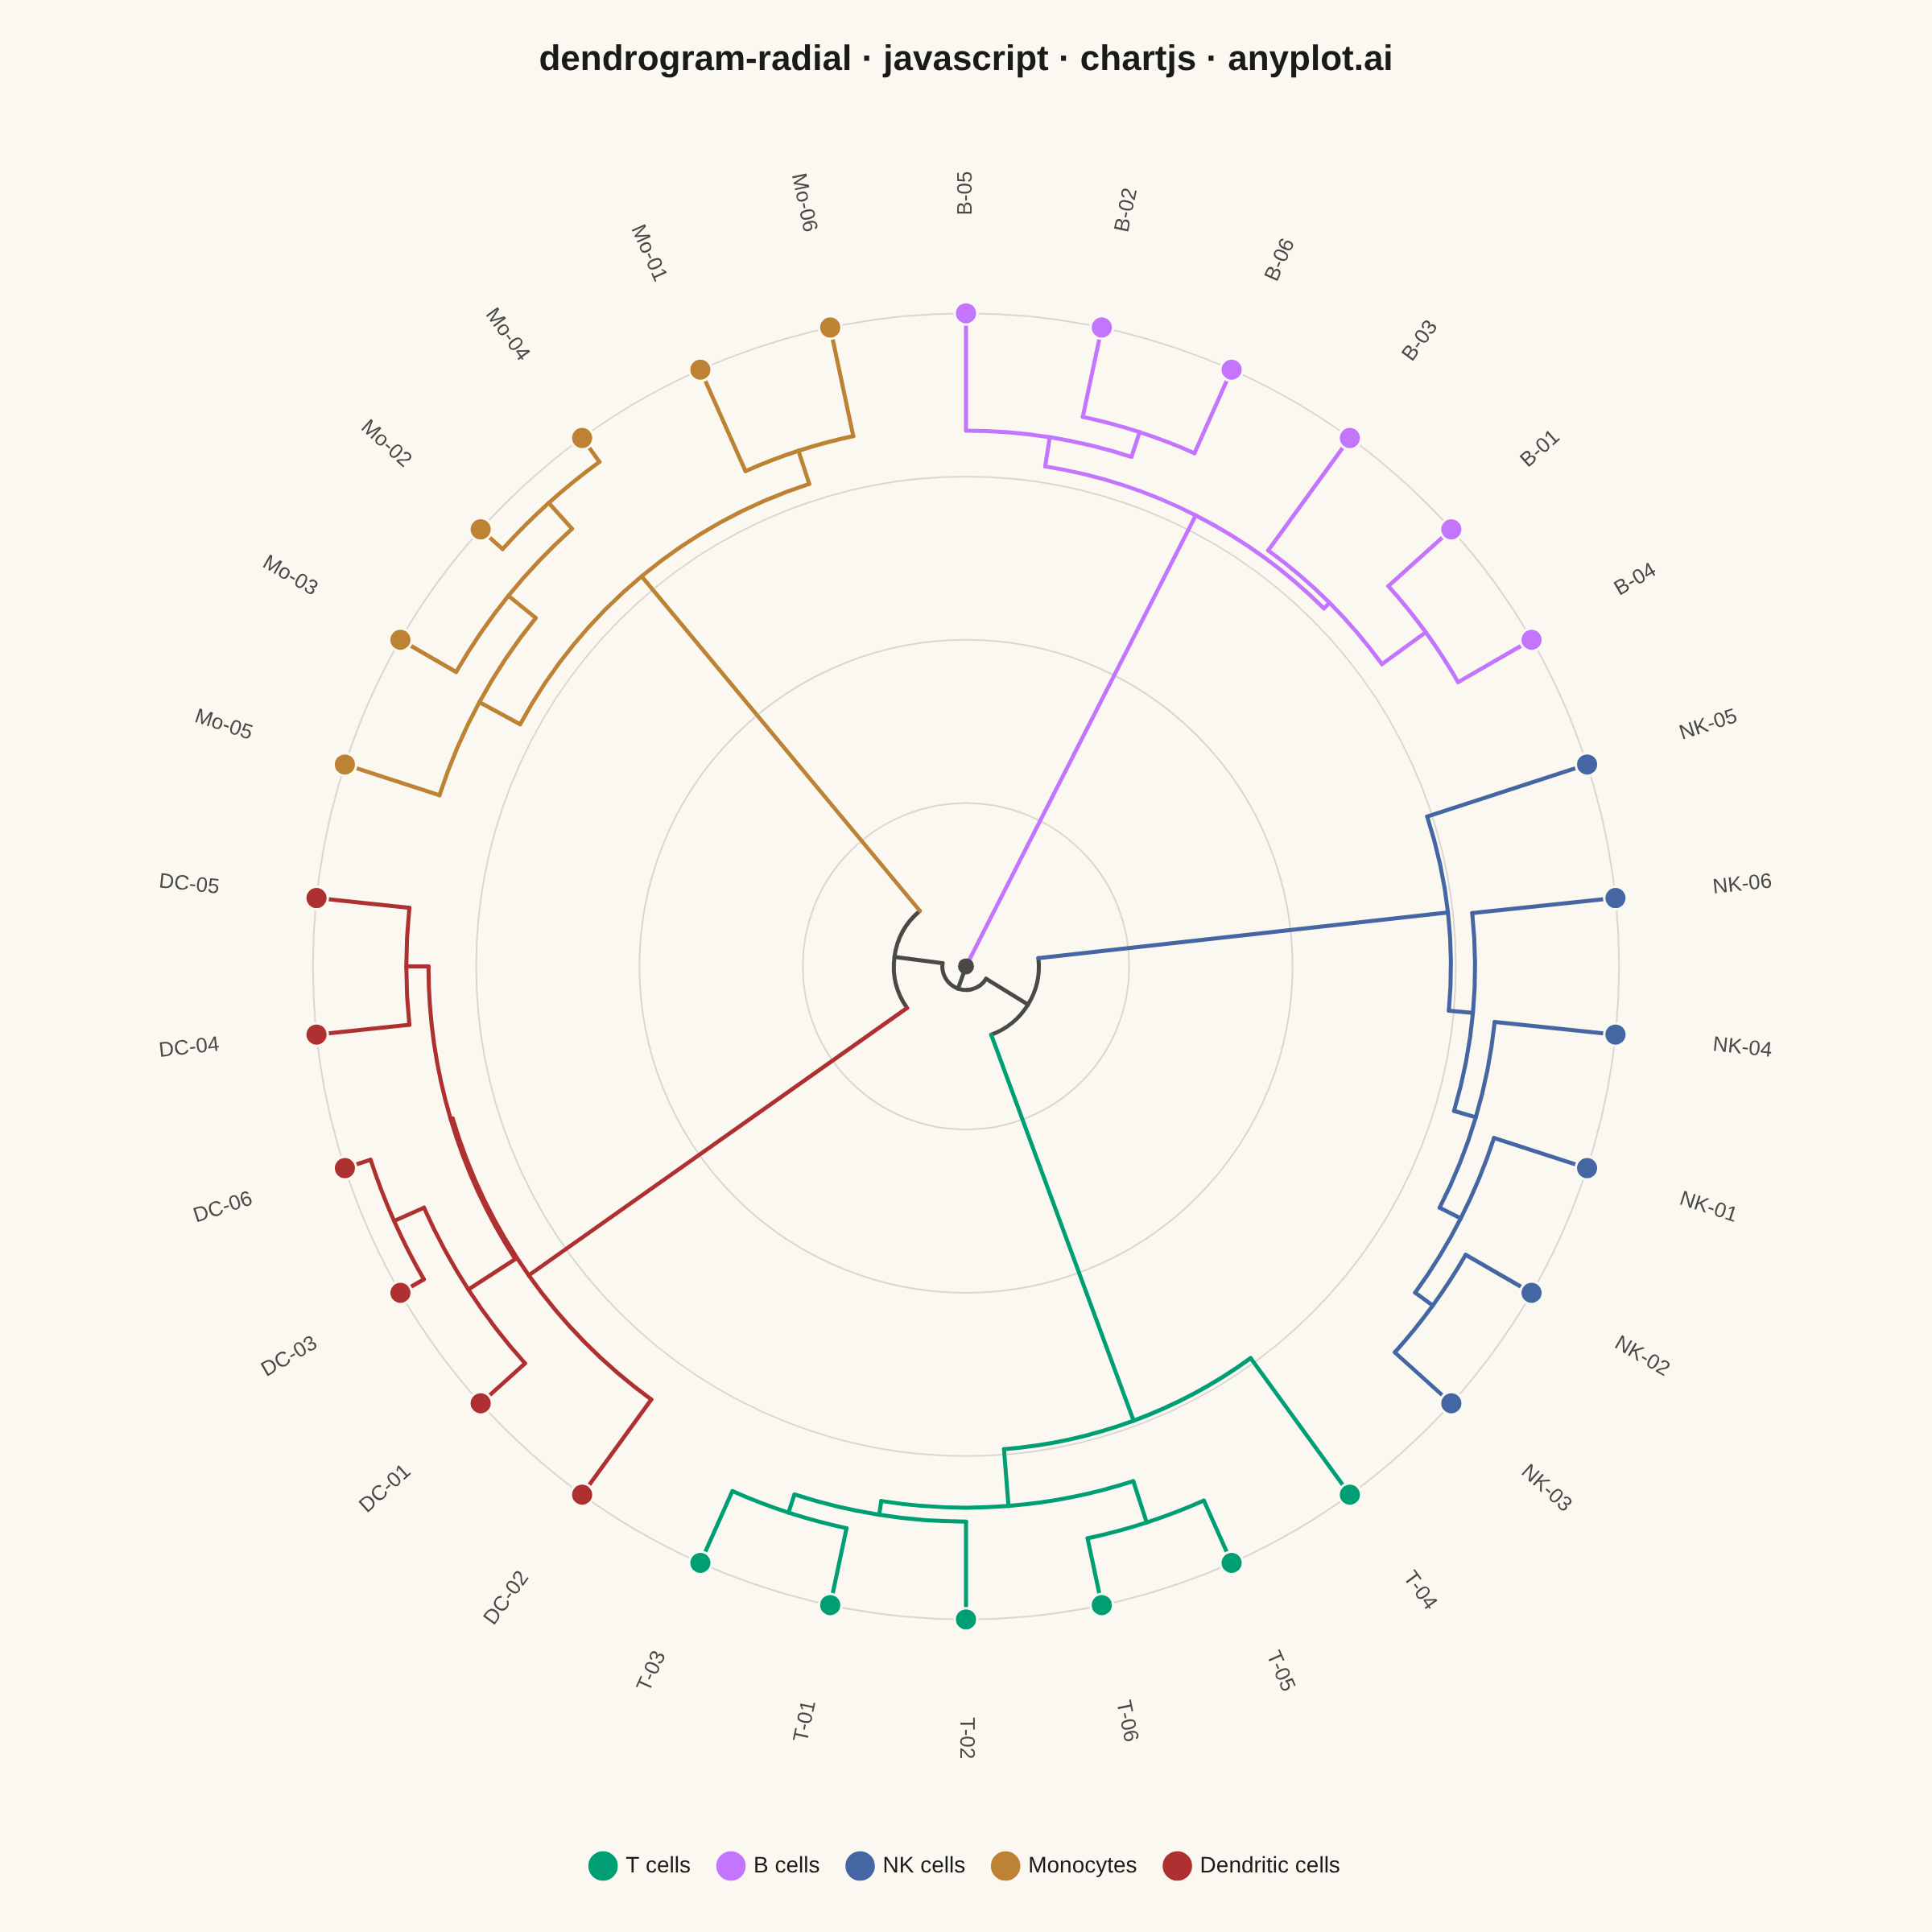
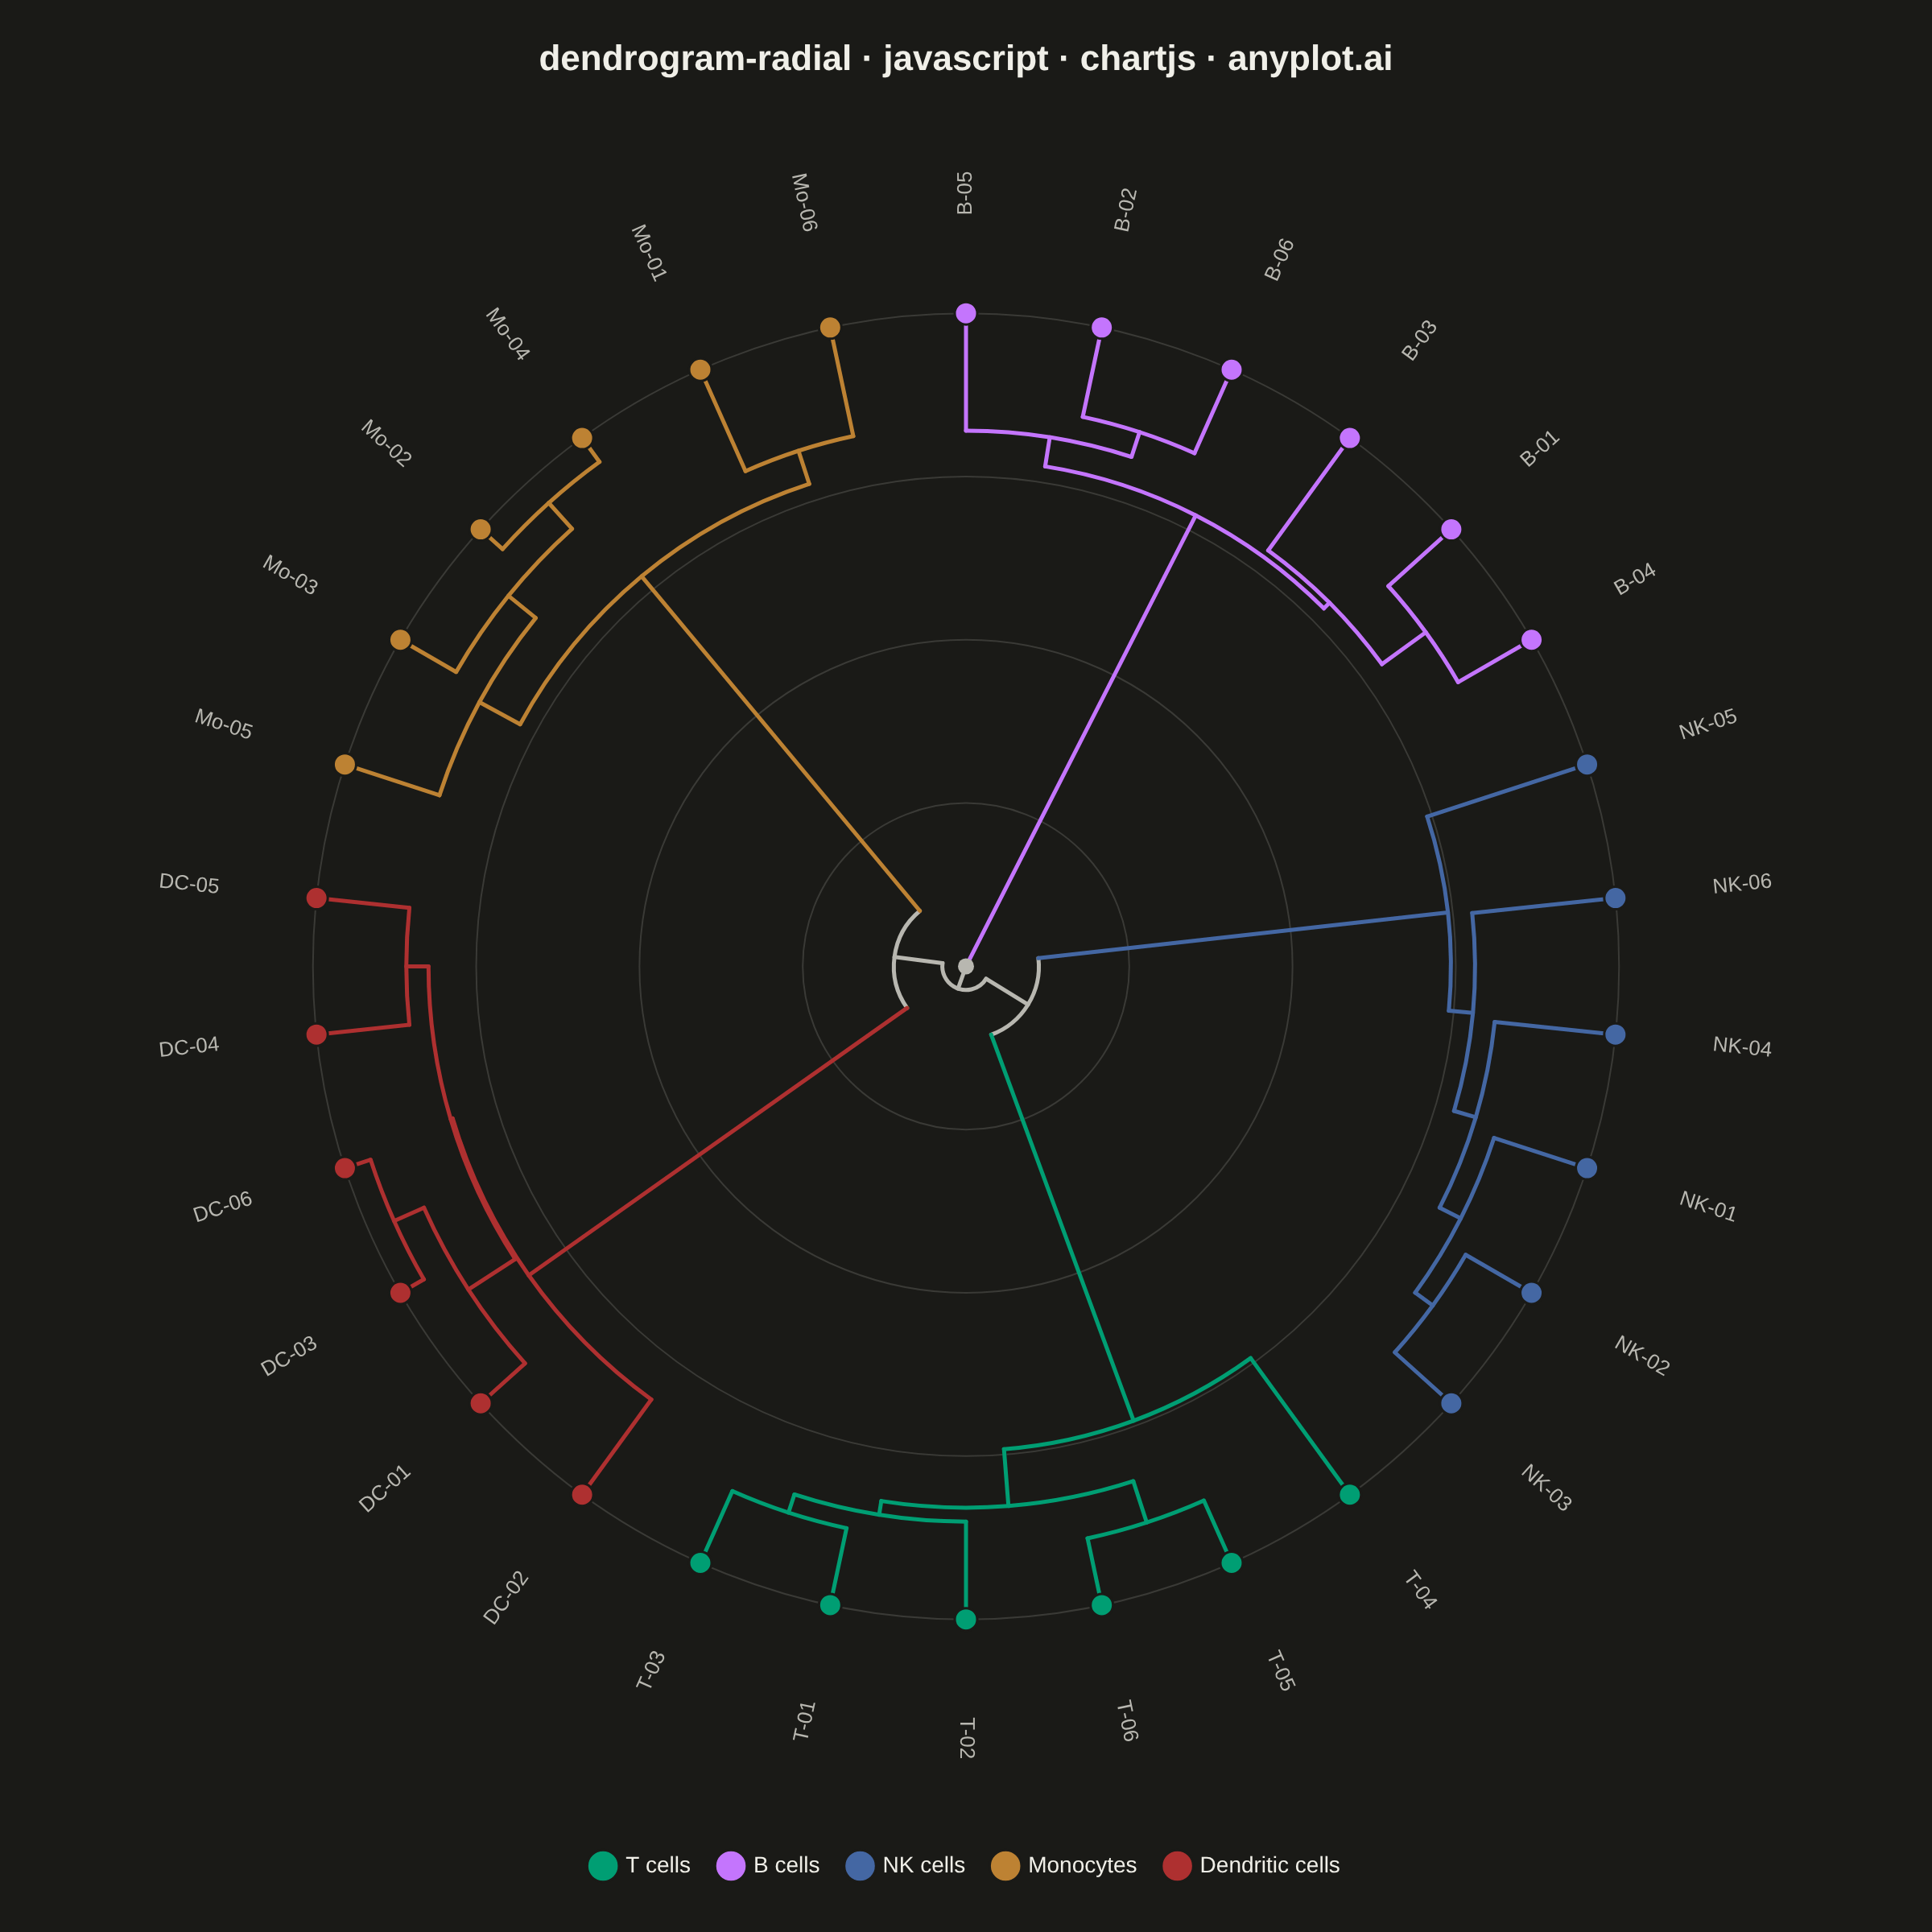
A radial dendrogram renders hierarchical clustering in a circular layout where the root node sits at the center and branches extend outward, with leaf nodes arranged around the circumference. This layout is a space-efficient alternative to linear dendrograms for large hierarchies, making it well-suited for datasets with hundreds of leaves. Branch lengths are proportional to distance or dissimilarity, preserving the quantitative interpretation of cluster merges.
Preview render from the Chart.js implementation.