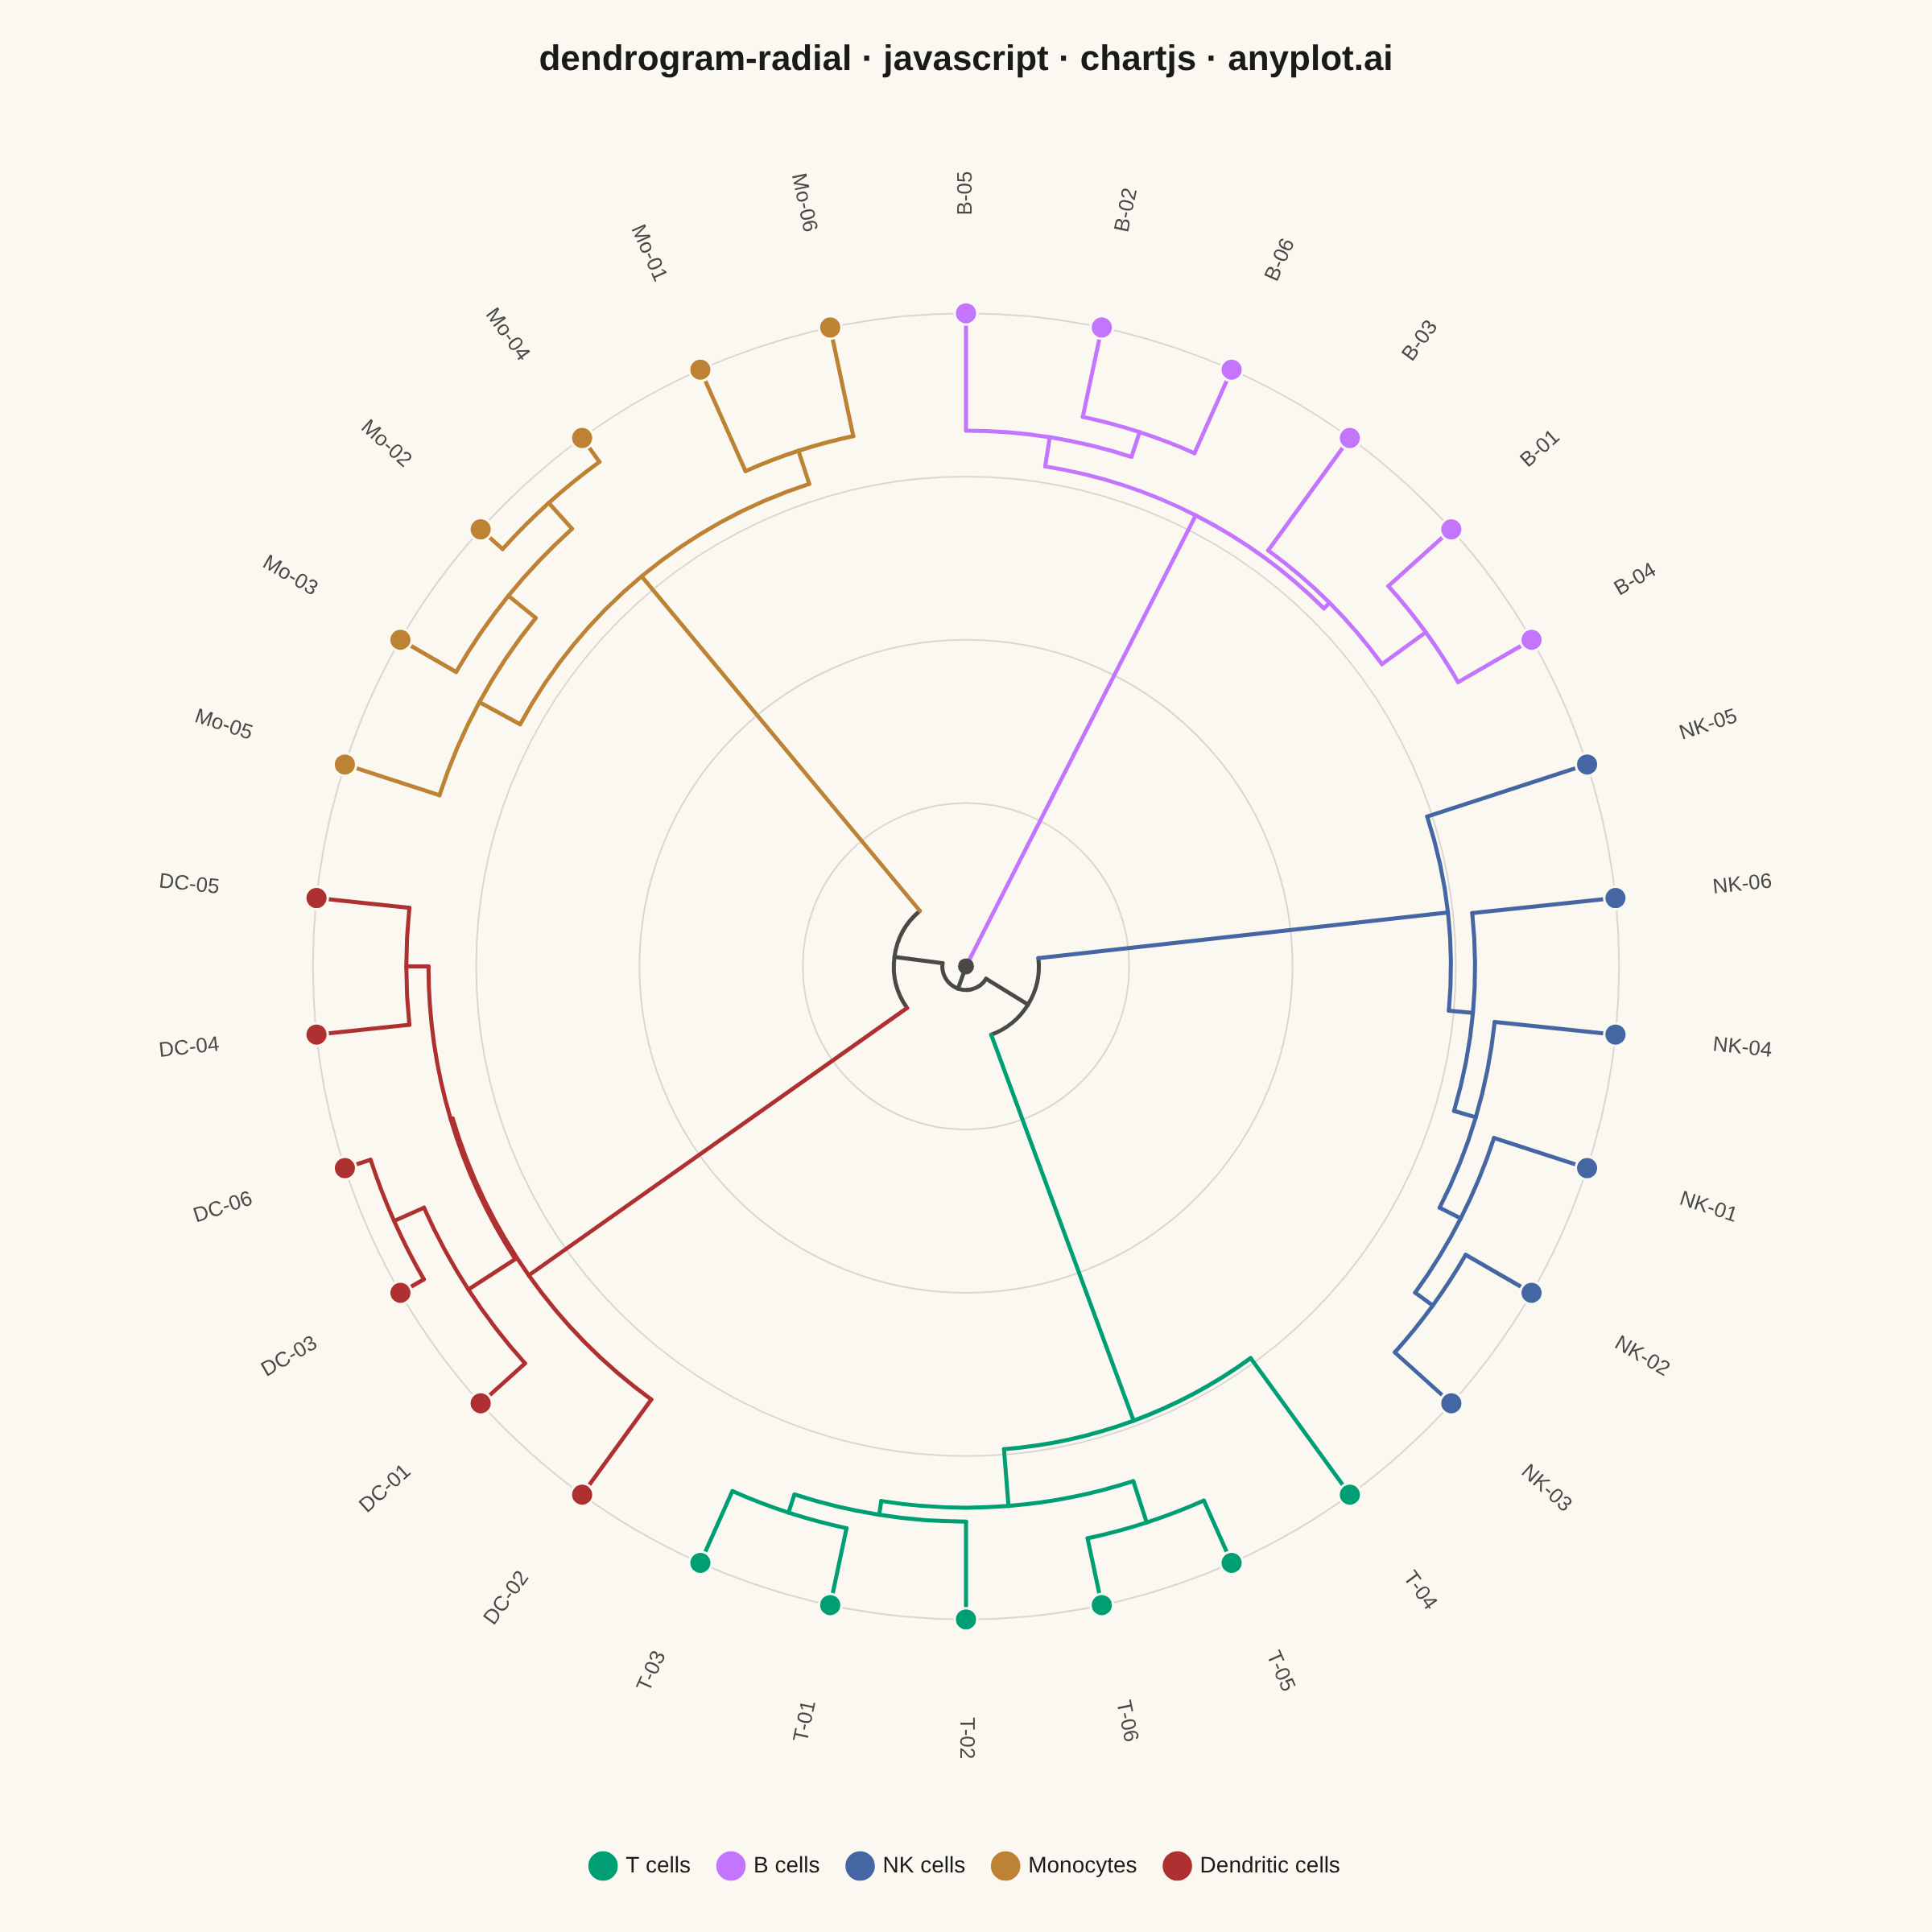
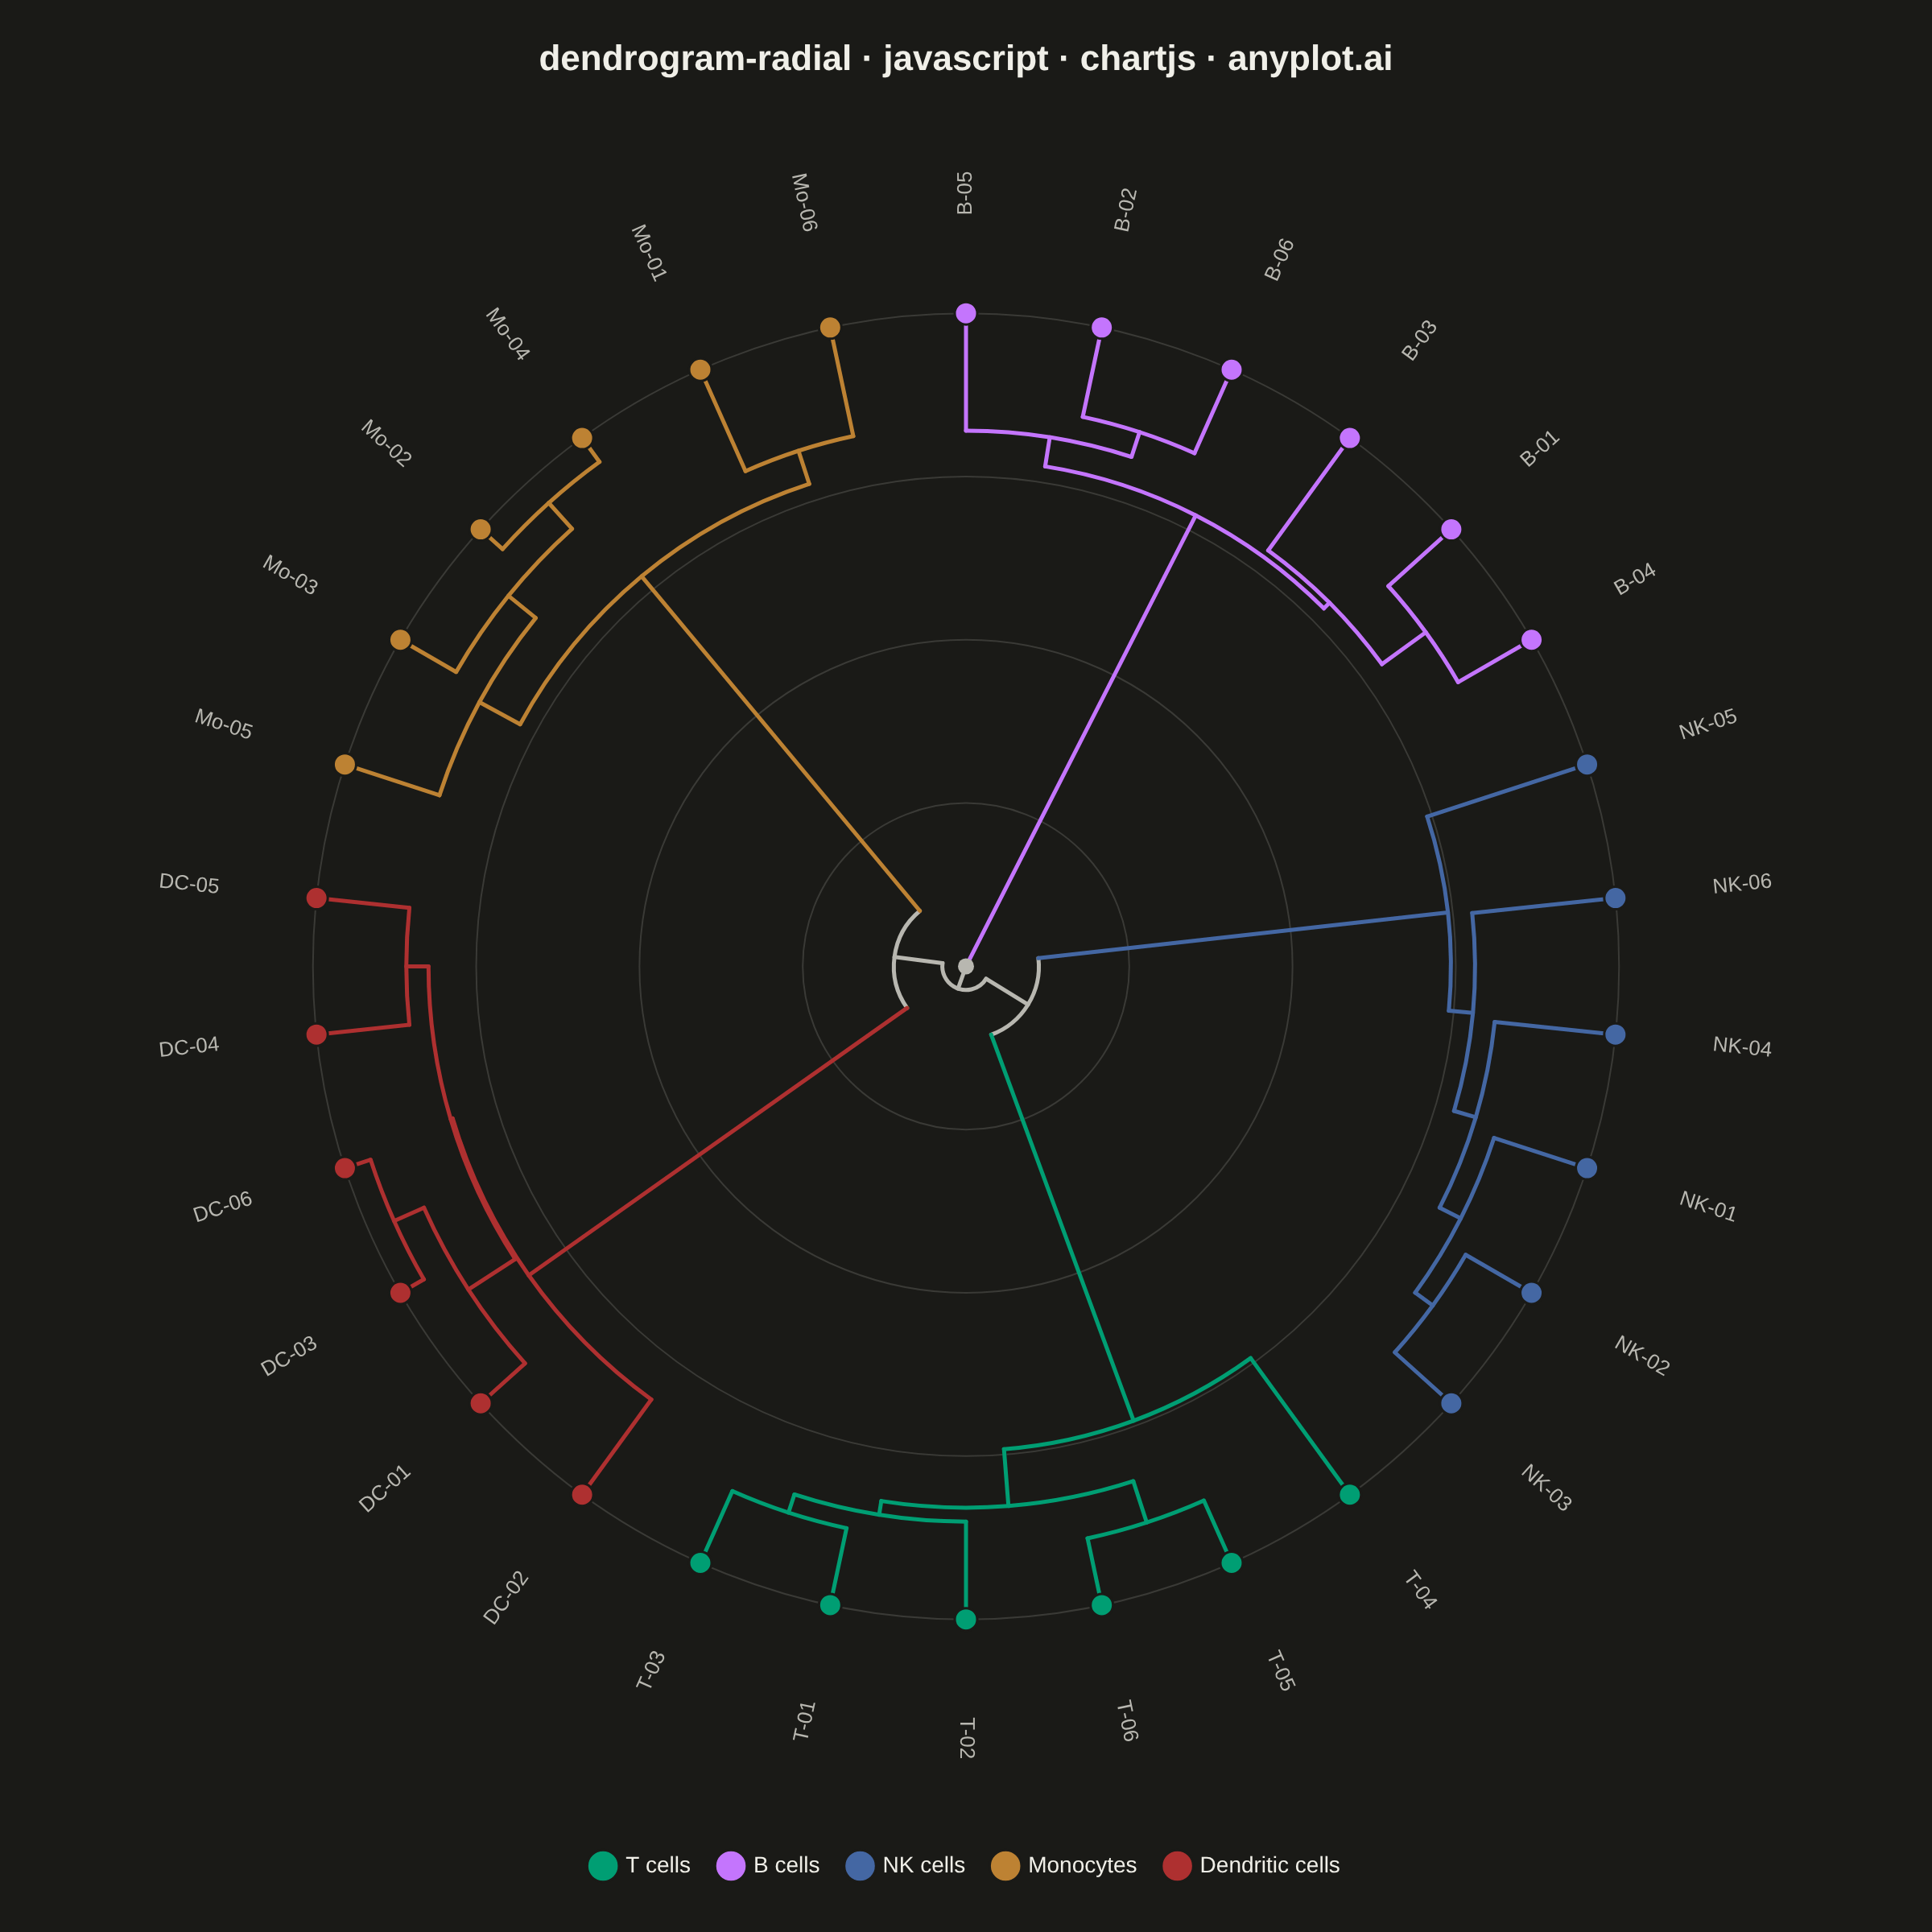
The same plot in 14 other libraries — JavaScript: D3.js, Apache ECharts, Highcharts, MUI X Charts; Python: Altair, Bokeh, lets-plot, Matplotlib, Plotly, plotnine, Pygal, Seaborn; R: ggplot2; Julia: Makie.jl. Compare all 15 side by side: Radial Dendrogram in Python, R, Julia and JavaScript.
A radial dendrogram renders hierarchical clustering in a circular layout where the root node sits at the center and branches extend outward, with leaf nodes arranged around the circumference. This layout is a space-efficient alternative to linear dendrograms for large hierarchies, making it well-suited for datasets with hundreds of leaves. Branch lengths are proportional to distance or dissimilarity, preserving the quantitative interpretation of cluster merges.
// anyplot.ai
// dendrogram-radial: Radial Dendrogram
// Library: chartjs 4.4.7 | JavaScript 22.23.2
// Quality: 93/100 | Updated: 2026-09-05
//# anyplot-orientation: square

const t = window.ANYPLOT_TOKENS;

// --- Data: synthetic marker-gene expression per immune cell subtype --------
// Deterministic LCG so the "random" noise is reproducible without a browser RNG.
function makeRng(seed) {
  let state = seed >>> 0;
  return function rng() {
    state = (Math.imul(1664525, state) + 1013904223) >>> 0;
    return state / 4294967296;
  };
}
const rng = makeRng(42);
function gaussian() {
  const u1 = Math.max(rng(), 1e-9);
  const u2 = rng();
  return Math.sqrt(-2 * Math.log(u1)) * Math.cos(2 * Math.PI * u2);
}

// Five marker genes, one diagnostic per cell type (diagonal-dominant profile).
const CLUSTERS = [
  { name: "T cells", prefix: "T", center: [8.5, 0.5, 0.8, 0.6, 0.4] },
  { name: "B cells", prefix: "B", center: [0.6, 8.2, 0.5, 0.7, 0.9] },
  { name: "NK cells", prefix: "NK", center: [0.9, 0.4, 8.0, 0.5, 0.6] },
  { name: "Monocytes", prefix: "Mo", center: [0.5, 0.6, 0.4, 8.3, 1.2] },
  { name: "Dendritic cells", prefix: "DC", center: [0.7, 0.8, 0.6, 1.5, 7.9] },
];
const SAMPLES_PER_CLUSTER = 6;
const NOISE_SD = 0.8;

const samples = [];
CLUSTERS.forEach((c, clusterId) => {
  for (let s = 0; s < SAMPLES_PER_CLUSTER; s++) {
    samples.push({
      id: samples.length,
      name: `${c.prefix}-${String(s + 1).padStart(2, "0")}`,
      cluster: clusterId,
      vec: c.center.map((v) => v + gaussian() * NOISE_SD),
    });
  }
});
const n = samples.length;
const nodeCount = 2 * n - 1;

// --- Hierarchical clustering (average linkage / UPGMA) ----------------------
// Produces a scipy-style linkage matrix: rows [childA, childB, distance, size].
const D = Array.from({ length: nodeCount }, () => new Array(nodeCount).fill(Infinity));
for (let i = 0; i < n; i++) {
  for (let j = i + 1; j < n; j++) {
    let sq = 0;
    for (let k = 0; k < samples[i].vec.length; k++) {
      const d = samples[i].vec[k] - samples[j].vec[k];
      sq += d * d;
    }
    const dist = Math.sqrt(sq);
    D[i][j] = dist;
    D[j][i] = dist;
  }
}

const clusterSize = new Array(nodeCount).fill(1);
const active = new Set(Array.from({ length: n }, (_, i) => i));
const linkage = [];
let nextId = n;
while (active.size > 1) {
  let best = { a: -1, b: -1, d: Infinity };
  const ids = Array.from(active);
  for (let i = 0; i < ids.length; i++) {
    for (let j = i + 1; j < ids.length; j++) {
      const a = ids[i], b = ids[j];
      if (D[a][b] < best.d) best = { a, b, d: D[a][b] };
    }
  }
  const { a, b, d } = best;
  const newId = nextId++;
  const newSize = clusterSize[a] + clusterSize[b];
  active.forEach((c) => {
    if (c === a || c === b) return;
    const avg = (clusterSize[a] * D[a][c] + clusterSize[b] * D[b][c]) / newSize;
    D[newId][c] = avg;
    D[c][newId] = avg;
  });
  clusterSize[newId] = newSize;
  active.delete(a);
  active.delete(b);
  active.add(newId);
  linkage.push([a, b, d, newSize]);
}
const root = nextId - 1;
const maxHeight = Math.max(...linkage.map((row) => row[2]));

// --- Radial layout: leaves on the rim, root at the center -------------------
// Leaf order follows a recursive left+right traversal from the root so every
// subtree occupies a contiguous angular span (standard dendrogram ordering).
function leafOrder(nodeId) {
  if (nodeId < n) return [nodeId];
  const [a, b] = linkage[nodeId - n];
  return leafOrder(a).concat(leafOrder(b));
}
const order = leafOrder(root);

const angleOf = new Array(nodeCount).fill(0);
const radiusOf = new Array(nodeCount).fill(0);
const clusterOf = new Array(nodeCount).fill(null);

order.forEach((leafId, idx) => {
  angleOf[leafId] = Math.PI / 2 - idx * ((2 * Math.PI) / n);
  radiusOf[leafId] = 1;
  clusterOf[leafId] = samples[leafId].cluster;
});
for (let id = n; id < nodeCount; id++) {
  const [a, b, height] = linkage[id - n];
  angleOf[id] = (angleOf[a] + angleOf[b]) / 2;
  radiusOf[id] = 1 - height / maxHeight;
  clusterOf[id] = clusterOf[a] === clusterOf[b] ? clusterOf[a] : null;
}

// --- Mount -------------------------------------------------------------------
const canvas = document.createElement("canvas");
document.getElementById("container").appendChild(canvas);

// --- Datasets: one per cluster, purely for legend + tooltip + leaf markers --
const datasets = CLUSTERS.map((c, clusterId) => ({
  label: c.name,
  data: samples
    .filter((s) => s.cluster === clusterId)
    .map((s) => ({
      x: Math.cos(angleOf[s.id]),
      y: Math.sin(angleOf[s.id]),
      name: s.name,
    })),
  backgroundColor: t.palette[clusterId],
  borderColor: t.pageBg,
  borderWidth: 1.5,
  pointRadius: 7,
  pointHoverRadius: 9,
  showLine: false,
}));

// --- Plugin: force the x/y linear scales into an exact 1:1 pixel ratio ------
// The title + bottom legend consume unequal vertical space, so the naive
// scatter chart area is not a perfect square. Chart.js's own layout gives us
// the true chart area only after the first pass, so we widen the shorter axis
// once (in afterLayout) and trigger a single corrective update.
const squareAxesPlugin = {
  id: "squareAxes",
  afterLayout(chart) {
    if (chart.$anyplotSquared) return;
    const area = chart.chartArea;
    const w = area.right - area.left;
    const h = area.bottom - area.top;
    const xs = chart.scales.x;
    const xRange = xs.max - xs.min;
    const newYRange = xRange * (h / w);
    chart.options.scales.y.min = -newYRange / 2;
    chart.options.scales.y.max = newYRange / 2;
    chart.$anyplotSquared = true;
    chart.update();
  },
};

// --- Plugin: draw the radial tree (rings behind, branches, tip labels) -----
const dendrogramPlugin = {
  id: "radialDendrogram",
  beforeDatasetsDraw(chart) {
    const { ctx, scales } = chart;
    const xs = scales.x, ys = scales.y;
    const cx = xs.getPixelForValue(0);
    const cy = ys.getPixelForValue(0);
    const px = (r) => Math.abs(xs.getPixelForValue(r) - cx);
    const point = (r, theta) => ({
      x: xs.getPixelForValue(r * Math.cos(theta)),
      y: ys.getPixelForValue(r * Math.sin(theta)),
    });

    // Distance reference rings (subtle, matches the style guide's grid opacity).
    ctx.save();
    ctx.strokeStyle = t.grid;
    ctx.lineWidth = 1;
    [0.25, 0.5, 0.75, 1.0].forEach((frac) => {
      ctx.beginPath();
      ctx.arc(cx, cy, px(frac), 0, Math.PI * 2);
      ctx.stroke();
    });
    ctx.restore();

    // Branches: an arc bridging the two children at the parent's radius, then
    // a radial segment from that radius out to each child's own position.
    ctx.save();
    ctx.lineCap = "round";
    for (let id = n; id < nodeCount; id++) {
      const [a, b] = linkage[id - n];
      const rParent = radiusOf[id];
      const rPxParent = px(rParent);
      const cAngleA = -angleOf[a];
      const cAngleB = -angleOf[b];
      const arcColor = clusterOf[id] !== null ? t.palette[clusterOf[id]] : t.inkSoft;

      ctx.strokeStyle = arcColor;
      ctx.lineWidth = 2.5;
      ctx.beginPath();
      ctx.arc(cx, cy, rPxParent, Math.min(cAngleA, cAngleB), Math.max(cAngleA, cAngleB));
      ctx.stroke();

      [a, b].forEach((child) => {
        const childColor = clusterOf[child] !== null ? t.palette[clusterOf[child]] : t.inkSoft;
        const p1 = point(rParent, angleOf[child]);
        const p2 = point(radiusOf[child], angleOf[child]);
        ctx.strokeStyle = childColor;
        ctx.beginPath();
        ctx.moveTo(p1.x, p1.y);
        ctx.lineTo(p2.x, p2.y);
        ctx.stroke();
      });
    }
    ctx.restore();

    // Root anchor.
    ctx.save();
    ctx.fillStyle = t.inkSoft;
    ctx.beginPath();
    ctx.arc(cx, cy, 5, 0, Math.PI * 2);
    ctx.fill();
    ctx.restore();
  },
  afterDatasetsDraw(chart) {
    const { ctx, scales } = chart;
    const xs = scales.x, ys = scales.y;
    const cx = xs.getPixelForValue(0);
    const cy = ys.getPixelForValue(0);
    const labelRadius = 1.14;

    ctx.save();
    ctx.font = '13px -apple-system, BlinkMacSystemFont, "Segoe UI", Roboto, Helvetica, Arial, sans-serif';
    ctx.fillStyle = t.inkSoft;
    ctx.textBaseline = "middle";
    order.forEach((leafId) => {
      const theta = angleOf[leafId];
      const lx = xs.getPixelForValue(labelRadius * Math.cos(theta));
      const ly = ys.getPixelForValue(labelRadius * Math.sin(theta));
      const rot = Math.atan2(ly - cy, lx - cx);
      const flip = Math.cos(rot) < 0;
      ctx.save();
      ctx.translate(lx, ly);
      ctx.rotate(flip ? rot + Math.PI : rot);
      ctx.textAlign = flip ? "right" : "left";
      ctx.fillText(samples[leafId].name, flip ? -4 : 4, 0);
      ctx.restore();
    });
    ctx.restore();
  },
};

// --- Chart -------------------------------------------------------------------
new Chart(canvas, {
  type: "scatter",
  data: { datasets },
  plugins: [squareAxesPlugin, dendrogramPlugin],
  options: {
    responsive: true,
    maintainAspectRatio: false,
    animation: false,
    layout: { padding: 24 },
    scales: {
      x: { type: "linear", min: -1.42, max: 1.42, display: false, grid: { display: false } },
      y: { type: "linear", min: -1.42, max: 1.42, display: false, grid: { display: false } },
    },
    plugins: {
      title: {
        display: true,
        text: "dendrogram-radial · javascript · chartjs · anyplot.ai",
        color: t.ink,
        font: { size: 22 },
        padding: { bottom: 16 },
      },
      legend: {
        display: true,
        position: "bottom",
        labels: { color: t.ink, font: { size: 14 }, boxWidth: 14, usePointStyle: true, padding: 18 },
      },
      tooltip: {
        backgroundColor: t.elevatedBg,
        titleColor: t.ink,
        bodyColor: t.inkSoft,
        borderColor: t.grid,
        borderWidth: 1,
        callbacks: {
          title: (items) => (items[0] ? items[0].raw.name : ""),
          label: (item) => item.dataset.label,
        },
      },
    },
  },
});
Runnable source as JSON, for any HTTP client: https://api.anyplot.ai/specs/dendrogram-radial/chartjs/code. Any spec id and library id listed in llms-full.txt fit the same URL shape; every URL below is complete and callable.
{
  "spec_id": "dendrogram-radial",
  "language": "javascript",
  "library": "chartjs",
  "page": "https://anyplot.ai/dendrogram-radial/javascript/chartjs",
  "hub": "https://anyplot.ai/dendrogram-radial",
  "code_json": "https://api.anyplot.ai/specs/dendrogram-radial/chartjs/code",
  "spec_json": "https://api.anyplot.ai/specs/dendrogram-radial",
  "render_light_png": "https://storage.googleapis.com/anyplot-images/plots/dendrogram-radial/javascript/chartjs/plot-light.png",
  "render_dark_png": "https://storage.googleapis.com/anyplot-images/plots/dendrogram-radial/javascript/chartjs/plot-dark.png",
  "interactive_light_html": "https://storage.googleapis.com/anyplot-images/plots/dendrogram-radial/javascript/chartjs/plot-light.html",
  "interactive_dark_html": "https://storage.googleapis.com/anyplot-images/plots/dendrogram-radial/javascript/chartjs/plot-dark.html",
  "quality_score": 93.0,
  "license": "MIT",
  "guide": "https://anyplot.ai/llms.txt"
}
Part of Radial Dendrogram on anyplot.ai.