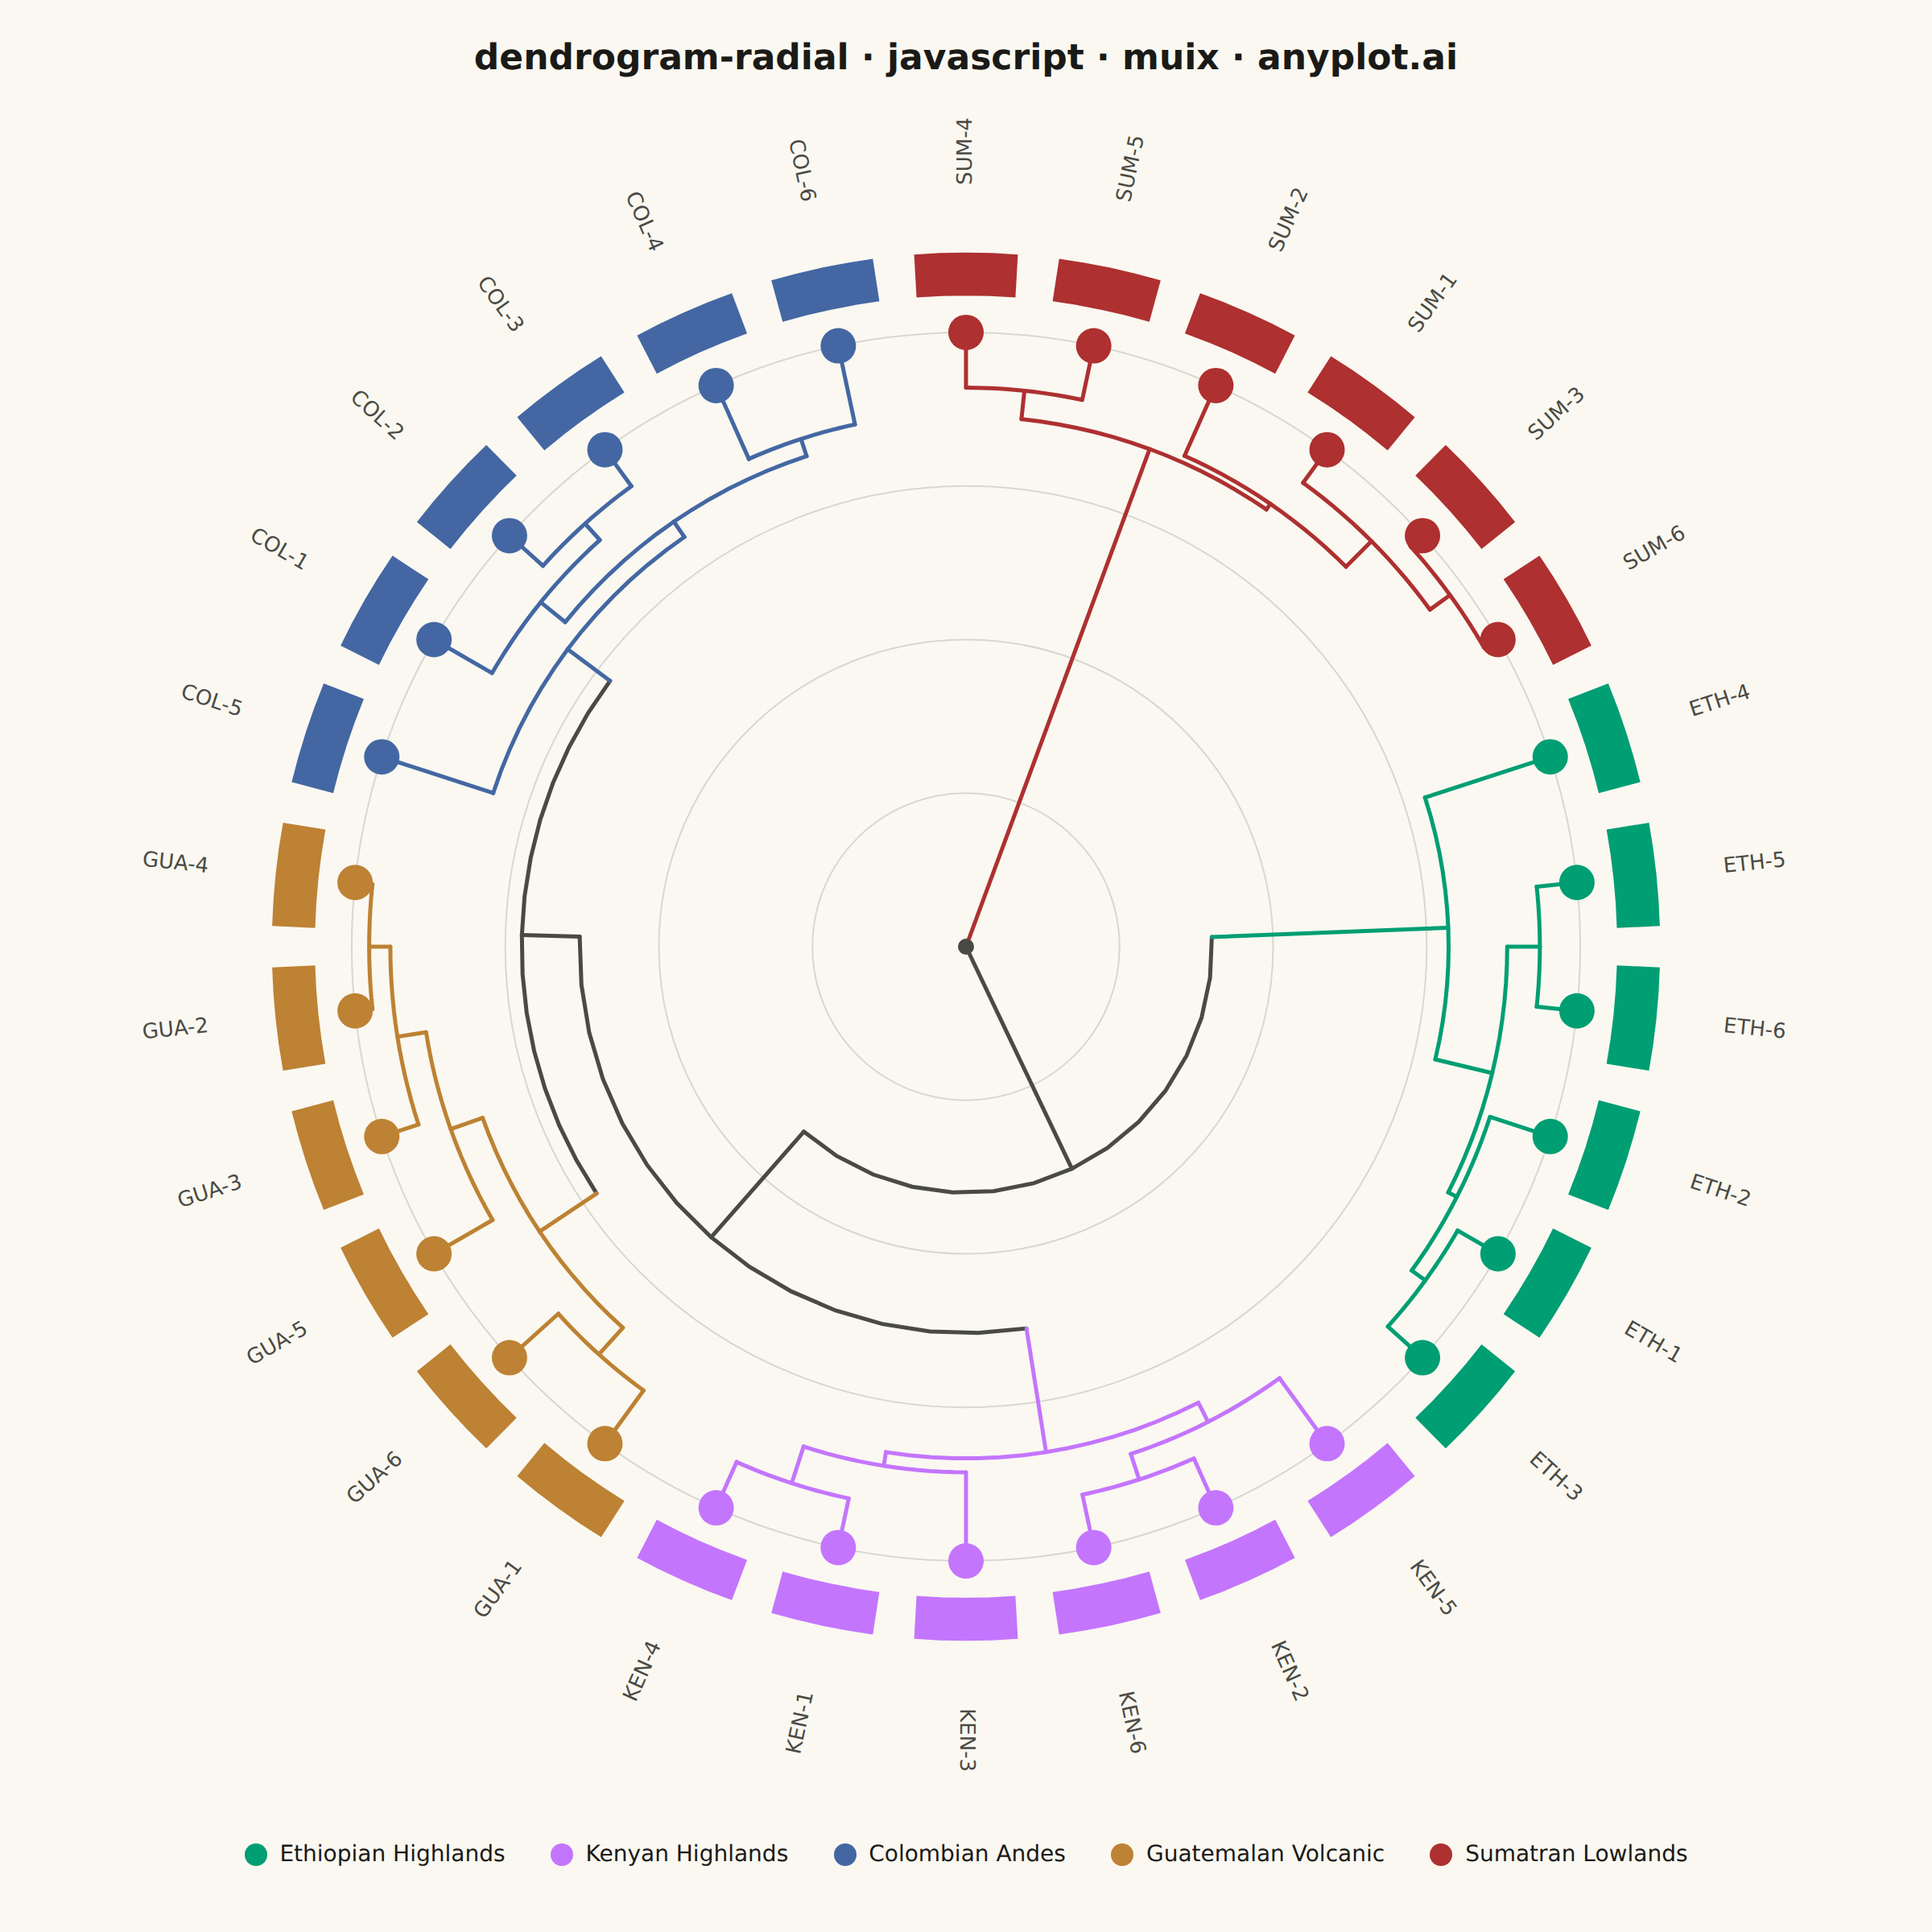
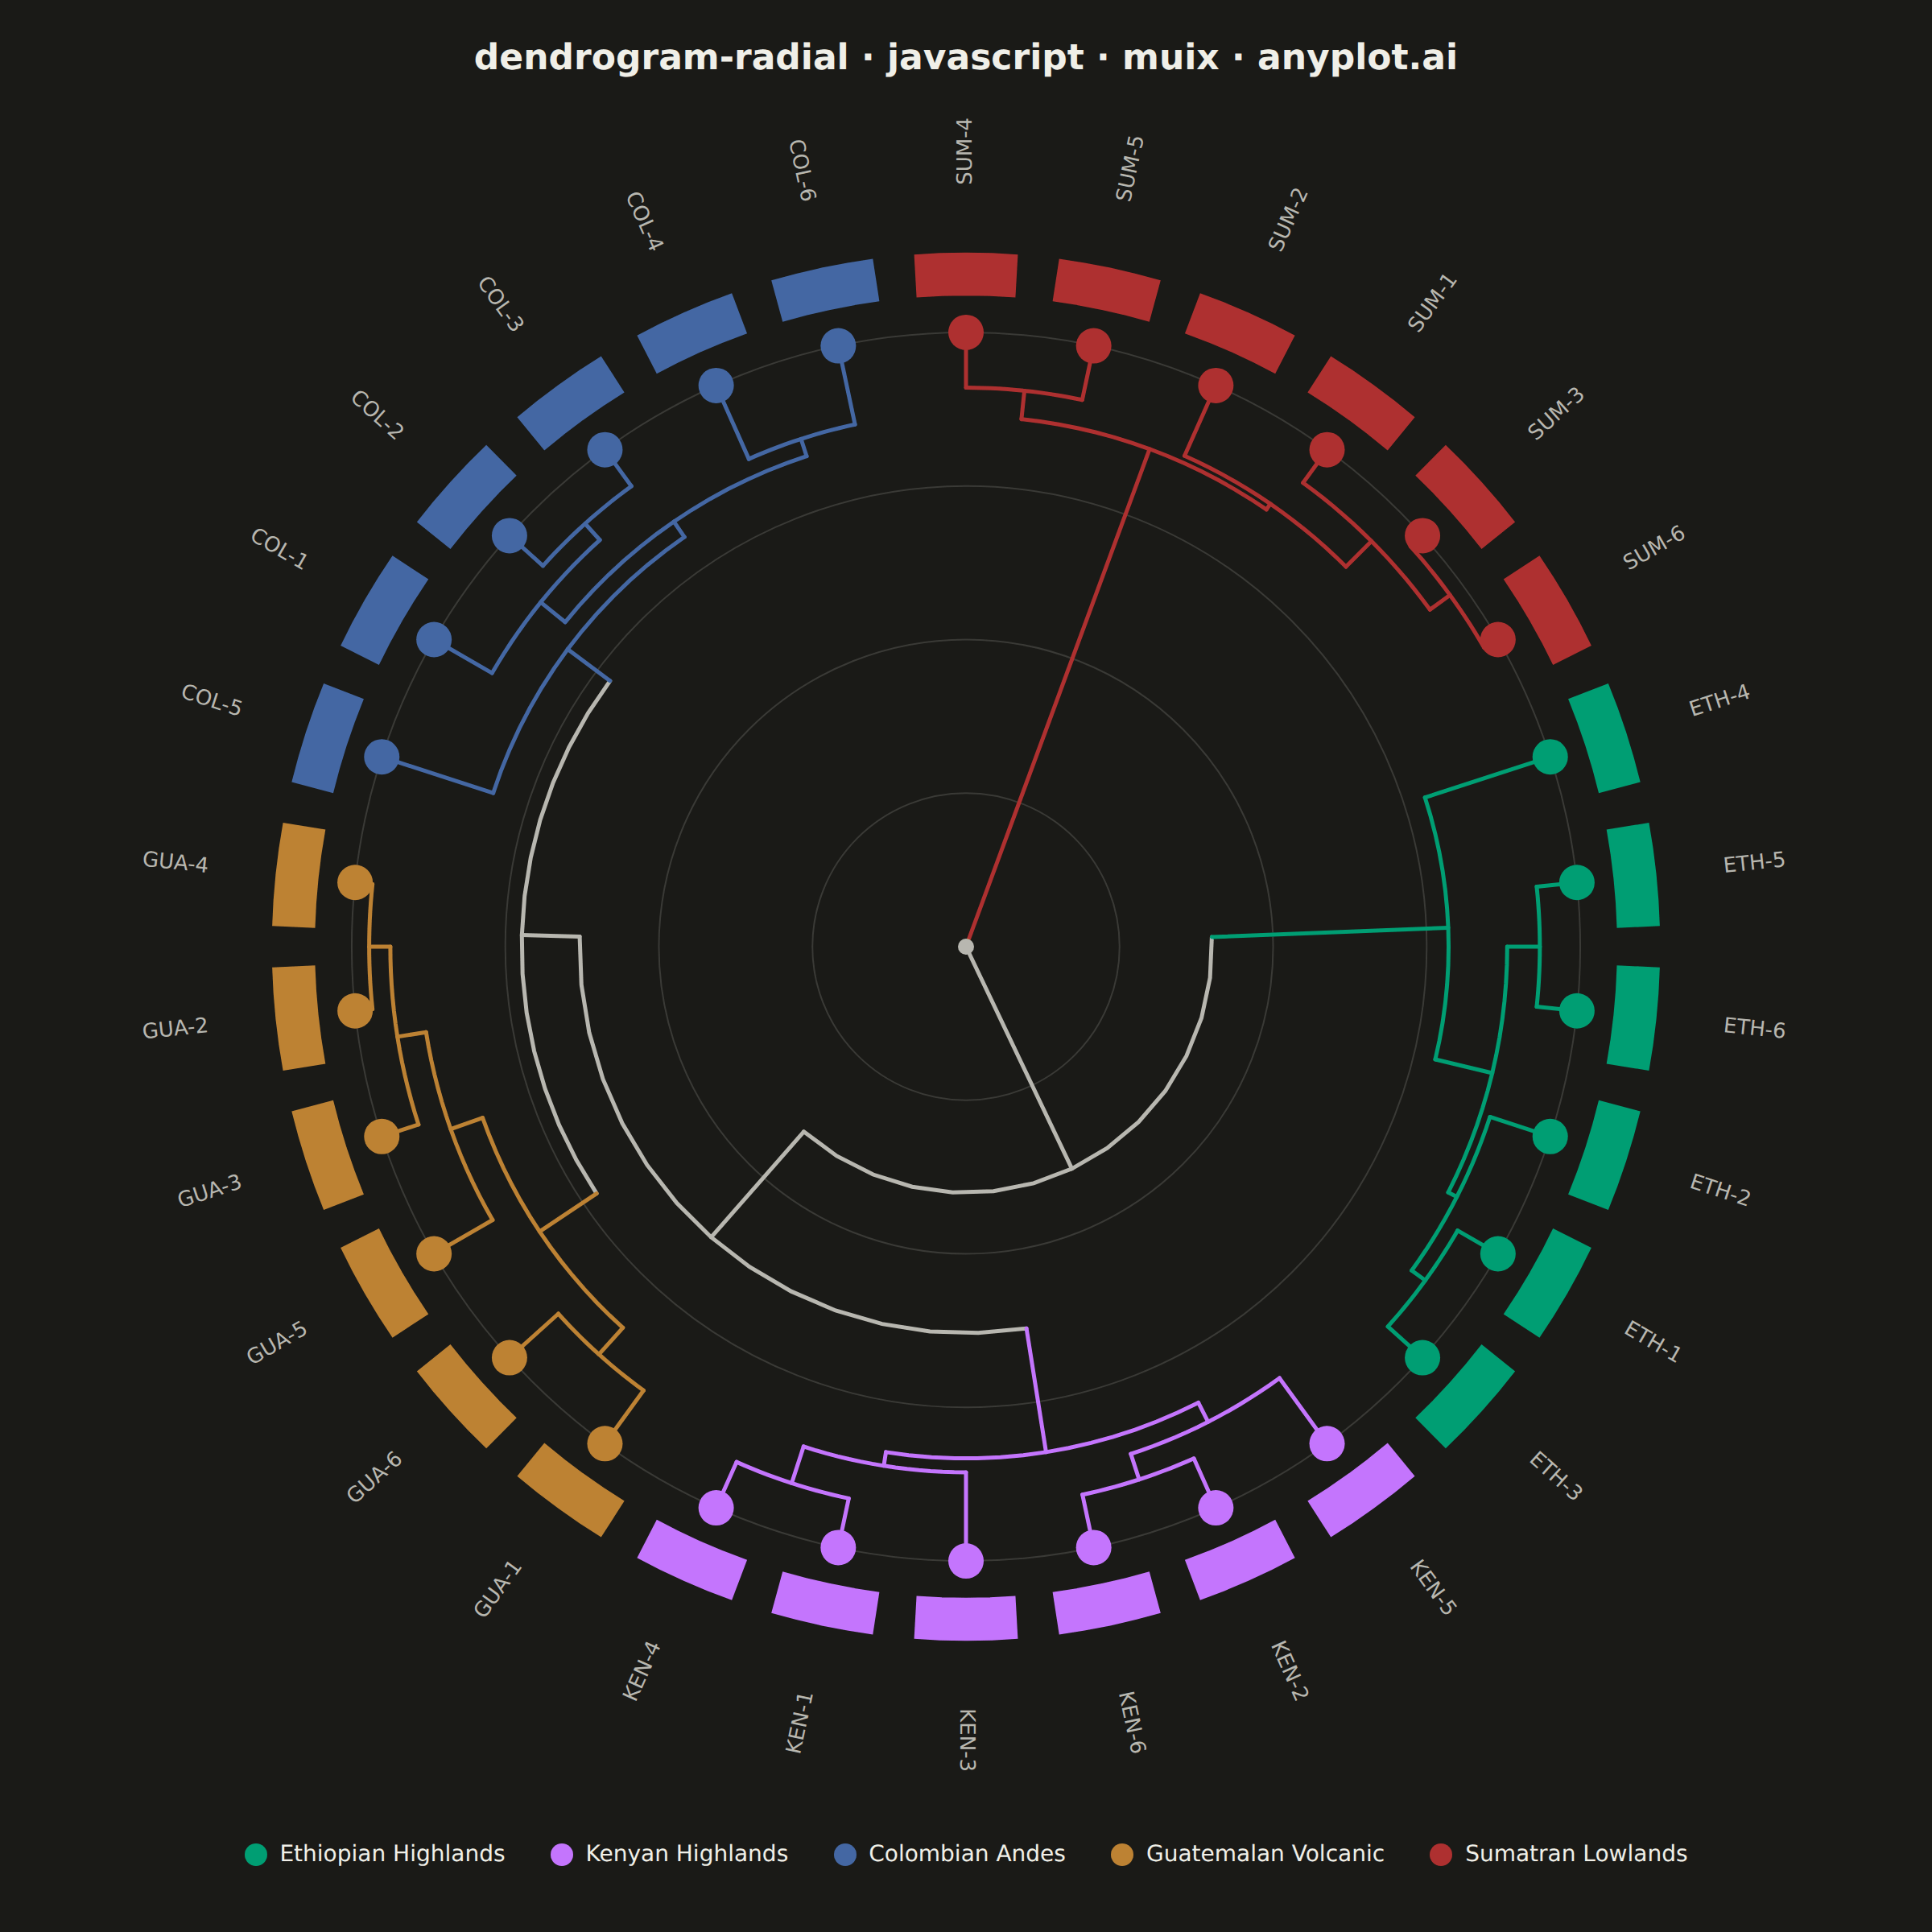
The same plot in 14 other libraries — JavaScript: Chart.js, D3.js, Apache ECharts, Highcharts; Python: Altair, Bokeh, lets-plot, Matplotlib, Plotly, plotnine, Pygal, Seaborn; R: ggplot2; Julia: Makie.jl. Compare all 15 side by side: Radial Dendrogram in Python, R, Julia and JavaScript.
A radial dendrogram renders hierarchical clustering in a circular layout where the root node sits at the center and branches extend outward, with leaf nodes arranged around the circumference. This layout is a space-efficient alternative to linear dendrograms for large hierarchies, making it well-suited for datasets with hundreds of leaves. Branch lengths are proportional to distance or dissimilarity, preserving the quantitative interpretation of cluster merges.
// anyplot.ai
// dendrogram-radial: Radial Dendrogram
// Library: muix 7.29.1 | JavaScript 22.23.2
// Quality: 90/100 | Created: 2026-09-05
//# anyplot-orientation: square
// anyplot.ai
// dendrogram-radial: Radial Dendrogram
// Library: MUI X Charts | React | Node 22
// License: @mui/x-charts — MIT (community). Pro/Premium are out of scope.
// Quality: pending | Created: 2026-09-05

import { ChartContainer } from "@mui/x-charts/ChartContainer";
import { ScatterPlot } from "@mui/x-charts/ScatterChart";
import { useXScale, useYScale } from "@mui/x-charts/hooks";

const t = window.ANYPLOT_TOKENS;
const FONT = "Inter, system-ui, -apple-system, sans-serif";

// --- Deterministic LCG so the "random" flavor noise reproduces without a browser RNG.
function createRng(seed) {
  let state = seed >>> 0;
  return function next() {
    state = (Math.imul(1664525, state) + 1013904223) >>> 0;
    return state / 4294967296;
  };
}
function randomGaussian(rng) {
  const u1 = Math.max(rng(), 1e-9);
  const u2 = rng();
  return Math.sqrt(-2 * Math.log(u1)) * Math.cos(2 * Math.PI * u2);
}

// --- Data: coffee-origin flavor profiles across five growing regions --------
// Vector dims: [acidity, body, sweetness, floralAroma, earthiness], 0-10 scale.
// Ethiopian/Kenyan highlands share a high-acidity East-African profile, so the
// clustering merges them into a shared clade before joining the rest.
const REGIONS = [
  { code: "ETH", name: "Ethiopian Highlands", center: [8.5, 3.0, 7.0, 8.5, 1.0] },
  { code: "KEN", name: "Kenyan Highlands", center: [8.8, 4.0, 6.0, 5.0, 1.5] },
  { code: "COL", name: "Colombian Andes", center: [5.5, 6.0, 7.5, 2.5, 2.0] },
  { code: "GUA", name: "Guatemalan Volcanic", center: [6.0, 5.0, 5.5, 4.0, 2.5] },
  { code: "SUM", name: "Sumatran Lowlands", center: [2.0, 8.5, 3.0, 1.0, 8.5] },
];
const SAMPLES_PER_REGION = 6;
const NOISE_SD = 0.7;

const rng = createRng(42);
const samples = [];
REGIONS.forEach((region, regionId) => {
  for (let s = 0; s < SAMPLES_PER_REGION; s++) {
    samples.push({
      id: samples.length,
      name: `${region.code}-${s + 1}`,
      region: regionId,
      vec: region.center.map((v) => v + randomGaussian(rng) * NOISE_SD),
    });
  }
});
const n = samples.length;
const nodeCount = 2 * n - 1;

// --- Hierarchical clustering (complete linkage) ------------------------------
function euclid(a, b) {
  return Math.sqrt(a.reduce((sum, v, i) => sum + (v - b[i]) ** 2, 0));
}
const D = Array.from({ length: nodeCount }, () => new Array(nodeCount).fill(Infinity));
for (let i = 0; i < n; i++) {
  for (let j = i + 1; j < n; j++) {
    const d = euclid(samples[i].vec, samples[j].vec);
    D[i][j] = d;
    D[j][i] = d;
  }
}

const active = new Set(Array.from({ length: n }, (_, i) => i));
const linkage = [];
let nextId = n;
while (active.size > 1) {
  let a = -1, b = -1, best = Infinity;
  const ids = Array.from(active);
  for (let i = 0; i < ids.length; i++) {
    for (let j = i + 1; j < ids.length; j++) {
      if (D[ids[i]][ids[j]] < best) {
        best = D[ids[i]][ids[j]];
        a = ids[i];
        b = ids[j];
      }
    }
  }
  const newId = nextId++;
  active.forEach((c) => {
    if (c === a || c === b) return;
    const d = Math.max(D[a][c], D[b][c]); // complete linkage: farthest-pair distance
    D[newId][c] = d;
    D[c][newId] = d;
  });
  linkage.push([a, b, best]);
  active.delete(a);
  active.delete(b);
  active.add(newId);
}
const root = nextId - 1;
const maxHeight = Math.max(...linkage.map((row) => row[2]));

// --- Radial layout: leaves on the rim, contiguous angular span per subtree --
function leafOrder(nodeId) {
  if (nodeId < n) return [nodeId];
  const [a, b] = linkage[nodeId - n];
  return leafOrder(a).concat(leafOrder(b));
}
const order = leafOrder(root);

const angleOf = new Array(nodeCount).fill(0);
const radiusOf = new Array(nodeCount).fill(0);
const regionOf = new Array(nodeCount).fill(null);
order.forEach((leafId, idx) => {
  angleOf[leafId] = Math.PI / 2 - idx * ((2 * Math.PI) / n);
  radiusOf[leafId] = 1;
  regionOf[leafId] = samples[leafId].region;
});
for (let id = n; id < nodeCount; id++) {
  const [a, b, height] = linkage[id - n];
  angleOf[id] = (angleOf[a] + angleOf[b]) / 2;
  radiusOf[id] = 1 - height / maxHeight;
  regionOf[id] = regionOf[a] === regionOf[b] ? regionOf[a] : null;
}

const REGION_COLORS = t.palette.slice(0, REGIONS.length);

// --- MUI X scatter series: one per region, positioned on the unit circle ----
const scatterSeries = REGIONS.map((region, regionId) => ({
  type: "scatter",
  data: samples
    .filter((s) => s.region === regionId)
    .map((s) => ({ id: s.name, x: Math.cos(angleOf[s.id]), y: Math.sin(angleOf[s.id]) })),
  label: region.name,
  color: REGION_COLORS[regionId],
  markerSize: 11,
}));

// --- Custom SVG overlay: reference rings, branches, metadata ring, labels ---
// Drawn on the ChartContainer's own coordinate system via useXScale/useYScale,
// the standard MUI X composition pattern for chart types the library has no
// built-in component for.
function RadialDendrogram() {
  const xs = useXScale();
  const ys = useYScale();
  if (!xs || !ys) return null;

  const cx = xs(0);
  const cy = ys(0);
  const px = (r) => Math.abs(xs(r) - cx);
  const point = (r, theta) => ({ x: xs(r * Math.cos(theta)), y: ys(r * Math.sin(theta)) });

  // Sample an arc between two angles (shortest way round) into an SVG path —
  // avoids reasoning about SVG's sweep-flag convention entirely.
  function arcPath(r, angleA, angleB, steps) {
    let diff = angleB - angleA;
    while (diff > Math.PI) diff -= 2 * Math.PI;
    while (diff < -Math.PI) diff += 2 * Math.PI;
    let d = "";
    for (let i = 0; i <= steps; i++) {
      const p = point(r, angleA + (diff * i) / steps);
      d += (i === 0 ? "M" : "L") + `${p.x},${p.y} `;
    }
    return d;
  }

  const branches = [];
  for (let id = n; id < nodeCount; id++) {
    const [a, b] = linkage[id - n];
    const rParent = radiusOf[id];
    const bridgeColor = regionOf[id] !== null ? REGION_COLORS[regionOf[id]] : t.inkSoft;
    branches.push(
      <path
        key={`arc-${id}`}
        d={arcPath(rParent, angleOf[a], angleOf[b], 14)}
        fill="none"
        stroke={bridgeColor}
        strokeWidth={2.5}
        strokeLinecap="round"
      />,
    );
    [a, b].forEach((child) => {
      const childColor = regionOf[child] !== null ? REGION_COLORS[regionOf[child]] : t.inkSoft;
      const p1 = point(rParent, angleOf[child]);
      const p2 = point(radiusOf[child], angleOf[child]);
      branches.push(
        <line
          key={`seg-${id}-${child}`}
          x1={p1.x}
          y1={p1.y}
          x2={p2.x}
          y2={p2.y}
          stroke={childColor}
          strokeWidth={2.5}
          strokeLinecap="round"
        />,
      );
    });
  }

  // Outer metadata ring — one colored arc segment per leaf, encoding region.
  const ringInner = 1.06;
  const ringOuter = 1.13;
  const ringMid = (ringInner + ringOuter) / 2;
  const ringThickness = px(ringOuter) - px(ringInner);
  const metadataRing = order.map((leafId) => {
    const half = (Math.PI / n) * 0.72;
    return (
      <path
        key={`ring-${leafId}`}
        d={arcPath(ringMid, angleOf[leafId] - half, angleOf[leafId] + half, 4)}
        fill="none"
        stroke={REGION_COLORS[samples[leafId].region]}
        strokeWidth={ringThickness}
        strokeLinecap="butt"
      />
    );
  });

  const labelRadius = 1.24;
  const labels = order.map((leafId) => {
    const theta = angleOf[leafId];
    const p = point(labelRadius, theta);
    const rotDeg = (Math.atan2(p.y - cy, p.x - cx) * 180) / Math.PI;
    const flip = Math.cos(theta) < 0;
    return (
      <text
        key={`label-${leafId}`}
        x={p.x}
        y={p.y}
        transform={`rotate(${flip ? rotDeg + 180 : rotDeg}, ${p.x}, ${p.y})`}
        textAnchor={flip ? "end" : "start"}
        dominantBaseline="middle"
        fontSize={13}
        fontFamily={FONT}
        fill={t.inkSoft}
      >
        {samples[leafId].name}
      </text>
    );
  });

  return (
    <g>
      {[0.25, 0.5, 0.75, 1.0].map((frac) => (
        <circle key={`ref-${frac}`} cx={cx} cy={cy} r={px(frac)} fill="none" stroke={t.grid} strokeWidth={1} />
      ))}
      {metadataRing}
      {branches}
      <circle cx={cx} cy={cy} r={5} fill={t.inkSoft} />
      {labels}
    </g>
  );
}

export default function Chart() {
  const W = window.ANYPLOT_SIZE.width;
  const H = window.ANYPLOT_SIZE.height;
  const TITLE_H = 72;
  const LEGEND_H = 96;
  const chartSize = Math.min(W, H - TITLE_H - LEGEND_H);

  return (
    <div
      style={{
        width: W,
        height: H,
        background: t.pageBg,
        fontFamily: FONT,
        display: "flex",
        flexDirection: "column",
        alignItems: "center",
      }}
    >
      <div style={{ height: TITLE_H, display: "flex", alignItems: "center" }}>
        <span style={{ fontSize: 22, fontWeight: 600, color: t.ink }}>
          dendrogram-radial · javascript · muix · anyplot.ai
        </span>
      </div>
      <ChartContainer
        width={chartSize}
        height={chartSize}
        skipAnimation
        series={scatterSeries}
        margin={{ top: 20, right: 20, bottom: 20, left: 20 }}
        xAxis={[{ min: -1.3, max: 1.3 }]}
        yAxis={[{ min: -1.3, max: 1.3 }]}
      >
        <RadialDendrogram />
        <ScatterPlot />
      </ChartContainer>
      <div
        style={{
          height: LEGEND_H,
          display: "flex",
          alignItems: "center",
          justifyContent: "center",
          gap: 28,
          flexWrap: "wrap",
        }}
      >
        {REGIONS.map((region, i) => (
          <div key={region.code} style={{ display: "flex", alignItems: "center", gap: 8 }}>
            <span
              style={{
                width: 14,
                height: 14,
                borderRadius: "50%",
                background: REGION_COLORS[i],
                display: "inline-block",
              }}
            />
            <span style={{ fontSize: 14, color: t.ink }}>{region.name}</span>
          </div>
        ))}
      </div>
    </div>
  );
}
Runnable source as JSON, for any HTTP client: https://api.anyplot.ai/specs/dendrogram-radial/muix/code. Any spec id and library id listed in llms-full.txt fit the same URL shape; every URL below is complete and callable.
{
  "spec_id": "dendrogram-radial",
  "language": "javascript",
  "library": "muix",
  "page": "https://anyplot.ai/dendrogram-radial/javascript/muix",
  "hub": "https://anyplot.ai/dendrogram-radial",
  "code_json": "https://api.anyplot.ai/specs/dendrogram-radial/muix/code",
  "spec_json": "https://api.anyplot.ai/specs/dendrogram-radial",
  "render_light_png": "https://storage.googleapis.com/anyplot-images/plots/dendrogram-radial/javascript/muix/plot-light.png",
  "render_dark_png": "https://storage.googleapis.com/anyplot-images/plots/dendrogram-radial/javascript/muix/plot-dark.png",
  "interactive_light_html": "https://storage.googleapis.com/anyplot-images/plots/dendrogram-radial/javascript/muix/plot-light.html",
  "interactive_dark_html": "https://storage.googleapis.com/anyplot-images/plots/dendrogram-radial/javascript/muix/plot-dark.html",
  "quality_score": 90.0,
  "license": "MIT",
  "guide": "https://anyplot.ai/llms.txt"
}
Part of Radial Dendrogram on anyplot.ai.