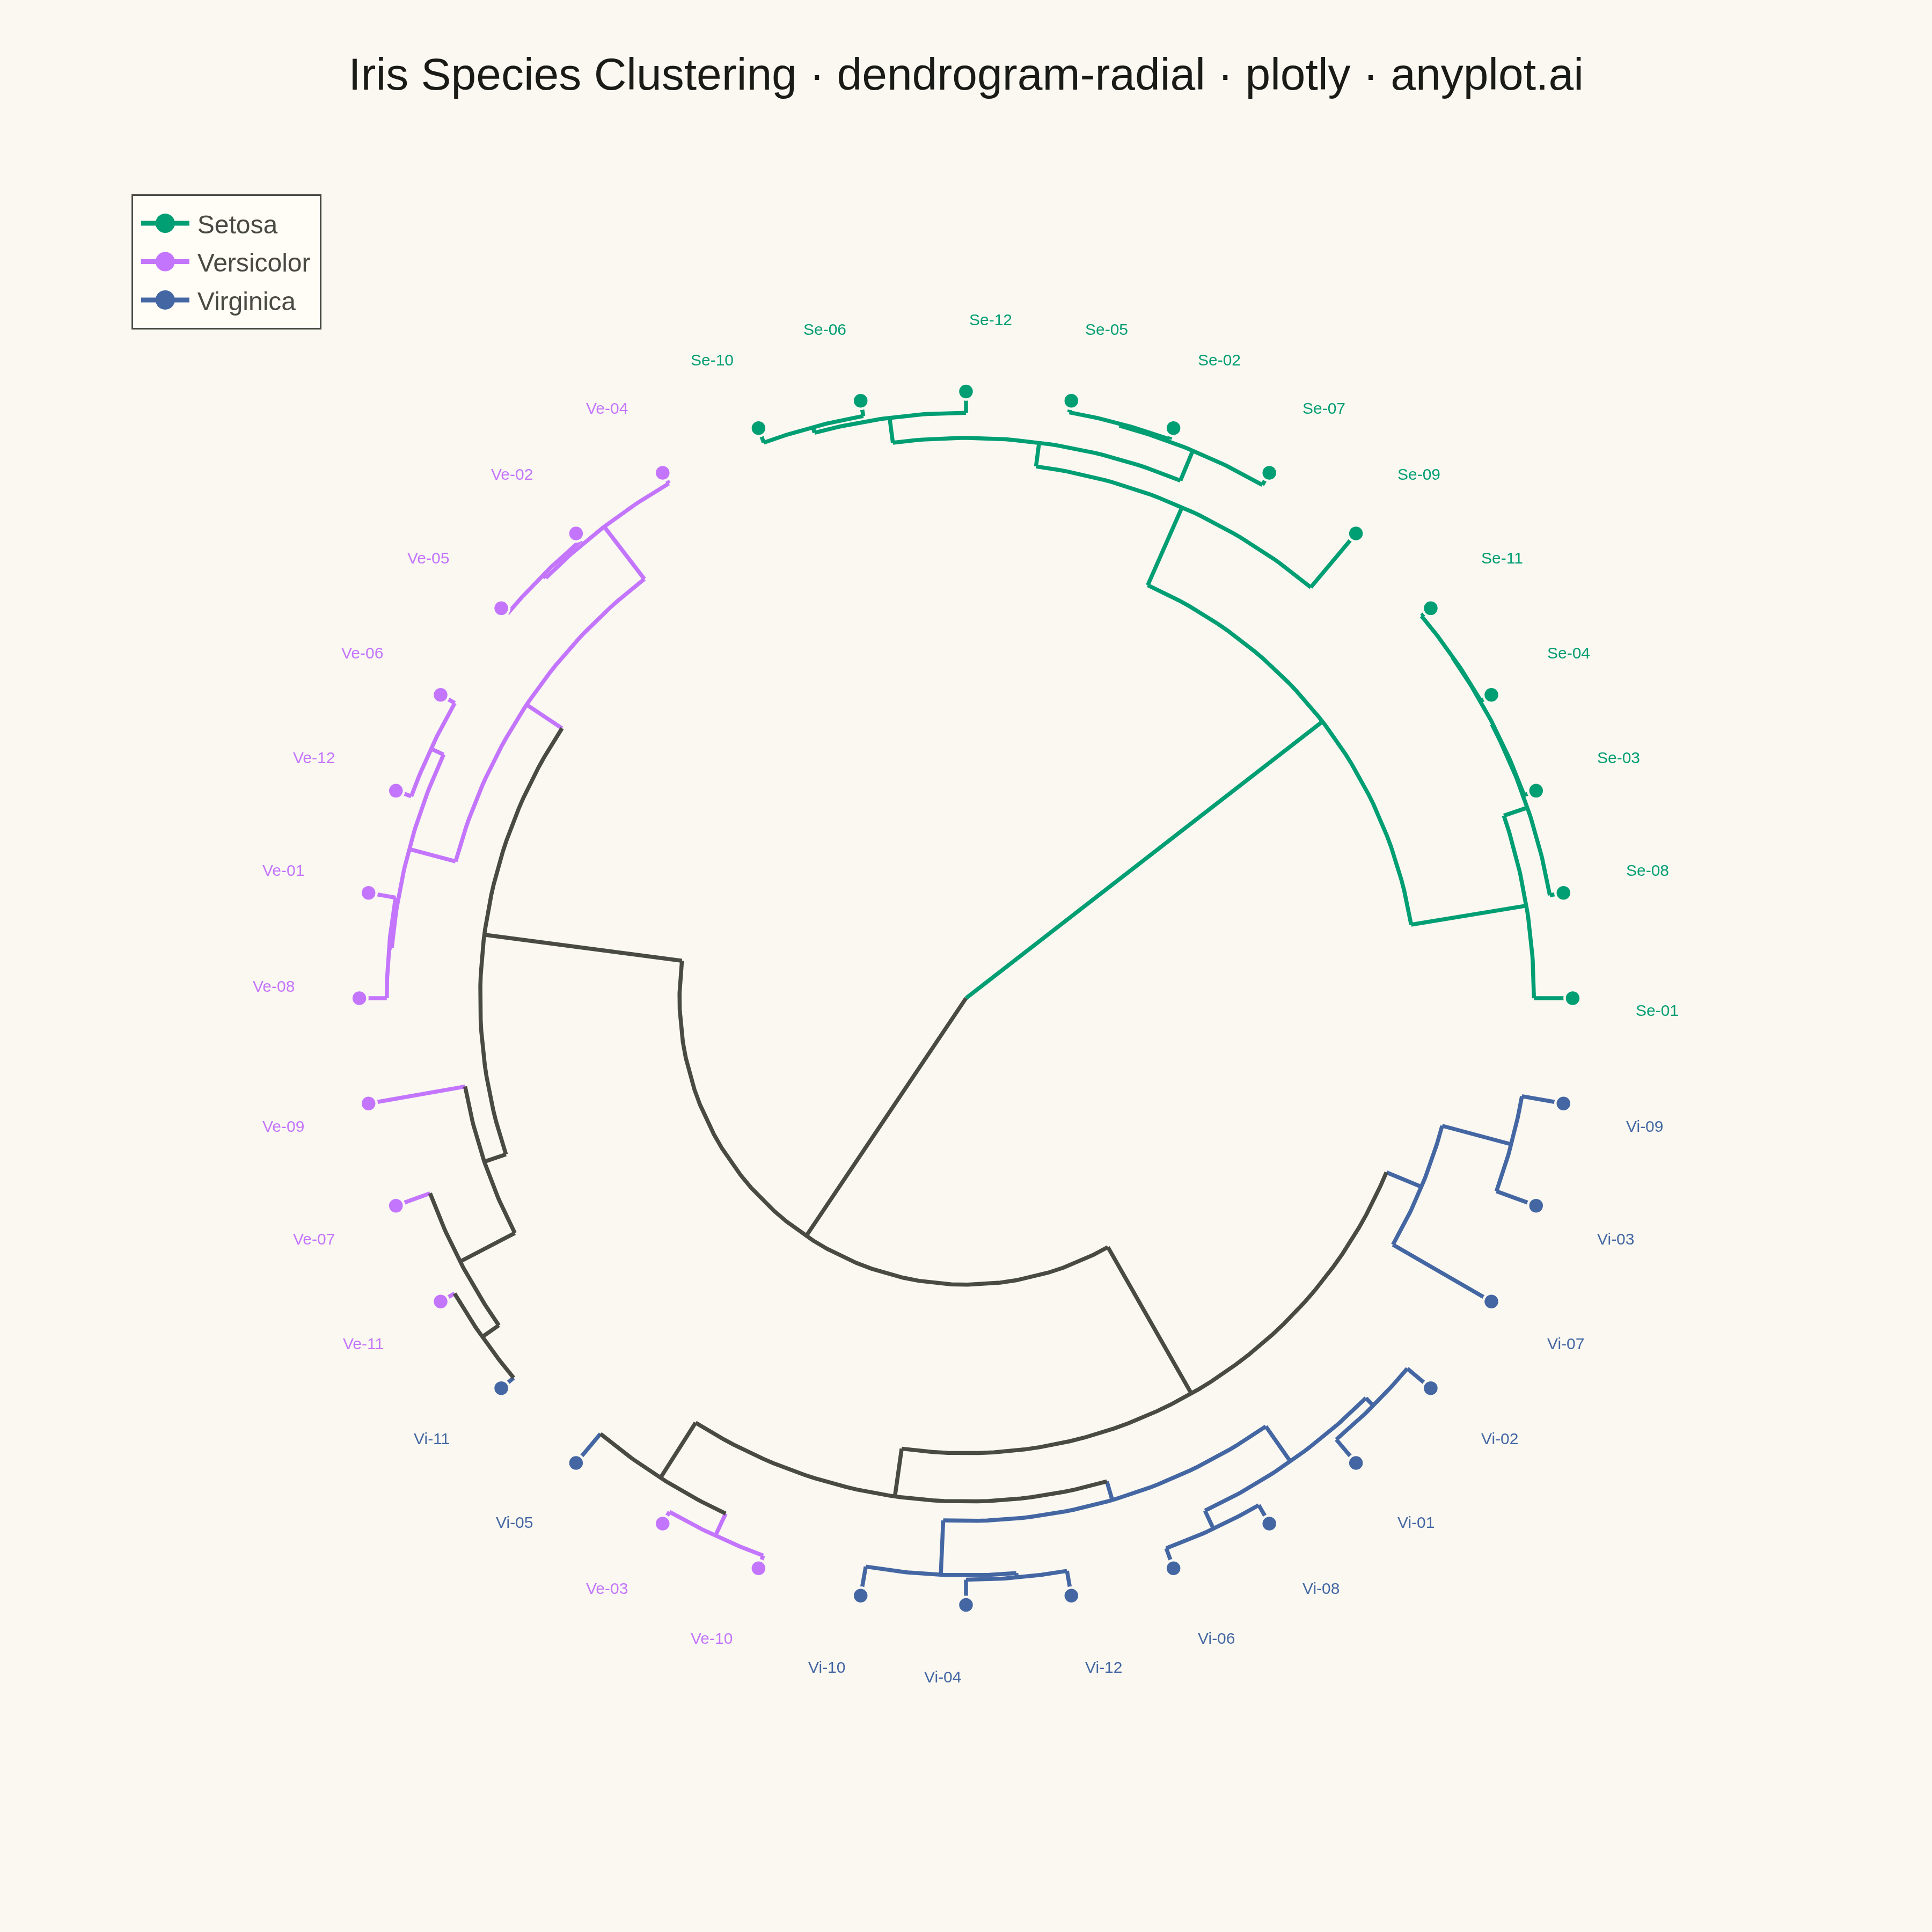
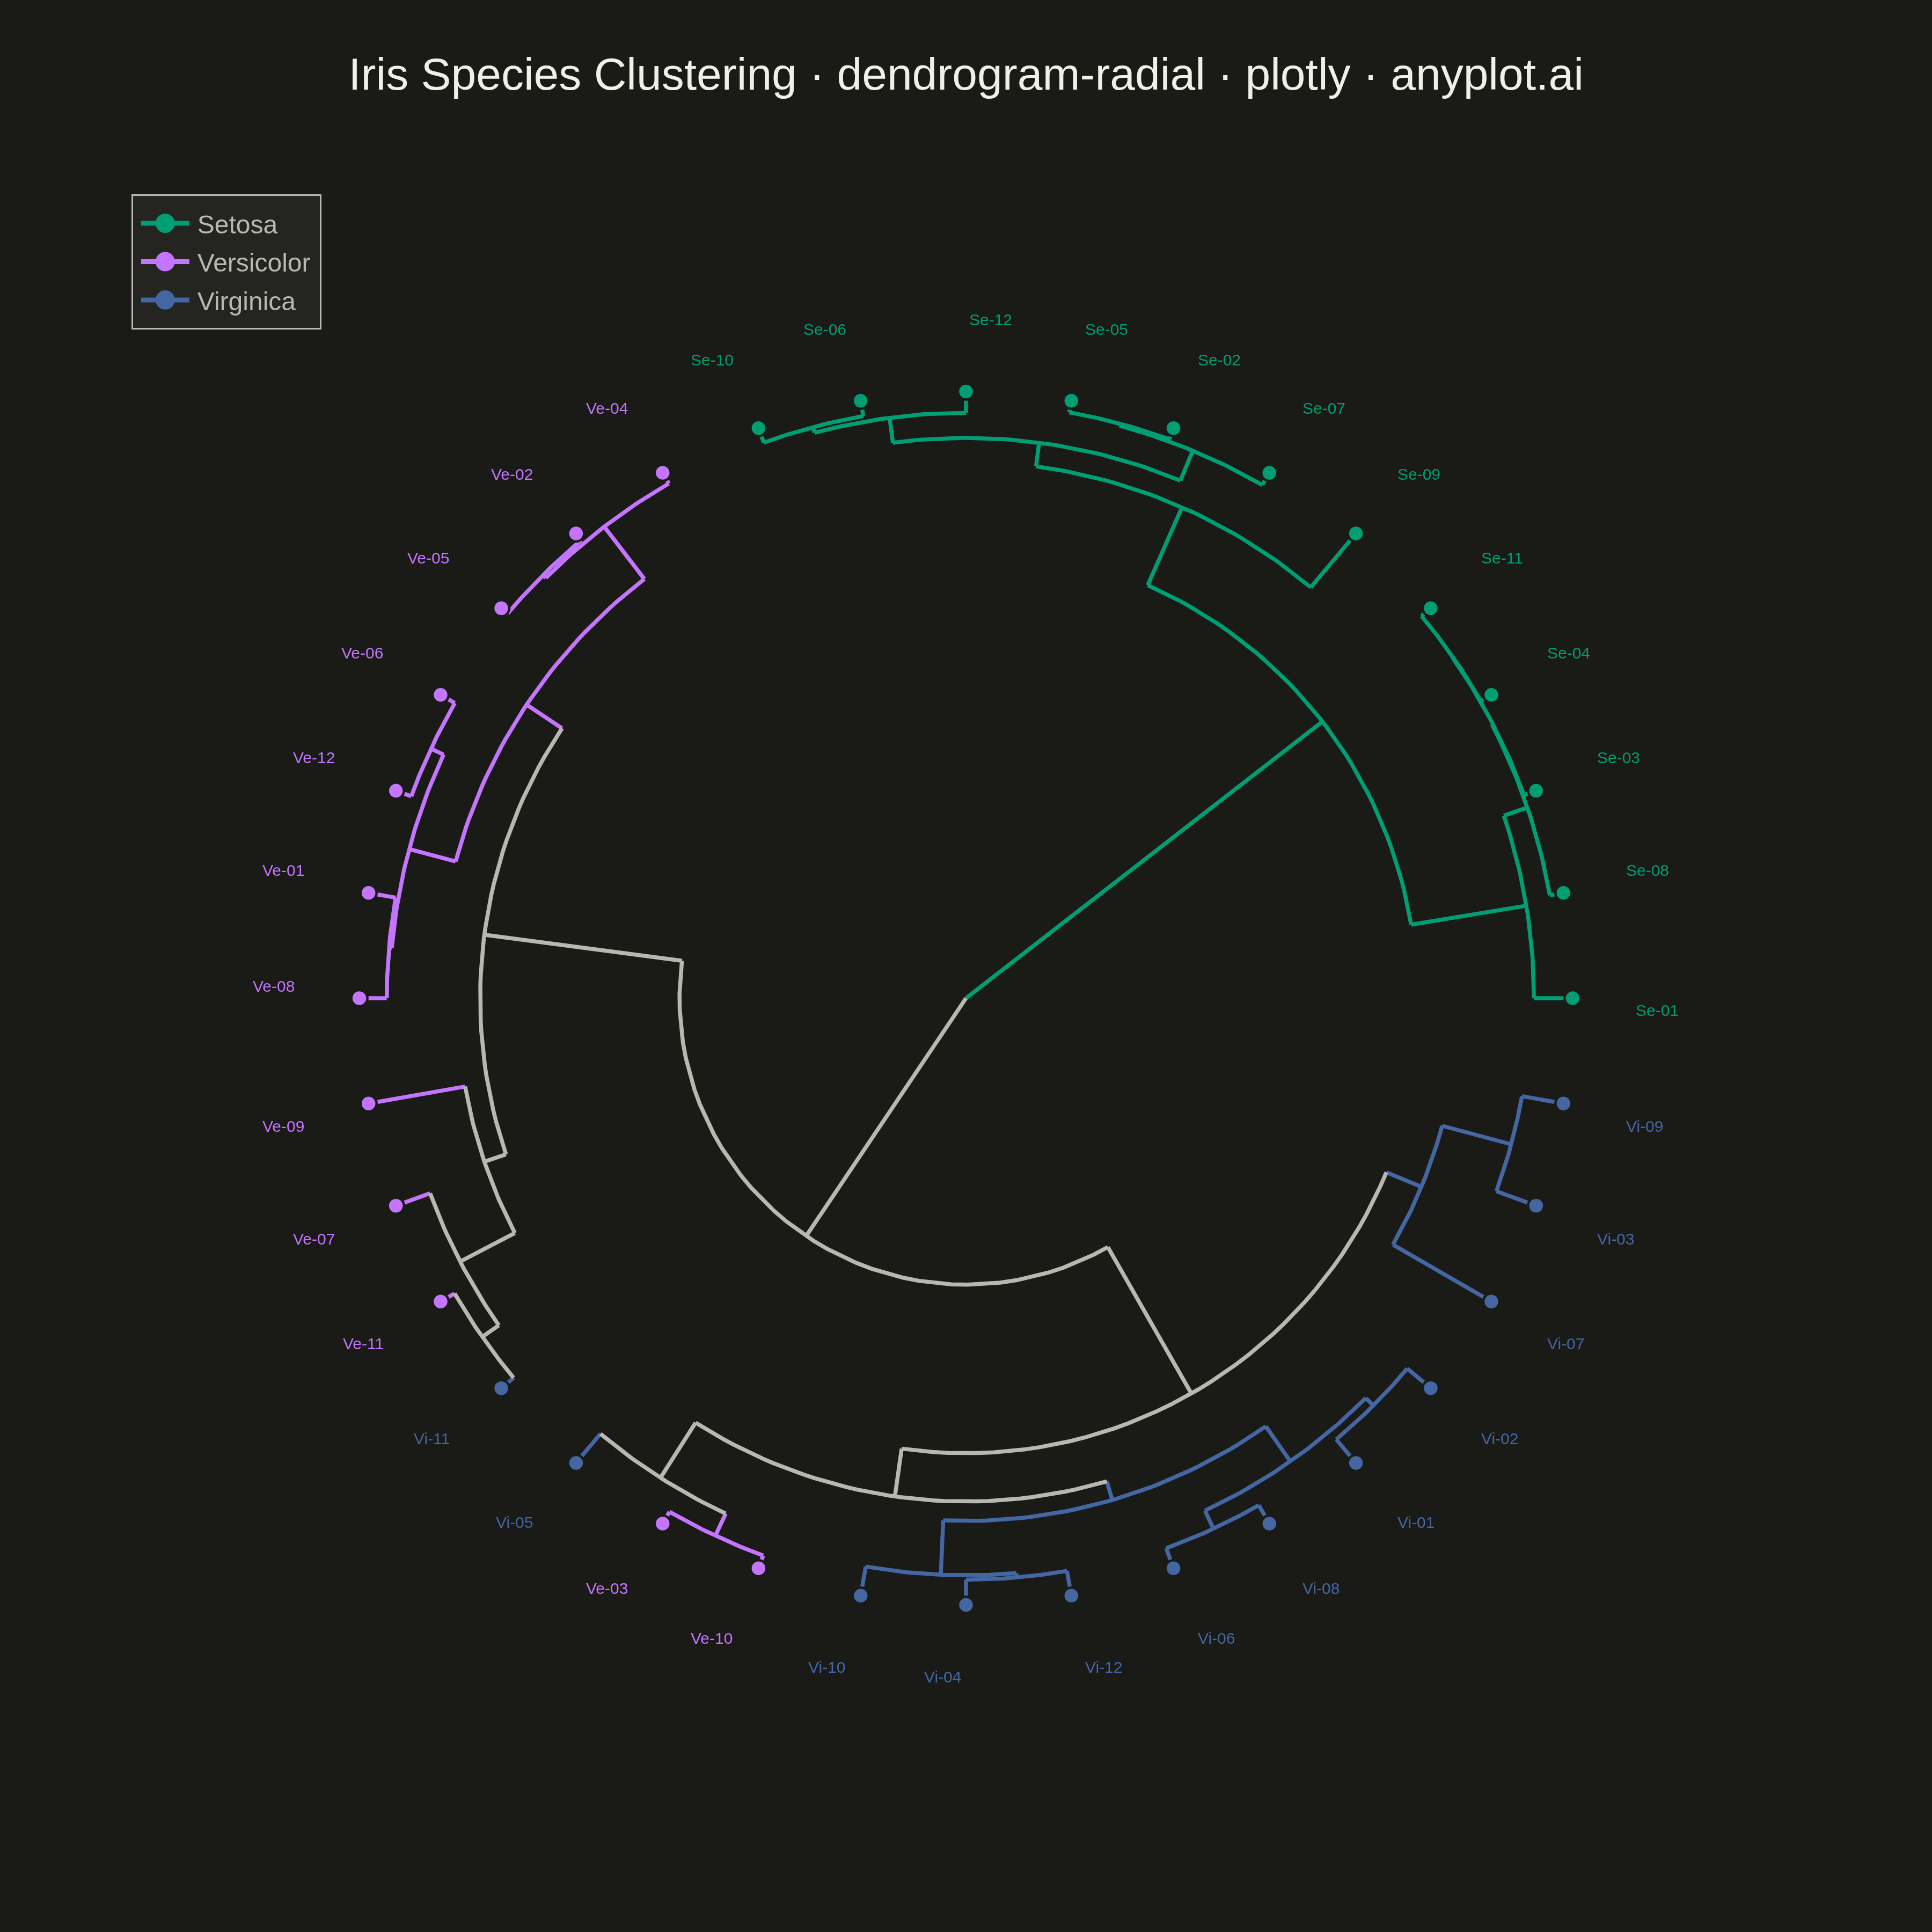
The same plot in 14 other libraries — Python: Altair, Bokeh, lets-plot, Matplotlib, plotnine, Pygal, Seaborn; R: ggplot2; Julia: Makie.jl; JavaScript: Chart.js, D3.js, Apache ECharts, Highcharts, MUI X Charts. Compare all 15 side by side: Radial Dendrogram in Python, R, Julia and JavaScript.
A radial dendrogram renders hierarchical clustering in a circular layout where the root node sits at the center and branches extend outward, with leaf nodes arranged around the circumference. This layout is a space-efficient alternative to linear dendrograms for large hierarchies, making it well-suited for datasets with hundreds of leaves. Branch lengths are proportional to distance or dissimilarity, preserving the quantitative interpretation of cluster merges.
""" anyplot.ai
dendrogram-radial: Radial Dendrogram
Library: plotly 6.7.0 | Python 3.13.13
Quality: 81/100 | Created: 2026-05-14
"""

import os

import numpy as np
import plotly.graph_objects as go
from scipy.cluster.hierarchy import dendrogram as scipy_dendrogram
from scipy.cluster.hierarchy import linkage
from sklearn.datasets import load_iris
from sklearn.preprocessing import StandardScaler


# Theme tokens
THEME = os.getenv("ANYPLOT_THEME", "light")
PAGE_BG = "#FAF8F1" if THEME == "light" else "#1A1A17"
ELEVATED_BG = "#FFFDF6" if THEME == "light" else "#242420"
INK = "#1A1A17" if THEME == "light" else "#F0EFE8"
INK_SOFT = "#4A4A44" if THEME == "light" else "#B8B7B0"

IMPRINT = ["#009E73", "#C475FD", "#4467A3"]
SPECIES = ["Setosa", "Versicolor", "Virginica"]

# Data: 12 samples per iris species (36 leaves total)
np.random.seed(42)
iris = load_iris()
picks = []
for cls in range(3):
    idx = np.where(iris.target == cls)[0]
    picks.extend(np.random.choice(idx, 12, replace=False).tolist())
picks = np.array(picks)

X = StandardScaler().fit_transform(iris.data[picks])
y = iris.target[picks]

species_count = [0, 0, 0]
labels = []
for cls in y:
    species_count[cls] += 1
    prefix = ["Se", "Ve", "Vi"][cls]
    labels.append(f"{prefix}-{species_count[cls]:02d}")

# Linkage and dendrogram leaf order
Z = linkage(X, method="ward")
n_leaves = len(X)
n_nodes = 2 * n_leaves - 1
max_dist = Z[-1, 2]

dend = scipy_dendrogram(Z, no_plot=True)
leaf_order = dend["leaves"]
leaf_pos = {leaf: pos for pos, leaf in enumerate(leaf_order)}

# Radial layout: degrees (counterclockwise from +x) and normalised radii
angles = np.zeros(n_nodes)
for leaf in range(n_leaves):
    angles[leaf] = leaf_pos[leaf] * 360.0 / n_leaves

radii = np.ones(n_nodes)  # leaves at r=1, root converges to r≈0
for i, row in enumerate(Z):
    node_id = n_leaves + i
    radii[node_id] = 1.0 - row[2] / max_dist

# Internal node angle = midpoint of its two children (safe: subtrees never wrap 0°/360°)
for i, row in enumerate(Z):
    node_id = n_leaves + i
    left, right = int(row[0]), int(row[1])
    angles[node_id] = (angles[left] + angles[right]) / 2.0

# Cluster purity per node for branch coloring
node_species = [set() for _ in range(n_nodes)]
for leaf in range(n_leaves):
    node_species[leaf] = {y[leaf]}
for i, row in enumerate(Z):
    node_id = n_leaves + i
    left, right = int(row[0]), int(row[1])
    node_species[node_id] = node_species[left] | node_species[right]


def branch_color(node_id):
    sp = node_species[node_id]
    if len(sp) == 1:
        return IMPRINT[next(iter(sp))]
    return INK_SOFT


# Build traces: one radial segment per child + one arc per merge
traces = []

for i, row in enumerate(Z):
    node_id = n_leaves + i
    left, right = int(row[0]), int(row[1])
    node_r = radii[node_id]

    # Left radial segment
    la = np.deg2rad(angles[left])
    traces.append(
        go.Scatter(
            x=[radii[left] * np.cos(la), node_r * np.cos(la)],
            y=[radii[left] * np.sin(la), node_r * np.sin(la)],
            mode="lines",
            line={"color": branch_color(left), "width": 2.5},
            showlegend=False,
            hoverinfo="skip",
        )
    )

    # Right radial segment
    ra = np.deg2rad(angles[right])
    traces.append(
        go.Scatter(
            x=[radii[right] * np.cos(ra), node_r * np.cos(ra)],
            y=[radii[right] * np.sin(ra), node_r * np.sin(ra)],
            mode="lines",
            line={"color": branch_color(right), "width": 2.5},
            showlegend=False,
            hoverinfo="skip",
        )
    )

    # Arc at node_r from left-child angle to right-child angle (always short arc)
    a1 = min(angles[left], angles[right])
    a2 = max(angles[left], angles[right])
    arc_t = np.linspace(np.deg2rad(a1), np.deg2rad(a2), 40)
    traces.append(
        go.Scatter(
            x=node_r * np.cos(arc_t),
            y=node_r * np.sin(arc_t),
            mode="lines",
            line={"color": branch_color(node_id), "width": 2.5},
            showlegend=False,
            hoverinfo="skip",
        )
    )

# Leaf markers with hover labels
leaf_rad = np.deg2rad([angles[i] for i in range(n_leaves)])
traces.append(
    go.Scatter(
        x=np.cos(leaf_rad),
        y=np.sin(leaf_rad),
        mode="markers",
        marker={"color": [IMPRINT[y[i]] for i in range(n_leaves)], "size": 10, "line": {"color": PAGE_BG, "width": 1.5}},
        showlegend=False,
        hovertext=[f"{labels[i]} · {SPECIES[y[i]]}" for i in range(n_leaves)],
        hoverinfo="text",
    )
)

# Legend entries
for idx, species in enumerate(SPECIES):
    traces.append(
        go.Scatter(
            x=[None],
            y=[None],
            mode="markers+lines",
            marker={"color": IMPRINT[idx], "size": 12},
            line={"color": IMPRINT[idx], "width": 3},
            name=species,
            showlegend=True,
        )
    )

fig = go.Figure(data=traces)

# Leaf label annotations placed just outside leaf markers
annotations = []
label_r = 1.10
for leaf in range(n_leaves):
    a_rad = np.deg2rad(angles[leaf])
    lx = label_r * np.cos(a_rad)
    ly = label_r * np.sin(a_rad)
    xanchor = "left" if np.cos(a_rad) >= 0 else "right"
    yanchor = "bottom" if np.sin(a_rad) > 0 else "top"
    annotations.append(
        {
            "x": lx,
            "y": ly,
            "text": labels[leaf],
            "font": {"size": 10, "color": IMPRINT[y[leaf]]},
            "showarrow": False,
            "xanchor": xanchor,
            "yanchor": yanchor,
        }
    )

fig.update_layout(
    title={
        "text": "Iris Species Clustering · dendrogram-radial · plotly · anyplot.ai",
        "font": {"size": 28, "color": INK},
        "x": 0.5,
        "xanchor": "center",
        "y": 0.97,
    },
    paper_bgcolor=PAGE_BG,
    plot_bgcolor=PAGE_BG,
    font={"color": INK},
    showlegend=True,
    legend={
        "x": 0.02, "y": 0.98, "bgcolor": ELEVATED_BG, "bordercolor": INK_SOFT, "borderwidth": 1, "font": {"color": INK_SOFT, "size": 16}
    },
    xaxis={"visible": False, "scaleanchor": "y", "scaleratio": 1, "range": [-1.38, 1.38]},
    yaxis={"visible": False, "range": [-1.38, 1.38]},
    annotations=annotations,
    margin={"l": 60, "r": 60, "t": 100, "b": 60},
)

fig.write_image(f"plot-{THEME}.png", width=1200, height=1200, scale=3)
fig.write_html(f"plot-{THEME}.html", include_plotlyjs="cdn")
Runnable source as JSON, for any HTTP client: https://api.anyplot.ai/specs/dendrogram-radial/plotly/code. Any spec id and library id listed in llms-full.txt fit the same URL shape; every URL below is complete and callable.
{
  "spec_id": "dendrogram-radial",
  "language": "python",
  "library": "plotly",
  "page": "https://anyplot.ai/dendrogram-radial/python/plotly",
  "hub": "https://anyplot.ai/dendrogram-radial",
  "code_json": "https://api.anyplot.ai/specs/dendrogram-radial/plotly/code",
  "spec_json": "https://api.anyplot.ai/specs/dendrogram-radial",
  "render_light_png": "https://storage.googleapis.com/anyplot-images/plots/dendrogram-radial/python/plotly/plot-light.png",
  "render_dark_png": "https://storage.googleapis.com/anyplot-images/plots/dendrogram-radial/python/plotly/plot-dark.png",
  "interactive_light_html": "https://storage.googleapis.com/anyplot-images/plots/dendrogram-radial/python/plotly/plot-light.html",
  "interactive_dark_html": "https://storage.googleapis.com/anyplot-images/plots/dendrogram-radial/python/plotly/plot-dark.html",
  "quality_score": 81.0,
  "license": "MIT",
  "guide": "https://anyplot.ai/llms.txt"
}
Part of Radial Dendrogram on anyplot.ai.