The same plot in 14 other libraries — Python: Altair, Bokeh, Matplotlib, Plotly, plotnine, Pygal, Seaborn; R: ggplot2; Julia: Makie.jl; JavaScript: Chart.js, D3.js, Apache ECharts, Highcharts, MUI X Charts. Compare all 15 side by side: Radial Dendrogram in Python, R, Julia and JavaScript.
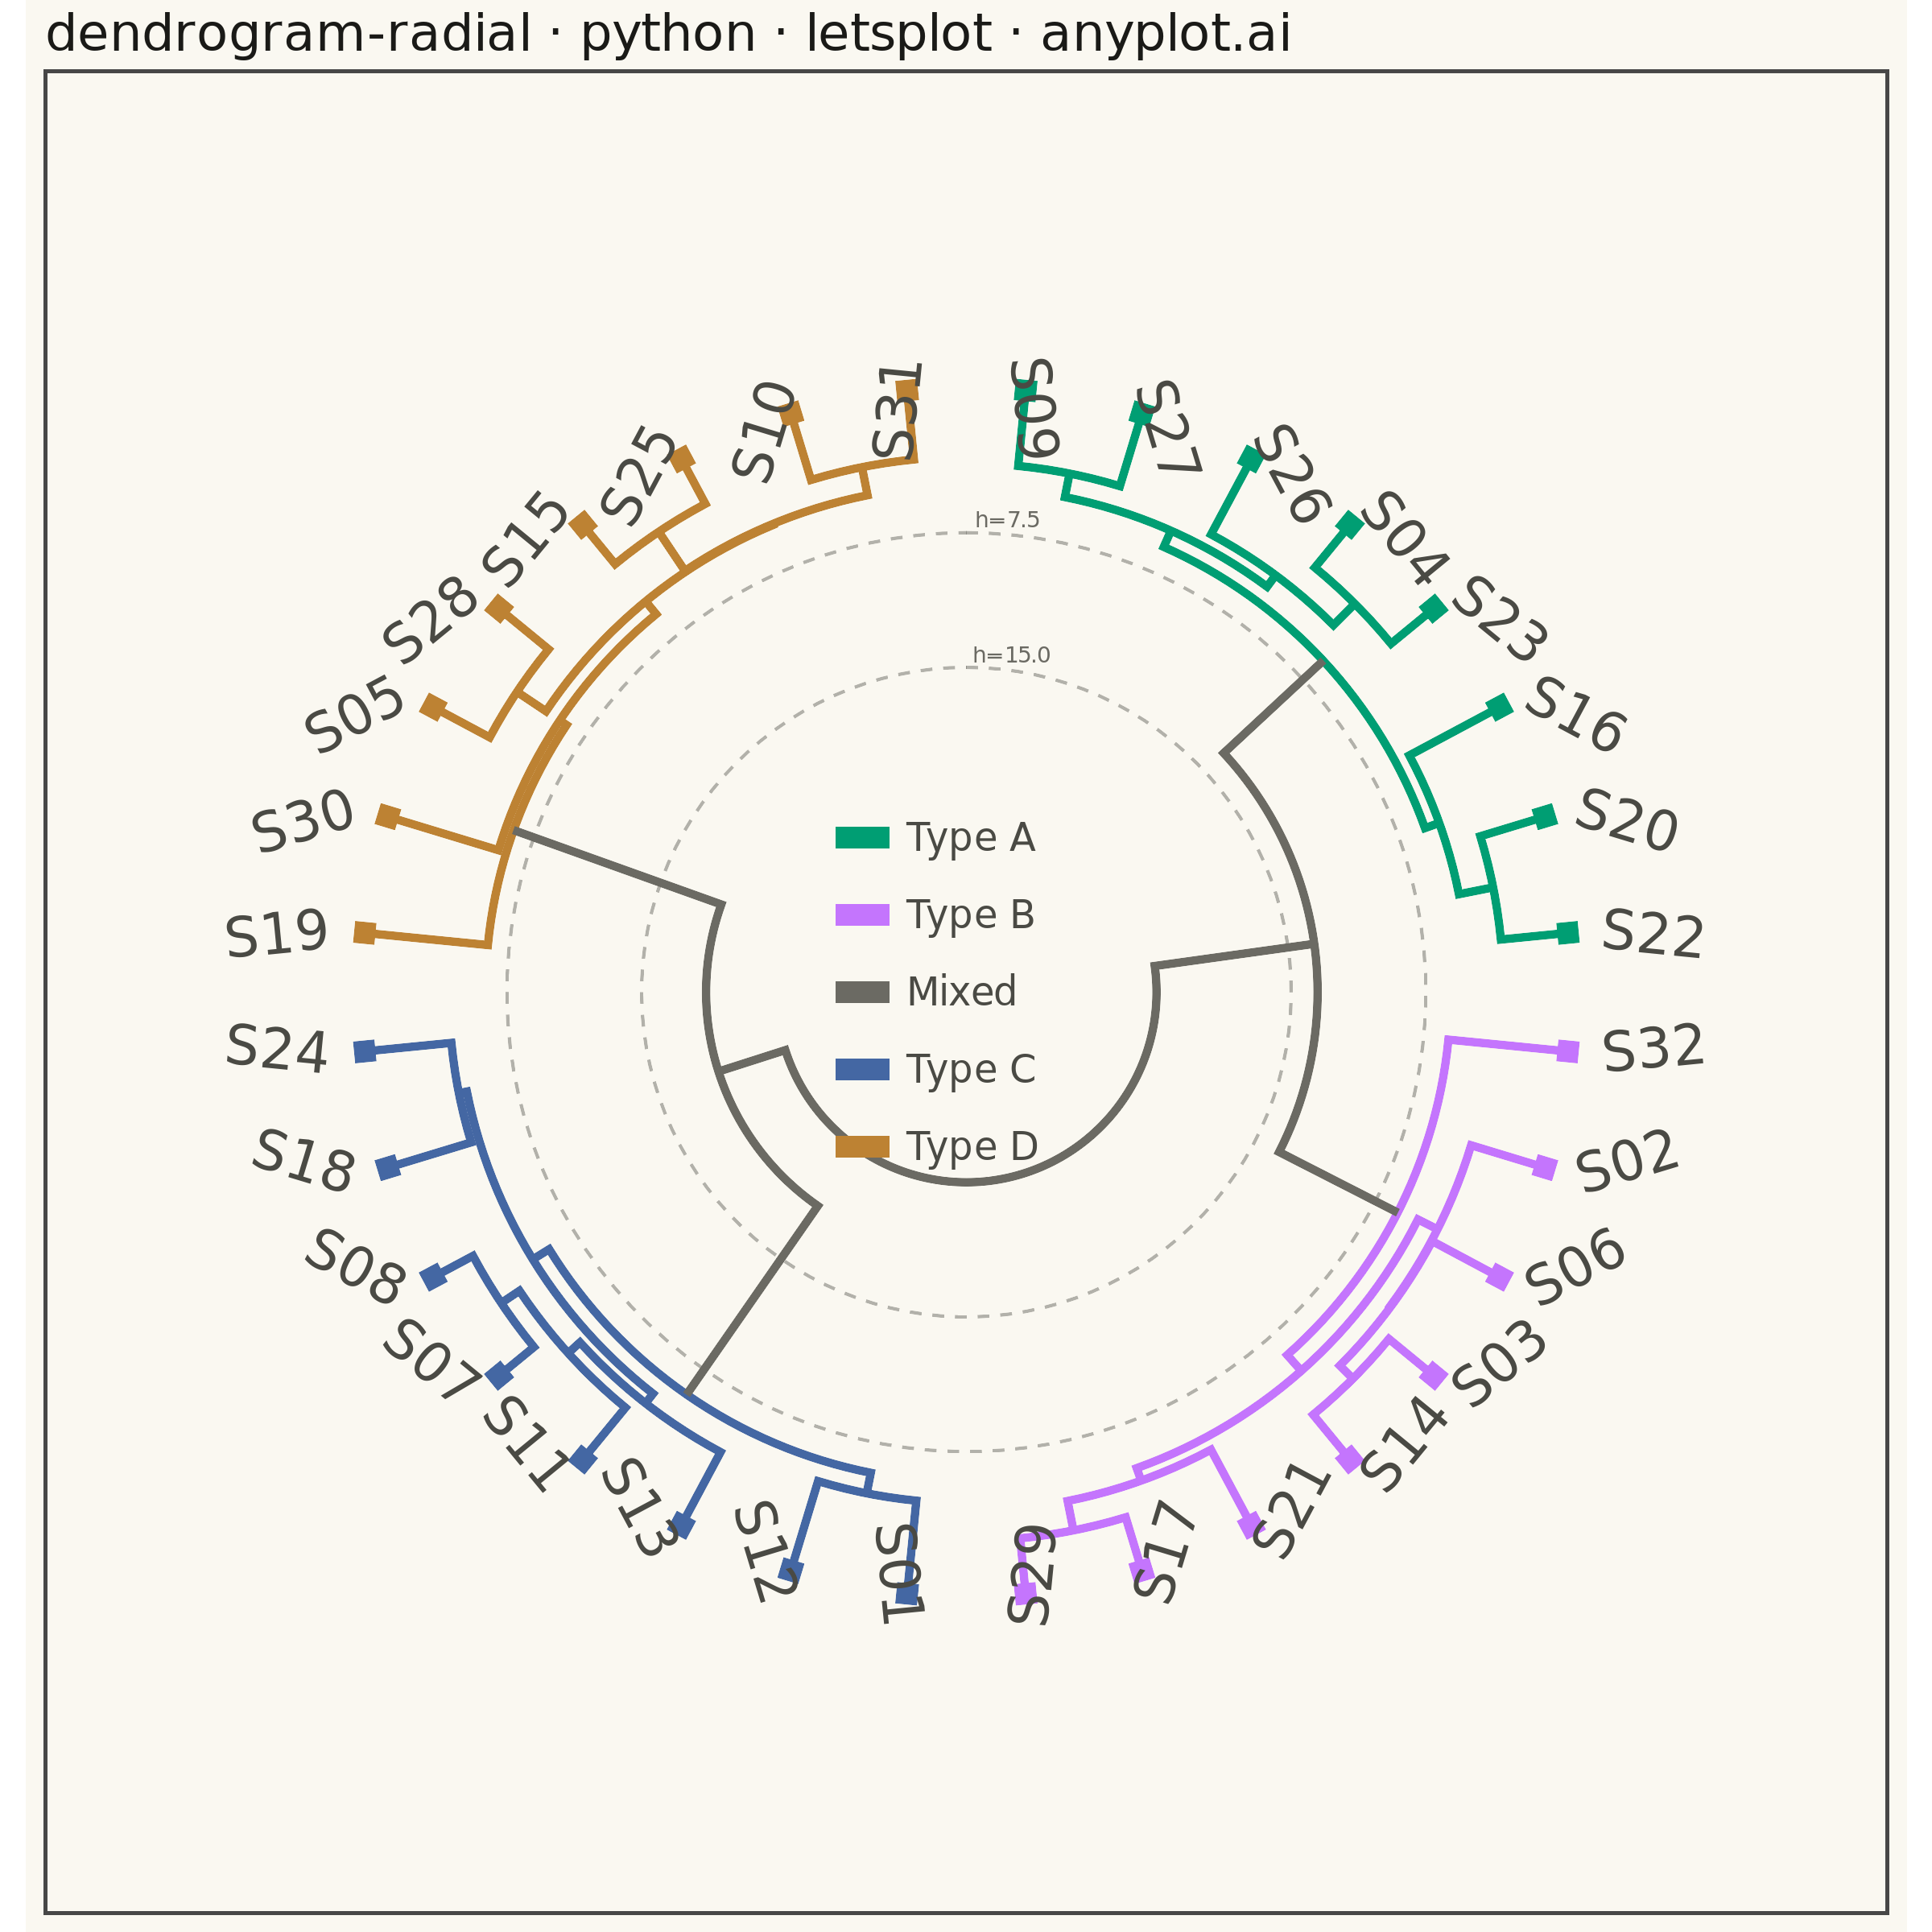
A radial dendrogram renders hierarchical clustering in a circular layout where the root node sits at the center and branches extend outward, with leaf nodes arranged around the circumference. This layout is a space-efficient alternative to linear dendrograms for large hierarchies, making it well-suited for datasets with hundreds of leaves. Branch lengths are proportional to distance or dissimilarity, preserving the quantitative interpretation of cluster merges.
""" anyplot.ai
dendrogram-radial: Radial Dendrogram
Library: letsplot 4.11.0 | Python 3.13.15
Quality: 92/100 | Created: 2026-08-24
"""

import os

import numpy as np
import pandas as pd
from lets_plot import *
from scipy.cluster.hierarchy import dendrogram, fcluster, linkage
from sklearn.datasets import make_blobs


LetsPlot.setup_html()

# Theme tokens (see prompts/default-style-guide.md "Background" + "Theme-adaptive Chrome")
THEME = os.getenv("ANYPLOT_THEME", "light")
PAGE_BG = "#FAF8F1" if THEME == "light" else "#1A1A17"
INK = "#1A1A17" if THEME == "light" else "#F0EFE8"
INK_SOFT = "#4A4A44" if THEME == "light" else "#B8B7B0"
INK_MUTED = "#6B6A63" if THEME == "light" else "#A8A79F"

# Imprint palette — first series always #009E73 (brand green)
IMPRINT_PALETTE = ["#009E73", "#C475FD", "#4467A3", "#BD8233"]

# Data — synthetic marker-gene expression profiles for 32 tissue samples that
# form 4 latent cell-type clusters, summarized by hierarchical clustering
np.random.seed(42)
n_leaves = 32
n_clusters = 4
expression, _ = make_blobs(n_samples=n_leaves, centers=n_clusters, n_features=6, cluster_std=1.6, random_state=42)

linkage_matrix = linkage(expression, method="average")
cluster_ids = fcluster(linkage_matrix, t=n_clusters, criterion="maxclust")

sample_labels = [f"S{i + 1:02d}" for i in range(n_leaves)]
cell_type_names = {1: "Cell type A", 2: "Cell type B", 3: "Cell type C", 4: "Cell type D"}
cluster_color = {cluster_id: IMPRINT_PALETTE[cluster_id - 1] for cluster_id in cell_type_names}
STRUCTURAL = "Between clusters"

# Propagate cluster identity bottom-up through the linkage tree; a merge keeps
# its children's cluster label only while both sides still share one cluster,
# matching scipy's link_color_func node-id contract (node id = n_leaves + row)
node_cluster = {i: cluster_ids[i] for i in range(n_leaves)}
for i, (left, right, *_rest) in enumerate(linkage_matrix):
    left_cluster = node_cluster[int(left)]
    right_cluster = node_cluster[int(right)]
    node_cluster[n_leaves + i] = left_cluster if left_cluster == right_cluster else None

link_labels = {}
for i in range(len(linkage_matrix)):
    node_id = n_leaves + i
    cluster = node_cluster[node_id]
    link_labels[node_id] = cell_type_names[cluster] if cluster is not None else STRUCTURAL

ddata = dendrogram(
    linkage_matrix, no_plot=True, labels=sample_labels, link_color_func=lambda node_id: link_labels[node_id]
)

leaf_order = ddata["leaves"]  # original sample indices, left-to-right
icoord = ddata["icoord"]
dcoord = ddata["dcoord"]
branch_labels = ddata["color_list"]

# Radial layout — root at center, leaves on the circumference, radial
# distance proportional to merge height (as in the linear dendrogram). The
# center hole is sized to hold an in-panel legend (see "Legend" below) so the
# figure never needs an external ggplot legend, which lets-plot's PNG
# exporter fails to size correctly against a fixed square canvas.
R_OUTER = 1.0
R_INNER = 0.32
max_x = n_leaves * 10
max_height = linkage_matrix[:, 2].max()


def to_angle(x):
    return (x / max_x) * 2 * np.pi


def to_radius(height):
    return R_OUTER - (height / max_height) * (R_OUTER - R_INNER)


def polar_to_xy(angle, radius):
    return radius * np.sin(angle), radius * np.cos(angle)


# Branches — each scipy "U" shape (left riser, merge bar, right riser)
# becomes a radial line, an arc sampled at the merge radius, and a radial
# line back down, all pre-projected into Cartesian x/y
branch_rows = []
for path_id, ((x0, _x1, x2, _x3), (y0, y1, _y2, y3), branch_label) in enumerate(
    zip(icoord, dcoord, branch_labels, strict=True)
):
    left_angle = to_angle(x0)
    right_angle = to_angle(x2)
    merge_radius = to_radius(y1)
    left_child_radius = to_radius(y0)
    right_child_radius = to_radius(y3)

    arc_points = max(2, round(abs(right_angle - left_angle) / (2 * np.pi) * n_leaves * 8))
    arc_angles = np.linspace(left_angle, right_angle, arc_points)

    polar_points = [(left_angle, left_child_radius), (left_angle, merge_radius)]
    polar_points += [(angle, merge_radius) for angle in arc_angles]
    polar_points.append((right_angle, right_child_radius))

    for order, (angle, radius) in enumerate(polar_points):
        px, py = polar_to_xy(angle, radius)
        branch_rows.append({"path_id": path_id, "order": order, "x": px, "y": py, "cluster": branch_label})

branches_df = pd.DataFrame(branch_rows)

# Leaves — an outer ring tick (redundant cluster encoding) plus a rotated
# label that stays upright and reads outward on both halves of the circle
leaf_rows = []
for position, sample_index in enumerate(leaf_order):
    angle = to_angle(5 + position * 10)
    cluster = cell_type_names[cluster_ids[sample_index]]

    x_in, y_in = polar_to_xy(angle, R_OUTER)
    x_out, y_out = polar_to_xy(angle, R_OUTER + 0.035)
    x_label, y_label = polar_to_xy(angle, R_OUTER + 0.075)

    angle_deg = np.degrees(angle) % 360
    if angle_deg < 180:
        rotation = angle_deg - 90
        hjust = 0
    else:
        rotation = angle_deg - 270
        hjust = 1

    leaf_rows.append(
        {
            "sample": sample_labels[sample_index],
            "cluster": cluster,
            "x_in": x_in,
            "y_in": y_in,
            "x_out": x_out,
            "y_out": y_out,
            "x_label": x_label,
            "y_label": y_label,
            "rotation": rotation,
            "hjust": hjust,
        }
    )

leaves_df = pd.DataFrame(leaf_rows)

# Radial reference guide — faint dashed rings at two intermediate merge-height
# levels, so branch length has a scale anchor beyond eyeballing bare radius
RING_FRACTIONS = [1 / 3, 2 / 3]
ring_angles = np.linspace(0, 2 * np.pi, 120)
ring_rows = []
ring_label_rows = []
for ring_id, fraction in enumerate(RING_FRACTIONS):
    ring_height = fraction * max_height
    ring_radius = to_radius(ring_height)
    ring_rows += [
        {"ring_id": ring_id, "x": px, "y": py} for px, py in (polar_to_xy(a, ring_radius) for a in ring_angles)
    ]
    label_x, label_y = polar_to_xy(0.02, ring_radius)
    ring_label_rows.append({"x": label_x, "y": label_y, "text": f"h={ring_height:.1f}"})

rings_df = pd.DataFrame(ring_rows)
ring_labels_df = pd.DataFrame(ring_label_rows)

# Colors — Imprint palette for the 4 clusters, muted ink for merges that join
# two different clusters (the conventional "above cluster cut" styling)
color_values = {name: cluster_color[cid] for cid, name in cell_type_names.items()}
color_values[STRUCTURAL] = INK_MUTED

# Legend — drawn manually inside the empty center hole (color swatch + label
# per row) instead of a ggplot guide_legend(). lets-plot's PNG exporter (via
# ggsave scale=) cannot size a side/bottom legend against a fixed square
# canvas without leaving the panel letterboxed by transparent padding, so an
# in-panel legend is the reliable way to label 5 categories on this layout.
legend_rows = [
    (0.26, "Type A", "Cell type A"),
    (0.13, "Type B", "Cell type B"),
    (0.0, "Mixed", STRUCTURAL),
    (-0.13, "Type C", "Cell type C"),
    (-0.26, "Type D", "Cell type D"),
]
legend_df = pd.DataFrame(
    [
        {"y": y, "x0": -0.22, "x1": -0.13, "x_text": -0.10, "text": text, "cluster": cluster}
        for y, text, cluster in legend_rows
    ]
)

# Plot
title = "dendrogram-radial · python · letsplot · anyplot.ai"
plot = (
    ggplot()
    + geom_path(
        aes(x="x", y="y", group="ring_id"),
        data=rings_df,
        color=INK_MUTED,
        size=0.4,
        alpha=0.5,
        linetype="dashed",
        show_legend=False,
    )
    + geom_text(
        aes(x="x", y="y", label="text"),
        data=ring_labels_df,
        color=INK_MUTED,
        size=3.5,
        hjust=0,
        vjust=-0.3,
        show_legend=False,
    )
    + geom_path(aes(x="x", y="y", group="path_id", color="cluster"), data=branches_df, size=1.1, show_legend=False)
    + geom_segment(
        aes(x="x_in", y="y_in", xend="x_out", yend="y_out", color="cluster"),
        data=leaves_df,
        size=3,
        show_legend=False,
        tooltips=layer_tooltips().line("Sample|@sample").line("Cluster|@cluster"),
    )
    + geom_text(
        aes(x="x_label", y="y_label", label="sample", angle="rotation", hjust="hjust"),
        data=leaves_df,
        color=INK_SOFT,
        size=8.5,
        vjust=0.5,
        show_legend=False,
    )
    + geom_segment(aes(x="x0", y="y", xend="x1", yend="y", color="cluster"), data=legend_df, size=3, show_legend=False)
    + geom_text(
        aes(x="x_text", y="y", label="text"),
        data=legend_df,
        color=INK_SOFT,
        size=6,
        hjust=0,
        vjust=0.5,
        show_legend=False,
    )
    + scale_color_manual(values=color_values)
    + coord_fixed(ratio=1, xlim=[-1.55, 1.55], ylim=[-1.55, 1.55])
    + labs(title=title)
    + ggsize(600, 600)
    + theme(
        plot_background=element_rect(fill=PAGE_BG, color=PAGE_BG),
        panel_background=element_rect(fill=PAGE_BG),
        panel_grid=element_blank(),
        axis_title=element_blank(),
        axis_text=element_blank(),
        axis_ticks=element_blank(),
        axis_line=element_blank(),
        plot_title=element_text(color=INK, size=16),
    )
)

# Save
ggsave(plot, f"plot-{THEME}.png", path=".", scale=4)
ggsave(plot, f"plot-{THEME}.html", path=".")
Runnable source as JSON, for any HTTP client: https://api.anyplot.ai/specs/dendrogram-radial/letsplot/code. Any spec id and library id listed in llms-full.txt fit the same URL shape; every URL below is complete and callable.
{
  "spec_id": "dendrogram-radial",
  "language": "python",
  "library": "letsplot",
  "page": "https://anyplot.ai/dendrogram-radial/python/letsplot",
  "hub": "https://anyplot.ai/dendrogram-radial",
  "code_json": "https://api.anyplot.ai/specs/dendrogram-radial/letsplot/code",
  "spec_json": "https://api.anyplot.ai/specs/dendrogram-radial",
  "render_light_png": "https://storage.googleapis.com/anyplot-images/plots/dendrogram-radial/python/letsplot/plot-light.png",
  "render_dark_png": "https://storage.googleapis.com/anyplot-images/plots/dendrogram-radial/python/letsplot/plot-dark.png",
  "interactive_light_html": "https://storage.googleapis.com/anyplot-images/plots/dendrogram-radial/python/letsplot/plot-light.html",
  "interactive_dark_html": "https://storage.googleapis.com/anyplot-images/plots/dendrogram-radial/python/letsplot/plot-dark.html",
  "quality_score": 92.0,
  "license": "MIT",
  "guide": "https://anyplot.ai/llms.txt"
}
Part of Radial Dendrogram on anyplot.ai.