The same plot in 14 other libraries — Python: Altair, Bokeh, lets-plot, Matplotlib, Plotly, plotnine, Seaborn; R: ggplot2; Julia: Makie.jl; JavaScript: Chart.js, D3.js, Apache ECharts, Highcharts, MUI X Charts. Compare all 15 side by side: Radial Dendrogram in Python, R, Julia and JavaScript.
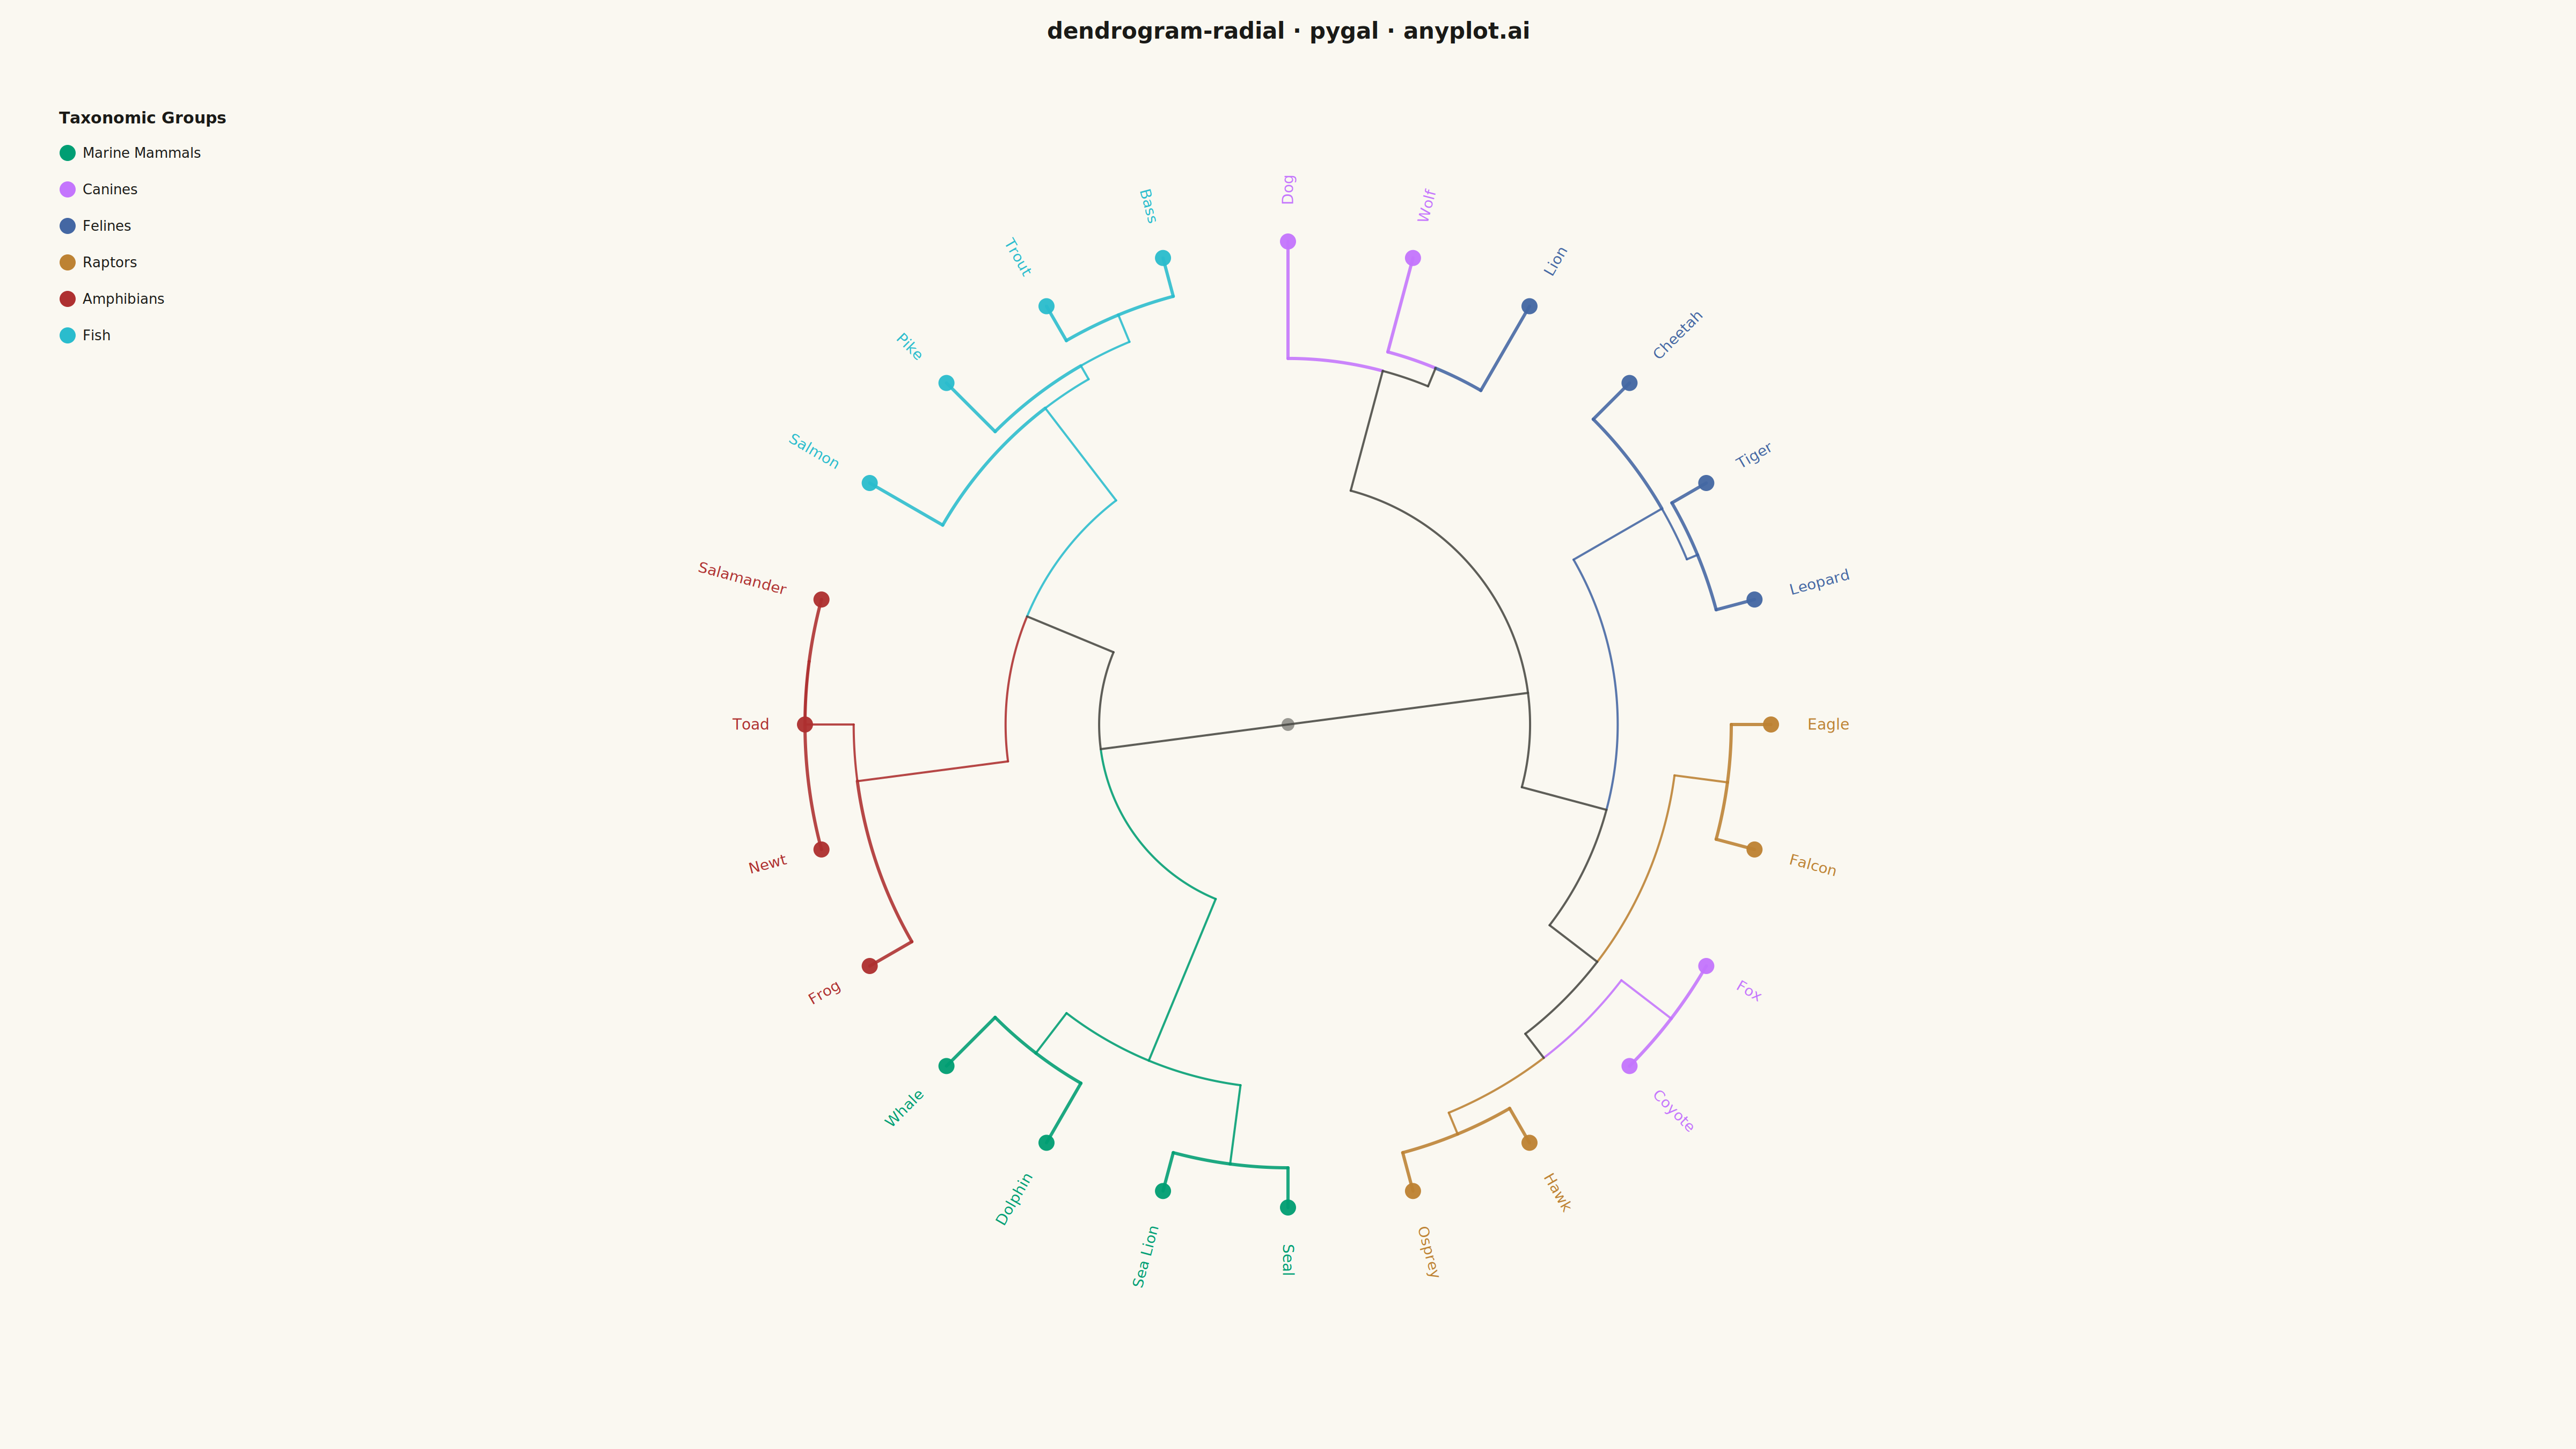
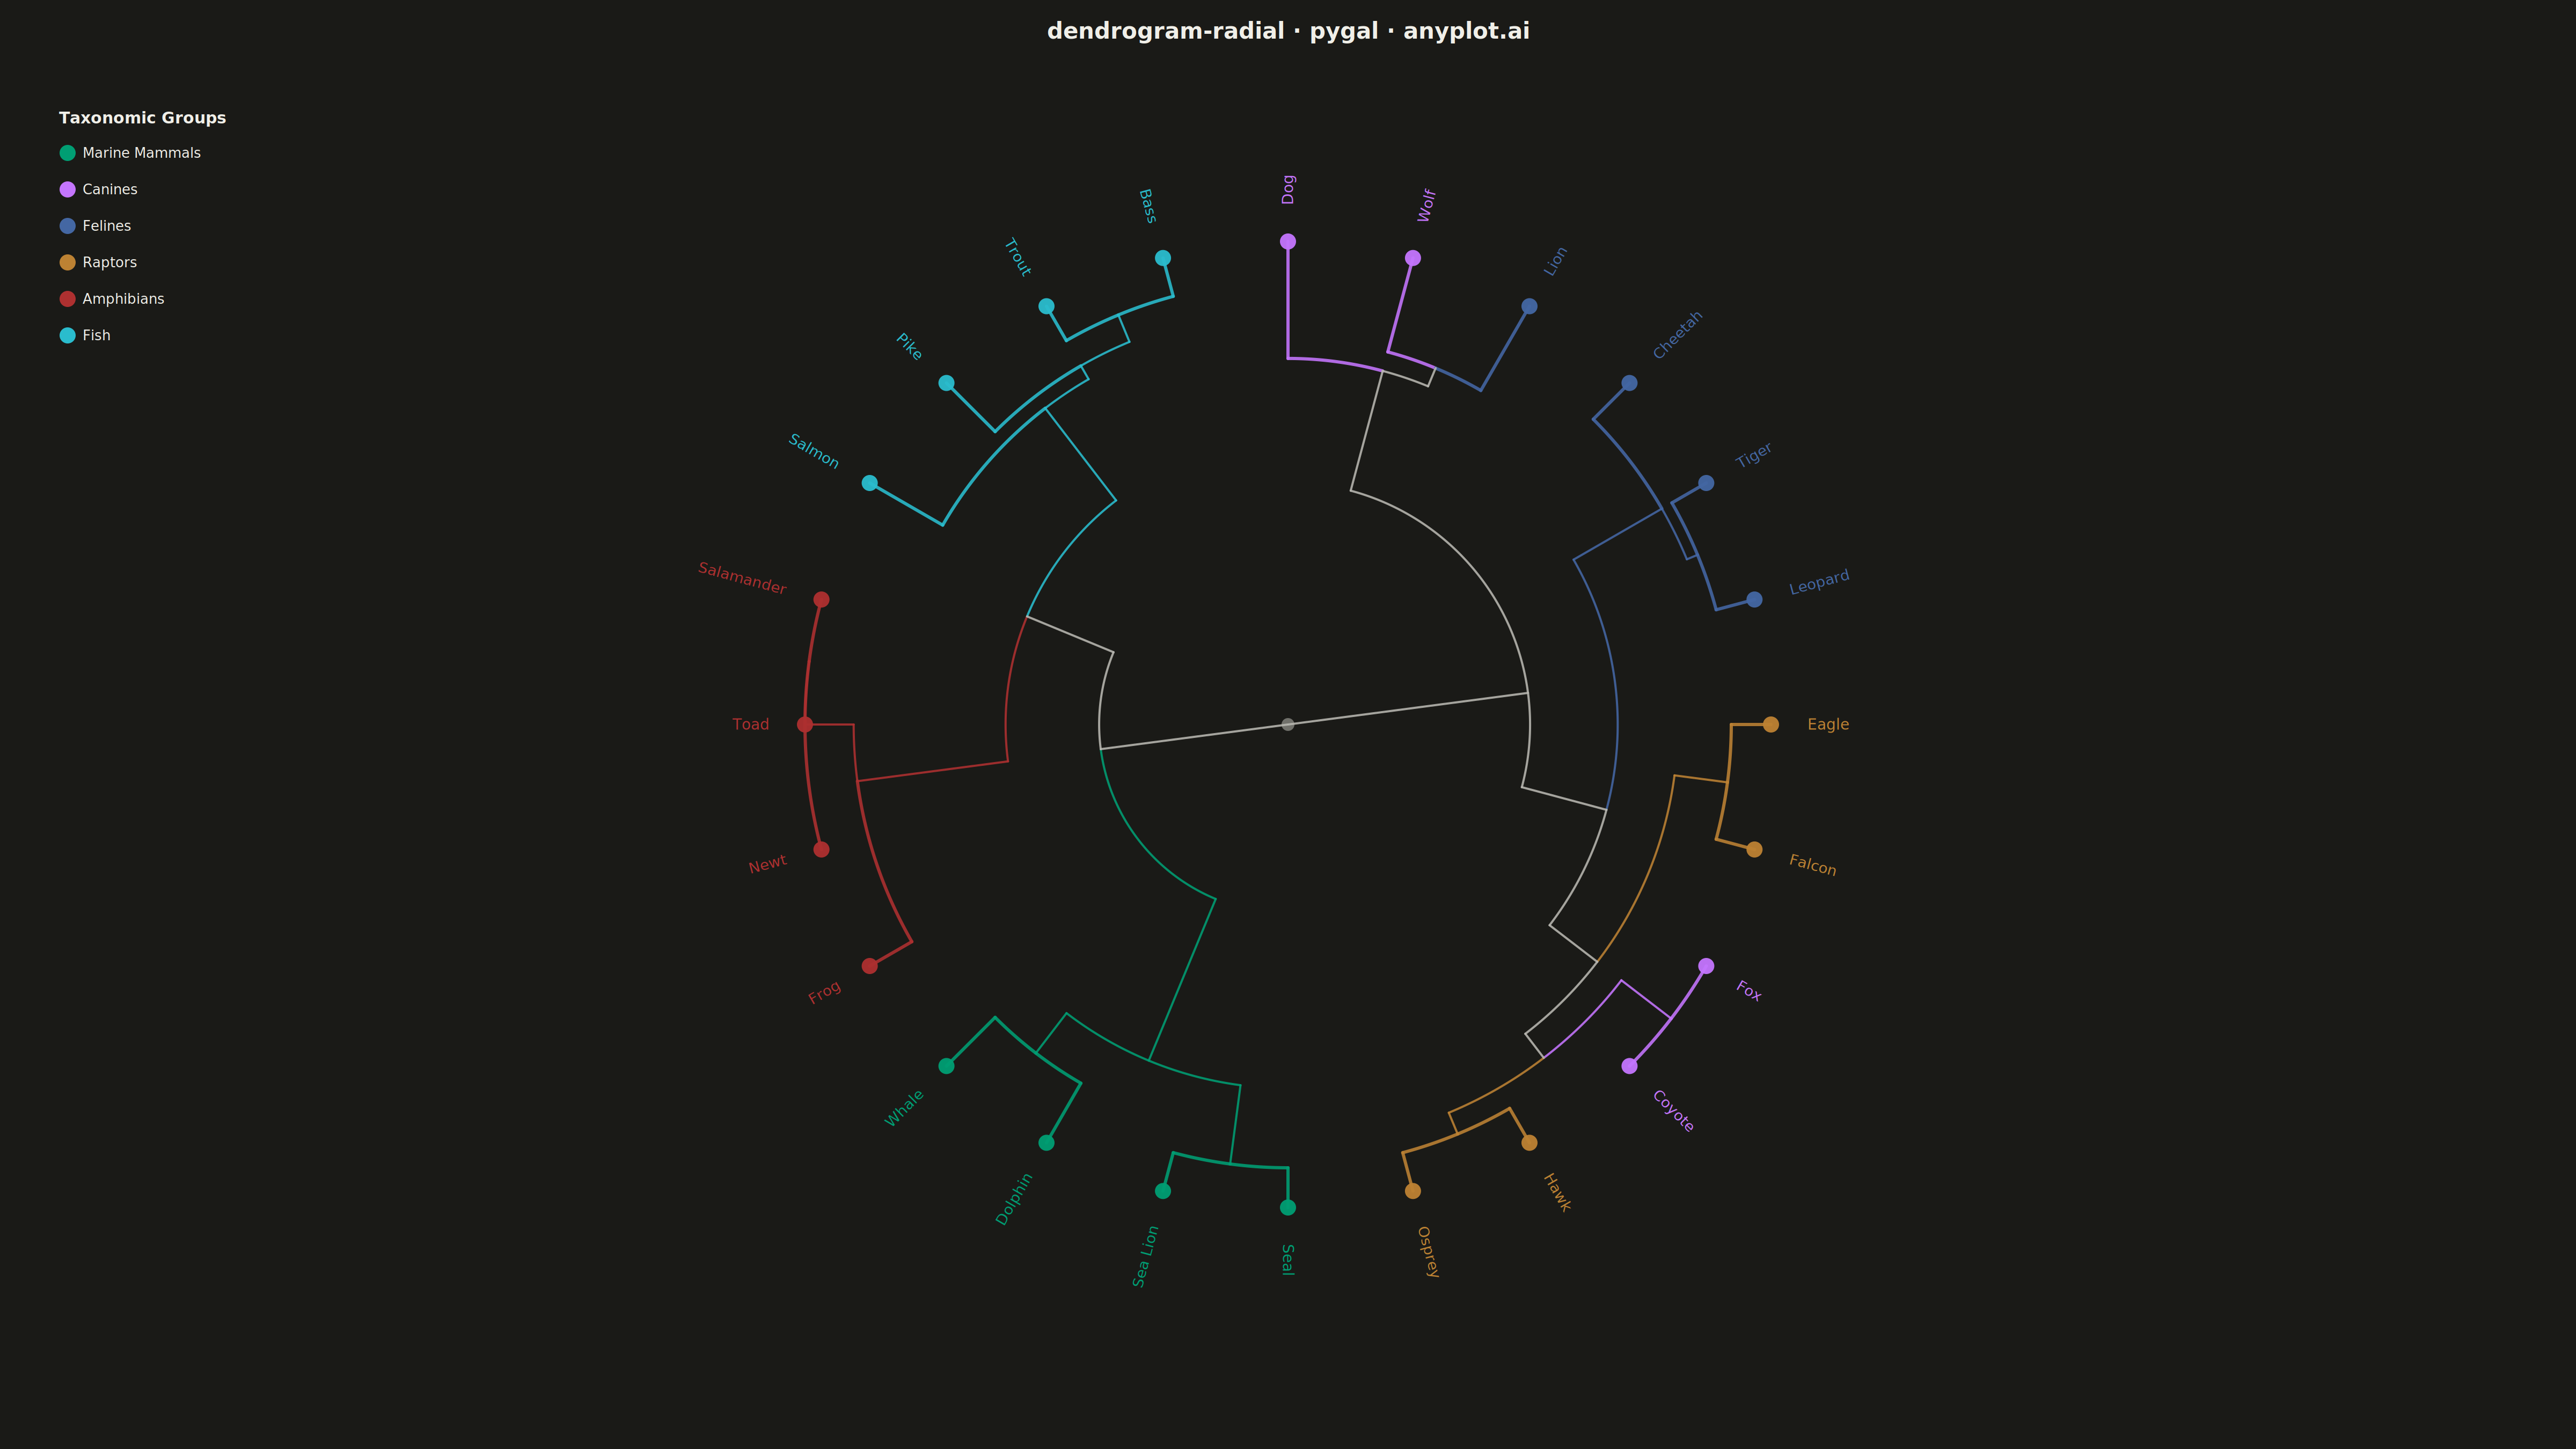
A radial dendrogram renders hierarchical clustering in a circular layout where the root node sits at the center and branches extend outward, with leaf nodes arranged around the circumference. This layout is a space-efficient alternative to linear dendrograms for large hierarchies, making it well-suited for datasets with hundreds of leaves. Branch lengths are proportional to distance or dissimilarity, preserving the quantitative interpretation of cluster merges.
""" anyplot.ai
dendrogram-radial: Radial Dendrogram
Library: pygal 3.1.0 | Python 3.13.13
Quality: 81/100 | Created: 2026-05-14
"""

import importlib
import math
import os
import sys

import cairosvg
import numpy as np
from scipy.cluster.hierarchy import leaves_list, linkage
from scipy.spatial.distance import pdist


# Remove current directory from sys.path so loading 'pygal' finds the installed
# package rather than this script (which is also named pygal.py), then use
# importlib to avoid E402 import-not-at-top violations for the two pygal lines.
_thisdir = os.path.dirname(os.path.abspath(__file__))
sys.path = [p for p in sys.path if p not in ("", _thisdir)]
pygal = importlib.import_module("pygal")
Style = importlib.import_module("pygal.style").Style


THEME = os.getenv("ANYPLOT_THEME", "light")
PAGE_BG = "#FAF8F1" if THEME == "light" else "#1A1A17"
INK = "#1A1A17" if THEME == "light" else "#F0EFE8"
INK_SOFT = "#4A4A44" if THEME == "light" else "#B8B7B0"
INK_MUTED = "#6B6A63" if THEME == "light" else "#A8A79F"

IMPRINT = ("#009E73", "#C475FD", "#4467A3", "#BD8233", "#AE3030", "#2ABCCD", "#954477")

custom_style = Style(
    background=PAGE_BG,
    plot_background=PAGE_BG,
    foreground=INK,
    foreground_strong=INK,
    foreground_subtle=INK_MUTED,
    colors=IMPRINT,
    title_font_size=42,
    legend_font_size=26,
    label_font_size=28,
)

# Data: 24 animal species clustered by ecological traits
np.random.seed(42)

species = [
    "Dolphin",
    "Whale",
    "Seal",
    "Sea Lion",
    "Wolf",
    "Fox",
    "Dog",
    "Coyote",
    "Lion",
    "Tiger",
    "Leopard",
    "Cheetah",
    "Eagle",
    "Hawk",
    "Falcon",
    "Osprey",
    "Frog",
    "Toad",
    "Salamander",
    "Newt",
    "Salmon",
    "Trout",
    "Bass",
    "Pike",
]
group_names = ["Marine Mammals", "Canines", "Felines", "Raptors", "Amphibians", "Fish"]
cluster_ids = [0] * 4 + [1] * 4 + [2] * 4 + [3] * 4 + [4] * 4 + [5] * 4

# Trait matrix: [body_size, aquatic_affinity, speed, sociality, carnivory]
traits = np.array(
    [
        [4, 5, 3, 4, 4],
        [5, 5, 2, 3, 4],
        [3, 4, 2, 2, 4],
        [3, 4, 2, 3, 4],
        [3, 1, 4, 5, 4],
        [2, 1, 4, 1, 4],
        [2, 1, 3, 3, 3],
        [2, 1, 4, 1, 4],
        [4, 1, 4, 3, 5],
        [4, 1, 4, 1, 5],
        [3, 1, 4, 1, 5],
        [3, 1, 5, 1, 5],
        [2, 2, 5, 1, 4],
        [2, 2, 4, 1, 4],
        [1, 2, 5, 1, 4],
        [2, 2, 3, 1, 4],
        [1, 3, 2, 1, 3],
        [1, 3, 1, 1, 3],
        [1, 3, 1, 1, 3],
        [1, 3, 1, 1, 3],
        [2, 5, 4, 1, 3],
        [2, 5, 3, 1, 3],
        [2, 5, 2, 1, 3],
        [2, 4, 2, 1, 4],
    ],
    dtype=float,
)

# Hierarchical clustering via Ward linkage
dist_matrix = pdist(traits, metric="euclidean")
Z = linkage(dist_matrix, method="ward")
n = len(species)

# Assign angles to leaves using dendrogram leaf ordering
leaf_order = leaves_list(Z)
leaf_angles = {leaf_order[i]: 2 * math.pi * i / n for i in range(n)}

# Radii: leaves at outer edge (1.0), internal nodes proportional to merge distance
max_dist = Z[-1][2]
node_radii = dict.fromkeys(range(n), 1.0)
for i, row in enumerate(Z):
    node_radii[n + i] = 1.0 - row[2] / max_dist

# Angular positions: midpoint of each subtree's angular span
node_min_ang = dict(leaf_angles)
node_max_ang = dict(leaf_angles)
node_angles = dict(leaf_angles)
for i, row in enumerate(Z):
    left, right = int(row[0]), int(row[1])
    nid = n + i
    node_min_ang[nid] = min(node_min_ang[left], node_min_ang[right])
    node_max_ang[nid] = max(node_max_ang[left], node_max_ang[right])
    node_angles[nid] = (node_min_ang[nid] + node_max_ang[nid]) / 2

# Propagate cluster labels: a node gets a color only if all its leaves share one cluster
node_cluster = {i: cluster_ids[i] for i in range(n)}
for i, row in enumerate(Z):
    left, right = int(row[0]), int(row[1])
    nid = n + i
    cl, cr = node_cluster.get(left, -1), node_cluster.get(right, -1)
    node_cluster[nid] = cl if cl == cr else -1

# Canvas setup
W, H = 4800, 2700
cx, cy = W // 2, H // 2
R = 900  # Dendrogram outer radius in pixels
LABEL_R = R + 68  # Label placement radius


def polar_xy(r, theta):
    return (cx + r * math.cos(theta - math.pi / 2), cy + r * math.sin(theta - math.pi / 2))


elems = []

# Draw dendrogram branches (arcs + radial lines)
for i, row in enumerate(Z):
    left, right = int(row[0]), int(row[1])
    nid = n + i
    par_r = node_radii[nid] * R
    par_theta = node_angles[nid]

    for child in (left, right):
        ch_r = node_radii[child] * R
        ch_theta = node_angles[child]
        cl = node_cluster.get(child, -1)
        color = IMPRINT[cl] if cl >= 0 else INK_SOFT
        sw = 6 if child < n else 4

        # Arc at par_r from par_theta to ch_theta
        if par_r > 1:
            x1, y1 = polar_xy(par_r, par_theta)
            x2, y2 = polar_xy(par_r, ch_theta)
            d_theta = ch_theta - par_theta
            while d_theta > math.pi:
                d_theta -= 2 * math.pi
            while d_theta < -math.pi:
                d_theta += 2 * math.pi
            sweep = 1 if d_theta > 0 else 0
            large = 1 if abs(d_theta) > math.pi else 0
            elems.append(
                f'<path d="M{x1:.1f},{y1:.1f} A{par_r:.1f},{par_r:.1f} 0 {large},{sweep} {x2:.1f},{y2:.1f}" '
                f'stroke="{color}" stroke-width="{sw}" fill="none" stroke-linecap="round" opacity="0.88"/>'
            )

        # Radial line from (par_r, ch_theta) to (ch_r, ch_theta)
        rx1, ry1 = polar_xy(max(par_r, 1), ch_theta)
        rx2, ry2 = polar_xy(ch_r, ch_theta)
        elems.append(
            f'<line x1="{rx1:.1f}" y1="{ry1:.1f}" x2="{rx2:.1f}" y2="{ry2:.1f}" '
            f'stroke="{color}" stroke-width="{sw}" stroke-linecap="round" opacity="0.88"/>'
        )

# Center root dot
elems.append(f'<circle cx="{cx}" cy="{cy}" r="12" fill="{INK_SOFT}" opacity="0.55"/>')

# Leaf dots and radially-oriented labels
for i in range(n):
    theta = leaf_angles[i]
    lx, ly = polar_xy(R, theta)
    color = IMPRINT[cluster_ids[i]]

    elems.append(f'<circle cx="{lx:.1f}" cy="{ly:.1f}" r="15" fill="{color}" opacity="0.95"/>')

    label_x, label_y = polar_xy(LABEL_R, theta)
    svg_angle = math.degrees(theta - math.pi / 2) % 360
    if svg_angle <= 90 or svg_angle >= 270:
        anchor, rot = "start", svg_angle
    else:
        anchor, rot = "end", svg_angle + 180

    elems.append(
        f'<text x="{label_x:.1f}" y="{label_y:.1f}" '
        f'transform="rotate({rot:.1f},{label_x:.1f},{label_y:.1f})" '
        f'text-anchor="{anchor}" dominant-baseline="middle" '
        f'font-family="sans-serif" font-size="28" fill="{color}" font-weight="500">'
        f"{species[i]}</text>"
    )

# Legend
lx0, ly0 = 110, 230
elems.append(
    f'<text x="{lx0}" y="{ly0}" font-family="sans-serif" font-size="30" '
    f'fill="{INK}" font-weight="600">Taxonomic Groups</text>'
)
for g in range(6):
    gy = ly0 + 55 + g * 68
    elems.append(f'<circle cx="{lx0 + 16}" cy="{gy}" r="15" fill="{IMPRINT[g]}"/>')
    elems.append(
        f'<text x="{lx0 + 44}" y="{gy}" font-family="sans-serif" font-size="26" '
        f'fill="{INK}" dominant-baseline="middle">{group_names[g]}</text>'
    )

# Title
elems.append(
    f'<text x="{W // 2}" y="72" text-anchor="middle" font-family="sans-serif" '
    f'font-size="42" fill="{INK}" font-weight="600">'
    f"dendrogram-radial · pygal · anyplot.ai</text>"
)

svg = (
    '<?xml version="1.0" encoding="utf-8"?>\n'
    f'<svg xmlns="http://www.w3.org/2000/svg" width="{W}" height="{H}">\n'
    f'  <rect width="{W}" height="{H}" fill="{PAGE_BG}"/>\n' + "\n".join(f"  {e}" for e in elems) + "\n</svg>\n"
)

# PNG via cairosvg (pygal's PNG rendering backend)
cairosvg.svg2png(bytestring=svg.encode(), write_to=f"plot-{THEME}.png")

# Interactive HTML via pygal's XY chart — leaf nodes plotted as interactive scatter
# with hover tooltips (species name + group); uses pygal's JS rendering pipeline
xy_chart = pygal.XY(
    style=custom_style,
    width=W,
    height=H,
    title="dendrogram-radial · pygal · anyplot.ai",
    show_x_labels=False,
    show_y_labels=False,
    dots_size=6,
)

for g in range(6):
    group_pts = []
    for i in range(n):
        if cluster_ids[i] == g:
            theta = leaf_angles[i]
            group_pts.append(
                {"value": (R * math.cos(theta - math.pi / 2), R * math.sin(theta - math.pi / 2)), "label": species[i]}
            )
    xy_chart.add(group_names[g], group_pts)

with open(f"plot-{THEME}.html", "wb") as f:
    f.write(xy_chart.render())
Runnable source as JSON, for any HTTP client: https://api.anyplot.ai/specs/dendrogram-radial/pygal/code. Any spec id and library id listed in llms-full.txt fit the same URL shape; every URL below is complete and callable.
{
  "spec_id": "dendrogram-radial",
  "language": "python",
  "library": "pygal",
  "page": "https://anyplot.ai/dendrogram-radial/python/pygal",
  "hub": "https://anyplot.ai/dendrogram-radial",
  "code_json": "https://api.anyplot.ai/specs/dendrogram-radial/pygal/code",
  "spec_json": "https://api.anyplot.ai/specs/dendrogram-radial",
  "render_light_png": "https://storage.googleapis.com/anyplot-images/plots/dendrogram-radial/python/pygal/plot-light.png",
  "render_dark_png": "https://storage.googleapis.com/anyplot-images/plots/dendrogram-radial/python/pygal/plot-dark.png",
  "interactive_light_html": "https://storage.googleapis.com/anyplot-images/plots/dendrogram-radial/python/pygal/plot-light.html",
  "interactive_dark_html": "https://storage.googleapis.com/anyplot-images/plots/dendrogram-radial/python/pygal/plot-dark.html",
  "quality_score": 81.0,
  "license": "MIT",
  "guide": "https://anyplot.ai/llms.txt"
}
Part of Radial Dendrogram on anyplot.ai.