The same plot in 14 other libraries — JavaScript: Chart.js, D3.js, Highcharts, MUI X Charts; Python: Altair, Bokeh, lets-plot, Matplotlib, Plotly, plotnine, Pygal, Seaborn; R: ggplot2; Julia: Makie.jl. Compare all 15 side by side: Radial Dendrogram in Python, R, Julia and JavaScript.
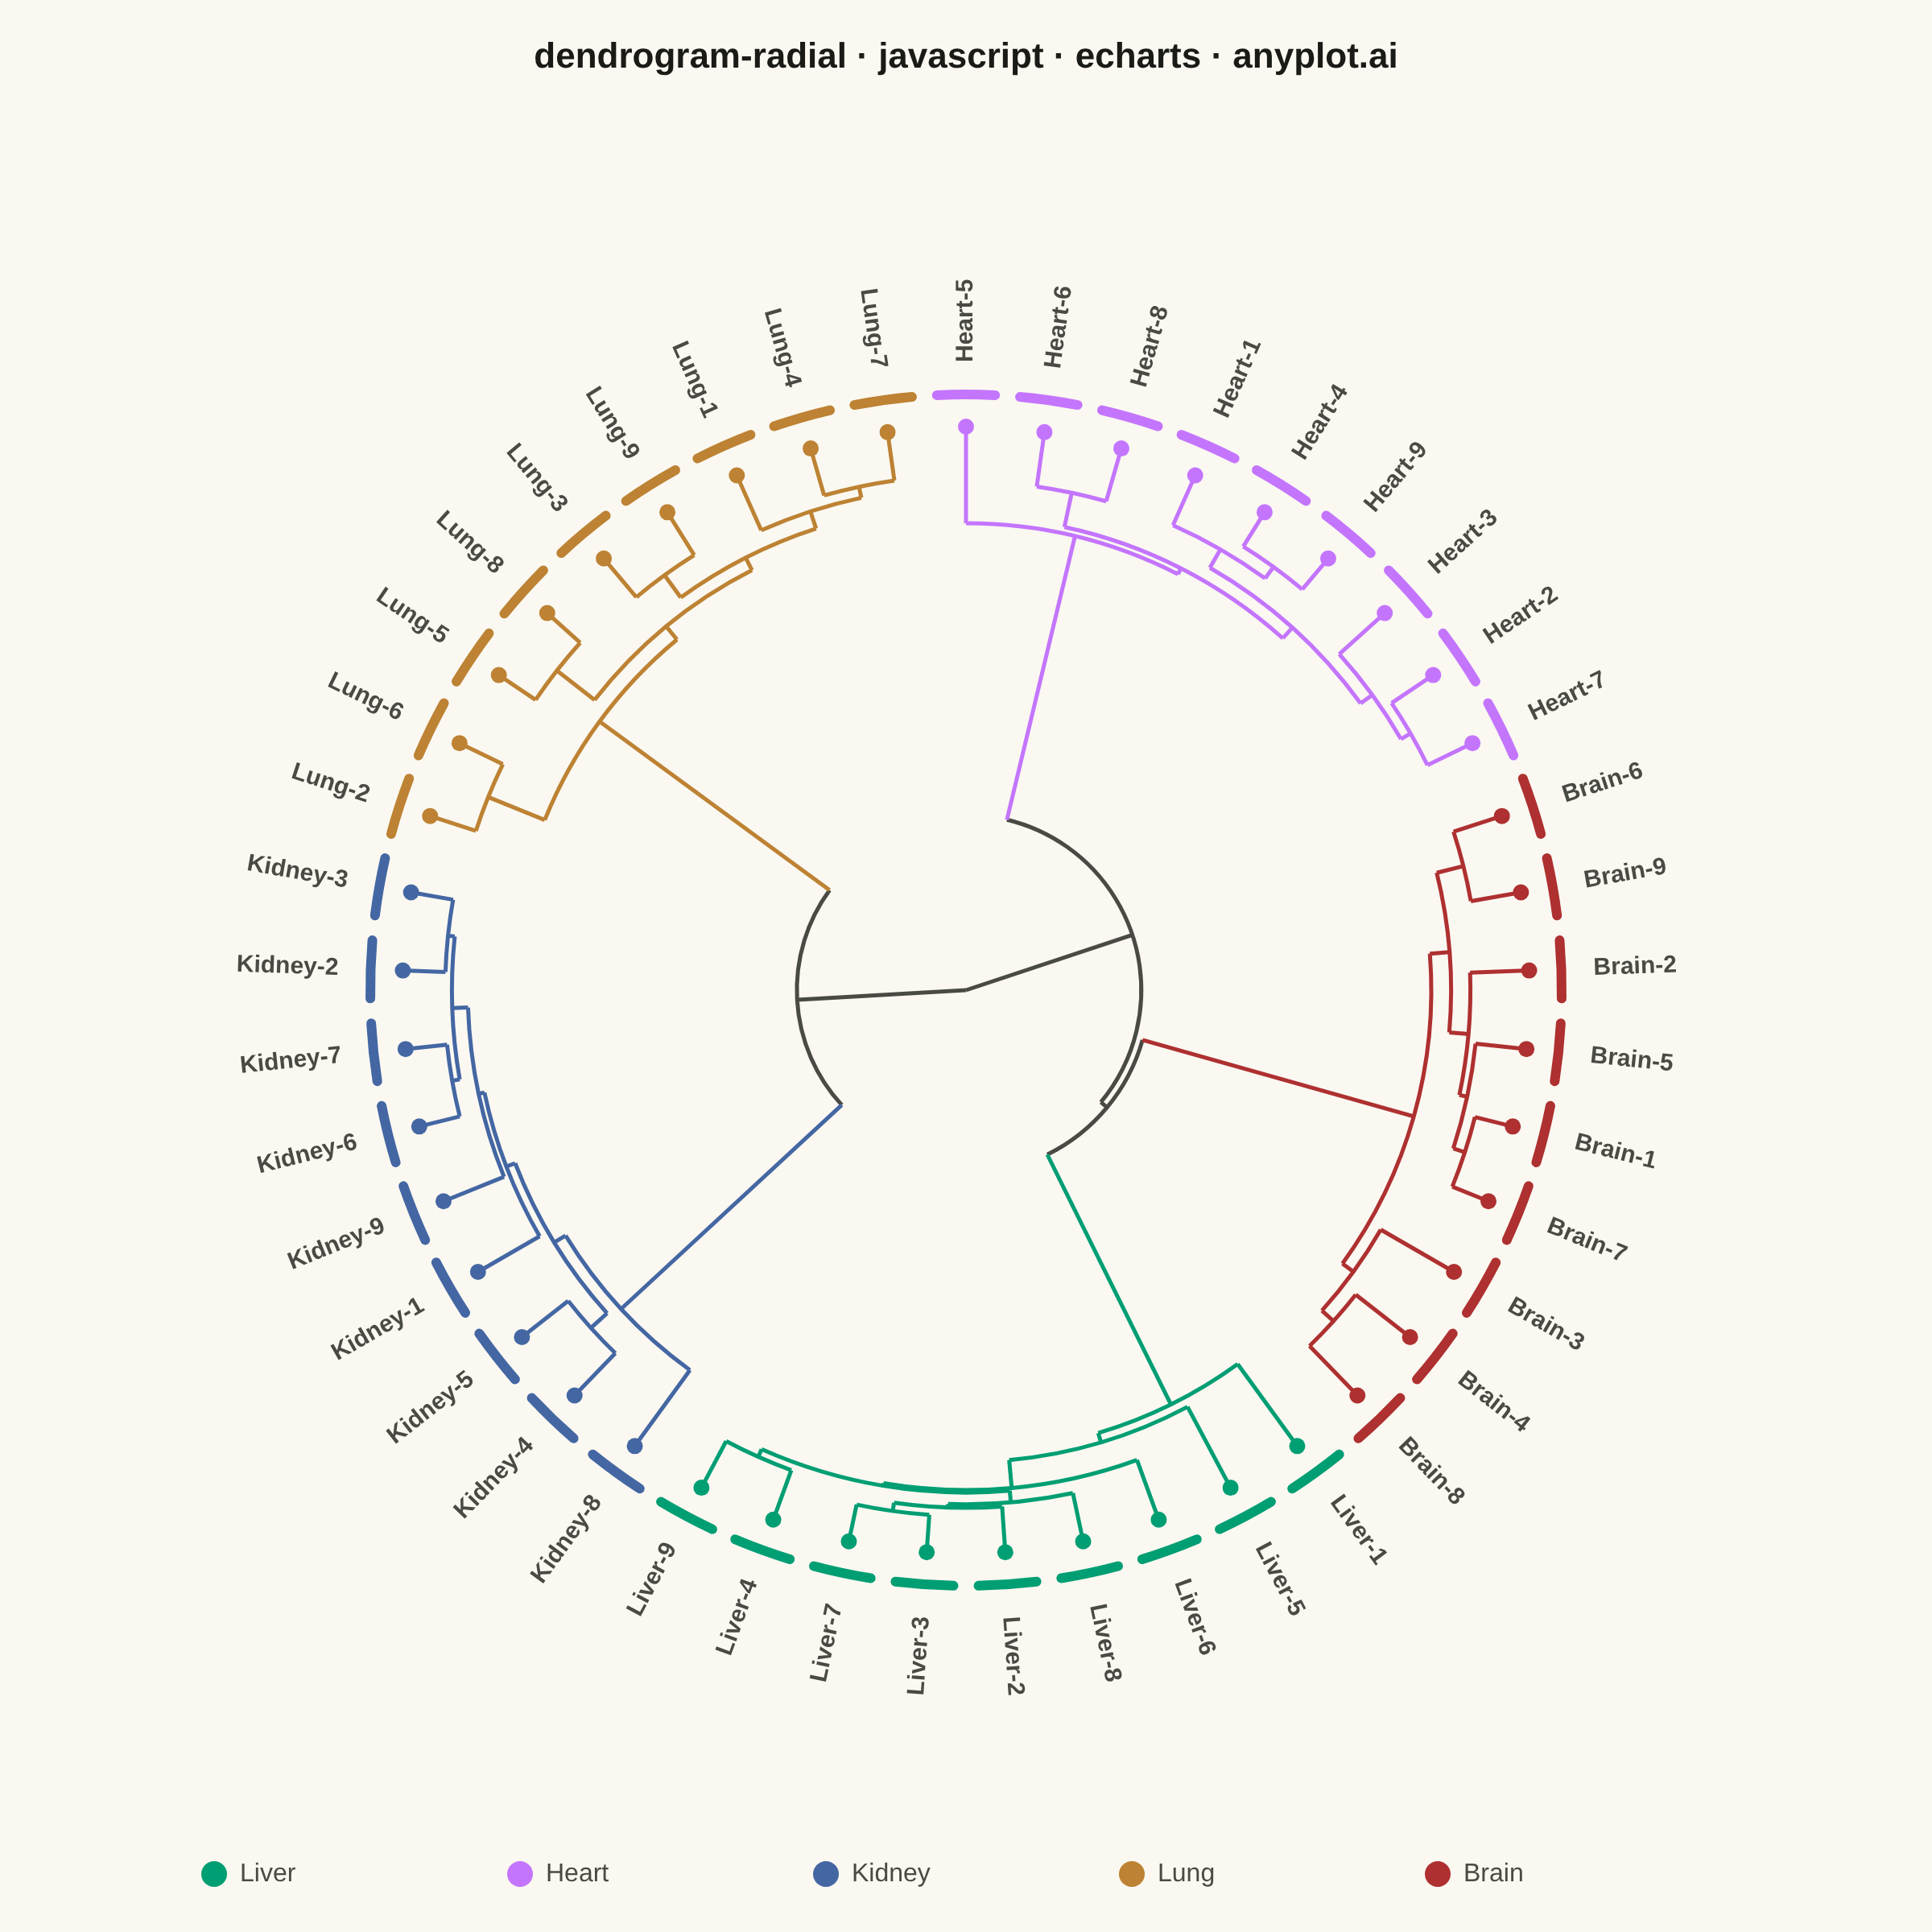
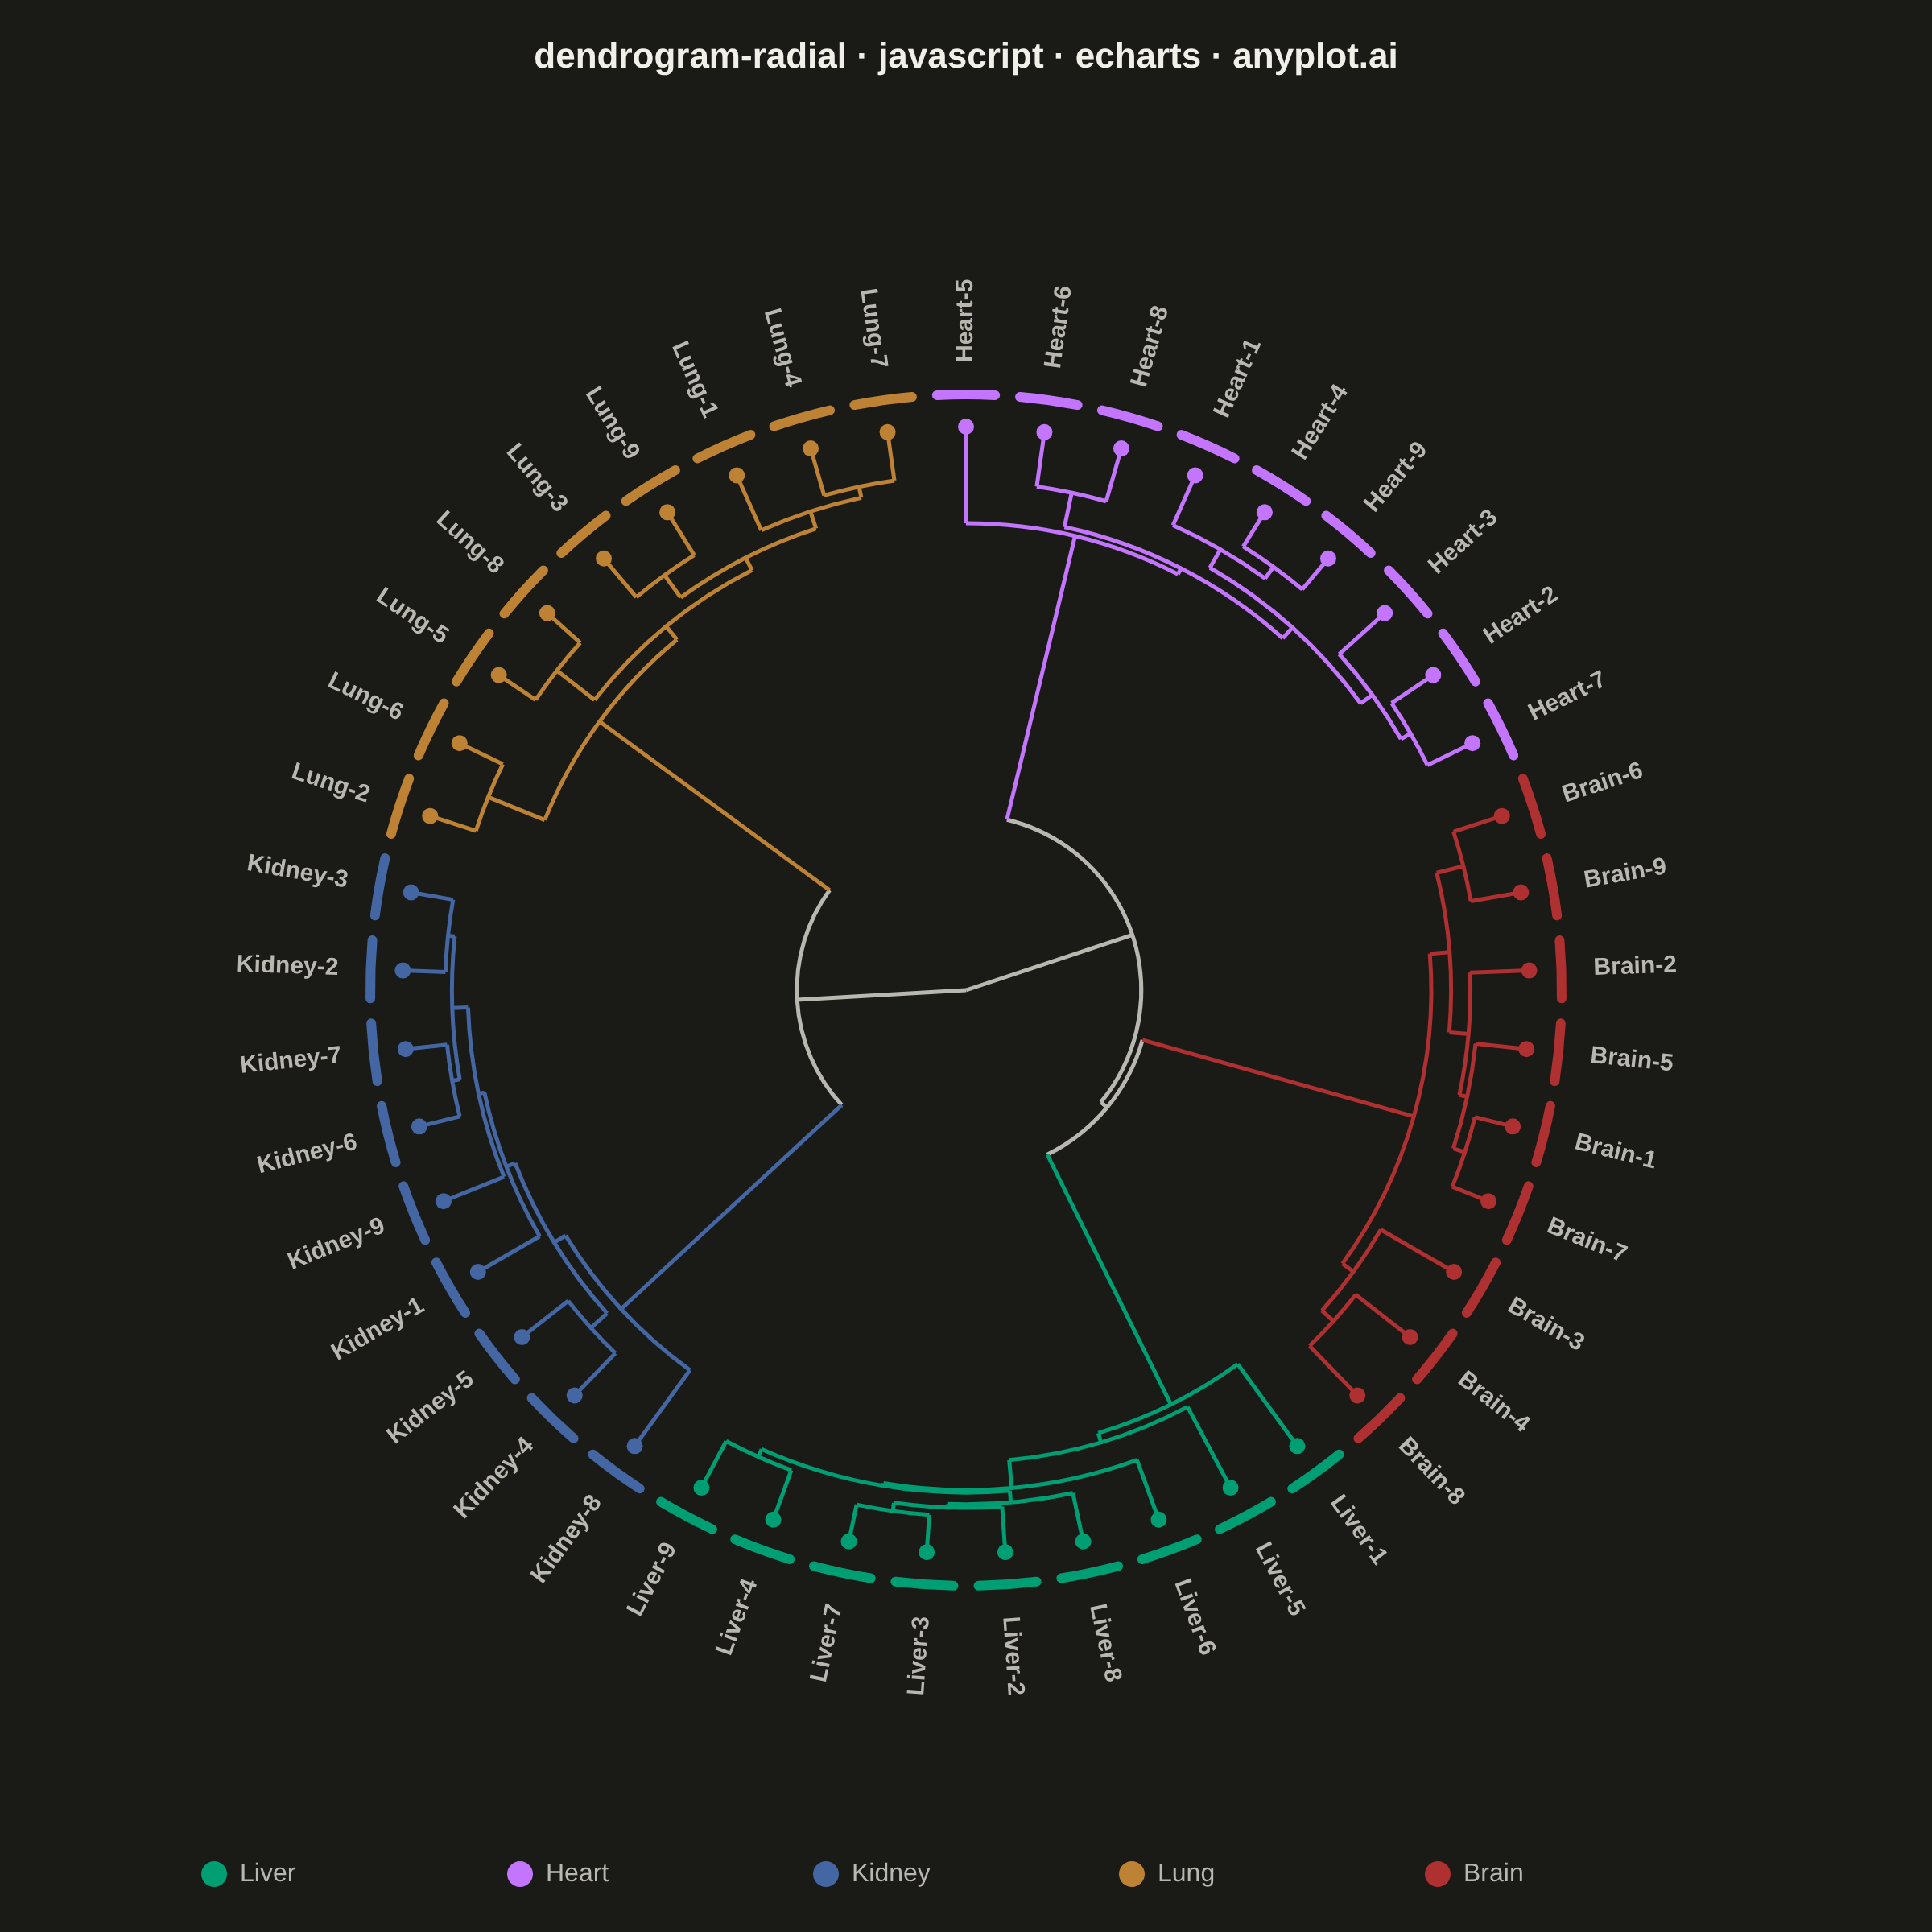
A radial dendrogram renders hierarchical clustering in a circular layout where the root node sits at the center and branches extend outward, with leaf nodes arranged around the circumference. This layout is a space-efficient alternative to linear dendrograms for large hierarchies, making it well-suited for datasets with hundreds of leaves. Branch lengths are proportional to distance or dissimilarity, preserving the quantitative interpretation of cluster merges.
// anyplot.ai
// dendrogram-radial: Radial Dendrogram
// Library: echarts 6.1.0 | JavaScript 22.23.2
// Quality: 89/100 | Created: 2026-09-05
//# anyplot-orientation: square

const t = window.ANYPLOT_TOKENS;
const size = window.ANYPLOT_SIZE;

// --- Data: synthetic gene-expression samples across 5 tissue types ---------
// A small Park-Miller LCG keeps the browser-side generation deterministic
// (there is no seeded Math.random in the DOM).
let seed = 20260905 % 2147483647;
if (seed <= 0) seed += 2147483646;
function rand() {
  seed = (seed * 16807) % 2147483647;
  return (seed - 1) / 2147483646;
}
function noise(scale) {
  return ((rand() + rand() + rand() - 1.5) / 1.5) * scale;
}

const TISSUES = ["Liver", "Heart", "Kidney", "Lung", "Brain"];
const SAMPLES_PER_TISSUE = 9;
const FEATURE_DIMS = 5;

const tissueCenters = TISSUES.map(() =>
  Array.from({ length: FEATURE_DIMS }, () => rand() * 20 - 10),
);

const leaves = [];
TISSUES.forEach((tissue, tissueIndex) => {
  for (let s = 1; s <= SAMPLES_PER_TISSUE; s++) {
    const features = tissueCenters[tissueIndex].map((c) => c + noise(3));
    leaves.push({ label: `${tissue}-${s}`, cluster: tissueIndex, features });
  }
});

function euclidean(a, b) {
  let sum = 0;
  for (let i = 0; i < a.length; i++) {
    const d = a[i] - b[i];
    sum += d * d;
  }
  return Math.sqrt(sum);
}

const n = leaves.length;
const dist = Array.from({ length: n }, () => new Array(n).fill(0));
for (let i = 0; i < n; i++) {
  for (let j = i + 1; j < n; j++) {
    const d = euclidean(leaves[i].features, leaves[j].features);
    dist[i][j] = d;
    dist[j][i] = d;
  }
}

// --- Average-linkage agglomerative clustering (scipy linkage equivalent) ---
function clusterDistance(a, b) {
  let sum = 0;
  for (const i of a) for (const j of b) sum += dist[i][j];
  return sum / (a.length * b.length);
}

let active = leaves.map((_, i) => ({
  members: [i],
  node: { leafIndex: i, height: 0 },
}));

while (active.length > 1) {
  let bestI = 0;
  let bestJ = 1;
  let bestD = Infinity;
  for (let i = 0; i < active.length; i++) {
    for (let j = i + 1; j < active.length; j++) {
      const d = clusterDistance(active[i].members, active[j].members);
      if (d < bestD) {
        bestD = d;
        bestI = i;
        bestJ = j;
      }
    }
  }
  const a = active[bestI];
  const b = active[bestJ];
  const merged = {
    members: a.members.concat(b.members),
    node: { left: a.node, right: b.node, height: bestD },
  };
  active = active.filter((_, idx) => idx !== bestI && idx !== bestJ);
  active.push(merged);
}
const root = active[0].node;

// --- Radial layout: leaf order preserves the merge tree (no crossing branches) --
function collectLeafOrder(node, order) {
  if (node.leafIndex !== undefined) {
    order.push(node.leafIndex);
    return;
  }
  collectLeafOrder(node.left, order);
  collectLeafOrder(node.right, order);
}
const leafOrder = [];
collectLeafOrder(root, leafOrder);

const angleStep = (2 * Math.PI) / leafOrder.length;
const leafAngle = {};
leafOrder.forEach((leafIndex, position) => {
  leafAngle[leafIndex] = position * angleStep - Math.PI / 2;
});

const cx = size.width / 2;
const cy = size.height / 2 + 15;
const maxRadius = Math.min(size.width, size.height) / 2 - 250;
const maxHeight = root.height;

// Root sits at radius 0 (center); leaves sit at maxRadius (circumference).
// Radial distance between a node and its parent is proportional to the
// merge-distance delta, matching a linear dendrogram's y-axis.
function layoutNode(node) {
  if (node.leafIndex !== undefined) {
    node.angle = leafAngle[node.leafIndex];
    node.radius = maxRadius;
    node.cluster = leaves[node.leafIndex].cluster;
    return;
  }
  layoutNode(node.left);
  layoutNode(node.right);
  node.angle = (node.left.angle + node.right.angle) / 2;
  node.radius = maxRadius * (1 - node.height / maxHeight);
  node.cluster = node.left.cluster === node.right.cluster ? node.left.cluster : -1;
}
layoutNode(root);

const internalNodes = [];
function collectInternal(node) {
  if (node.leafIndex !== undefined) return;
  internalNodes.push(node);
  collectInternal(node.left);
  collectInternal(node.right);
}
collectInternal(root);

const leafNodes = leaves.map((leaf, i) => ({
  angle: leafAngle[i],
  radius: maxRadius,
  cluster: leaf.cluster,
  label: leaf.label,
}));

function toXY(radius, angle) {
  return [cx + radius * Math.cos(angle), cy + radius * Math.sin(angle)];
}
function branchColor(clusterId) {
  return clusterId === -1 ? t.inkSoft : t.palette[clusterId];
}

// Each internal node draws an arc (the merge bar, at the parent's radius,
// spanning its two children's angles) plus two radial segments reaching out
// to each child — the polar equivalent of a linear dendrogram's elbow links.
function renderBranch(params) {
  const node = internalNodes[params.dataIndex];
  const leftAngle = node.left.angle;
  const rightAngle = node.right.angle;
  const [lx0, ly0] = toXY(node.radius, leftAngle);
  const [lx1, ly1] = toXY(node.left.radius, leftAngle);
  const [rx0, ry0] = toXY(node.radius, rightAngle);
  const [rx1, ry1] = toXY(node.right.radius, rightAngle);

  return {
    type: "group",
    children: [
      {
        type: "arc",
        shape: {
          cx,
          cy,
          r: node.radius,
          startAngle: Math.min(leftAngle, rightAngle),
          endAngle: Math.max(leftAngle, rightAngle),
          clockwise: true,
        },
        style: { stroke: branchColor(node.cluster), lineWidth: 2.5, fill: "none" },
      },
      {
        type: "line",
        shape: { x1: lx0, y1: ly0, x2: lx1, y2: ly1 },
        style: { stroke: branchColor(node.left.cluster), lineWidth: 2.5 },
      },
      {
        type: "line",
        shape: { x1: rx0, y1: ry0, x2: rx1, y2: ry1 },
        style: { stroke: branchColor(node.right.cluster), lineWidth: 2.5 },
      },
    ],
  };
}

// Leaf marker + a color-coded metadata-ring arc (one short arc band per leaf,
// at a fixed outer radius, split by a small angular gap from its neighbors)
// + a radially-aligned label, flipped upright on the left hemisphere.
const ringRadius = maxRadius + 20;
const ringHalfWidth = angleStep * 0.35;
function renderLeaf(params) {
  const leaf = leafNodes[params.dataIndex];
  const color = t.palette[leaf.cluster];
  const [dx, dy] = toXY(leaf.radius, leaf.angle);
  const [lx, ly] = toXY(ringRadius + 20, leaf.angle);

  const isLeftHalf = Math.cos(leaf.angle) < 0;
  const rotation = isLeftHalf ? -(leaf.angle + Math.PI) : -leaf.angle;

  return {
    type: "group",
    children: [
      { type: "circle", shape: { cx: dx, cy: dy, r: 5 }, style: { fill: color } },
      {
        type: "arc",
        shape: {
          cx,
          cy,
          r: ringRadius,
          startAngle: leaf.angle - ringHalfWidth,
          endAngle: leaf.angle + ringHalfWidth,
          clockwise: true,
        },
        style: { stroke: color, lineWidth: 6, fill: "none", lineCap: "round" },
      },
      {
        type: "text",
        x: lx,
        y: ly,
        rotation,
        style: {
          text: leaf.label,
          fill: t.inkSoft,
          fontSize: 15,
          fontWeight: 600,
          align: isLeftHalf ? "right" : "left",
          verticalAlign: "middle",
        },
      },
    ],
  };
}

const legendItemWidth = 190;
const legendY = size.height - 44;
const legendStartX = cx - (TISSUES.length * legendItemWidth) / 2;
const legend = TISSUES.map((tissue, i) => ({
  type: "group",
  left: legendStartX + i * legendItemWidth,
  top: legendY,
  children: [
    { type: "circle", shape: { cx: 8, cy: 8, r: 8 }, style: { fill: t.palette[i] } },
    {
      type: "text",
      x: 24,
      y: 8,
      style: { text: tissue, fill: t.inkSoft, fontSize: 16, verticalAlign: "middle" },
    },
  ],
}));

// --- Init + option ------------------------------------------------------
const chart = echarts.init(document.getElementById("container"));

chart.setOption({
  animation: false,
  color: t.palette,
  backgroundColor: "transparent",
  title: {
    text: "dendrogram-radial · javascript · echarts · anyplot.ai",
    left: "center",
    top: 20,
    textStyle: { color: t.ink, fontSize: 22 },
  },
  graphic: legend,
  series: [
    {
      type: "custom",
      coordinateSystem: "none",
      renderItem: renderBranch,
      data: internalNodes.map((_, i) => i),
      silent: true,
    },
    {
      type: "custom",
      coordinateSystem: "none",
      renderItem: renderLeaf,
      data: leafNodes.map((_, i) => i),
      silent: true,
    },
  ],
});
Runnable source as JSON, for any HTTP client: https://api.anyplot.ai/specs/dendrogram-radial/echarts/code. Any spec id and library id listed in llms-full.txt fit the same URL shape; every URL below is complete and callable.
{
  "spec_id": "dendrogram-radial",
  "language": "javascript",
  "library": "echarts",
  "page": "https://anyplot.ai/dendrogram-radial/javascript/echarts",
  "hub": "https://anyplot.ai/dendrogram-radial",
  "code_json": "https://api.anyplot.ai/specs/dendrogram-radial/echarts/code",
  "spec_json": "https://api.anyplot.ai/specs/dendrogram-radial",
  "render_light_png": "https://storage.googleapis.com/anyplot-images/plots/dendrogram-radial/javascript/echarts/plot-light.png",
  "render_dark_png": "https://storage.googleapis.com/anyplot-images/plots/dendrogram-radial/javascript/echarts/plot-dark.png",
  "interactive_light_html": "https://storage.googleapis.com/anyplot-images/plots/dendrogram-radial/javascript/echarts/plot-light.html",
  "interactive_dark_html": "https://storage.googleapis.com/anyplot-images/plots/dendrogram-radial/javascript/echarts/plot-dark.html",
  "quality_score": 89.0,
  "license": "MIT",
  "guide": "https://anyplot.ai/llms.txt"
}
Part of Radial Dendrogram on anyplot.ai.