The same plot in 14 other libraries — Python: Altair, Bokeh, lets-plot, Matplotlib, Plotly, plotnine, Pygal, Seaborn; Julia: Makie.jl; JavaScript: Chart.js, D3.js, Apache ECharts, Highcharts, MUI X Charts. Compare all 15 side by side: Radial Dendrogram in Python, R, Julia and JavaScript.
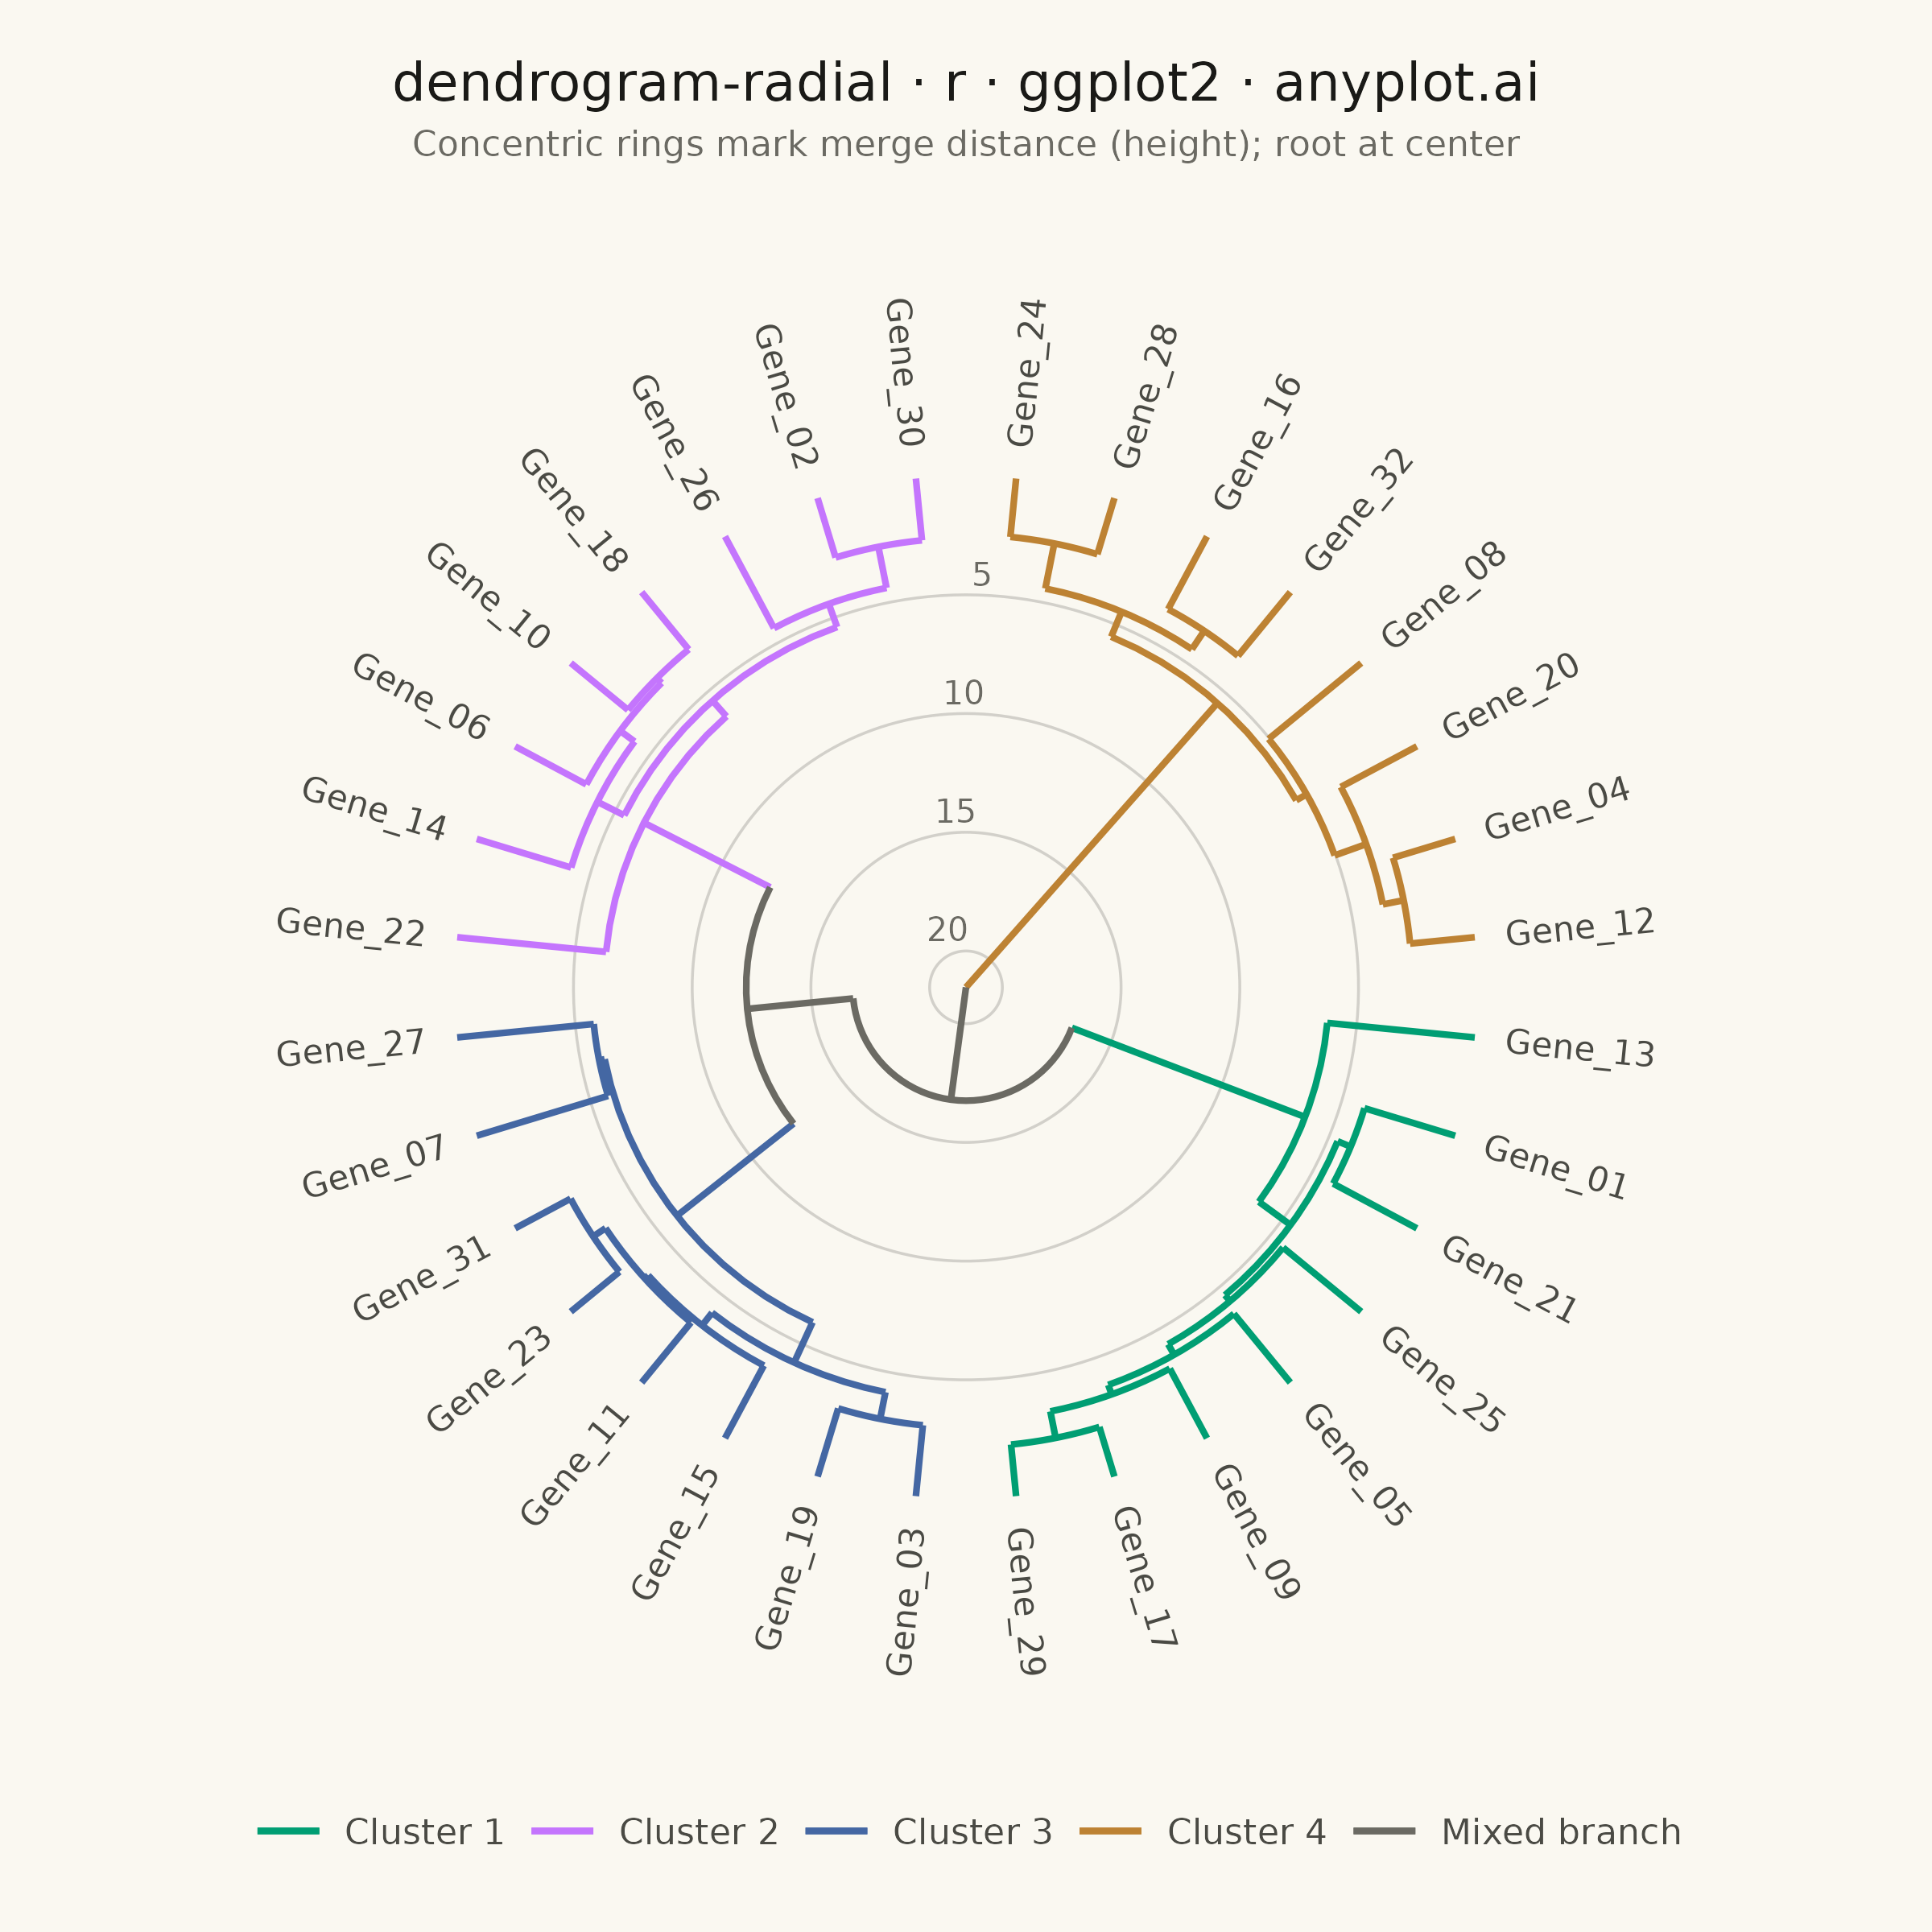
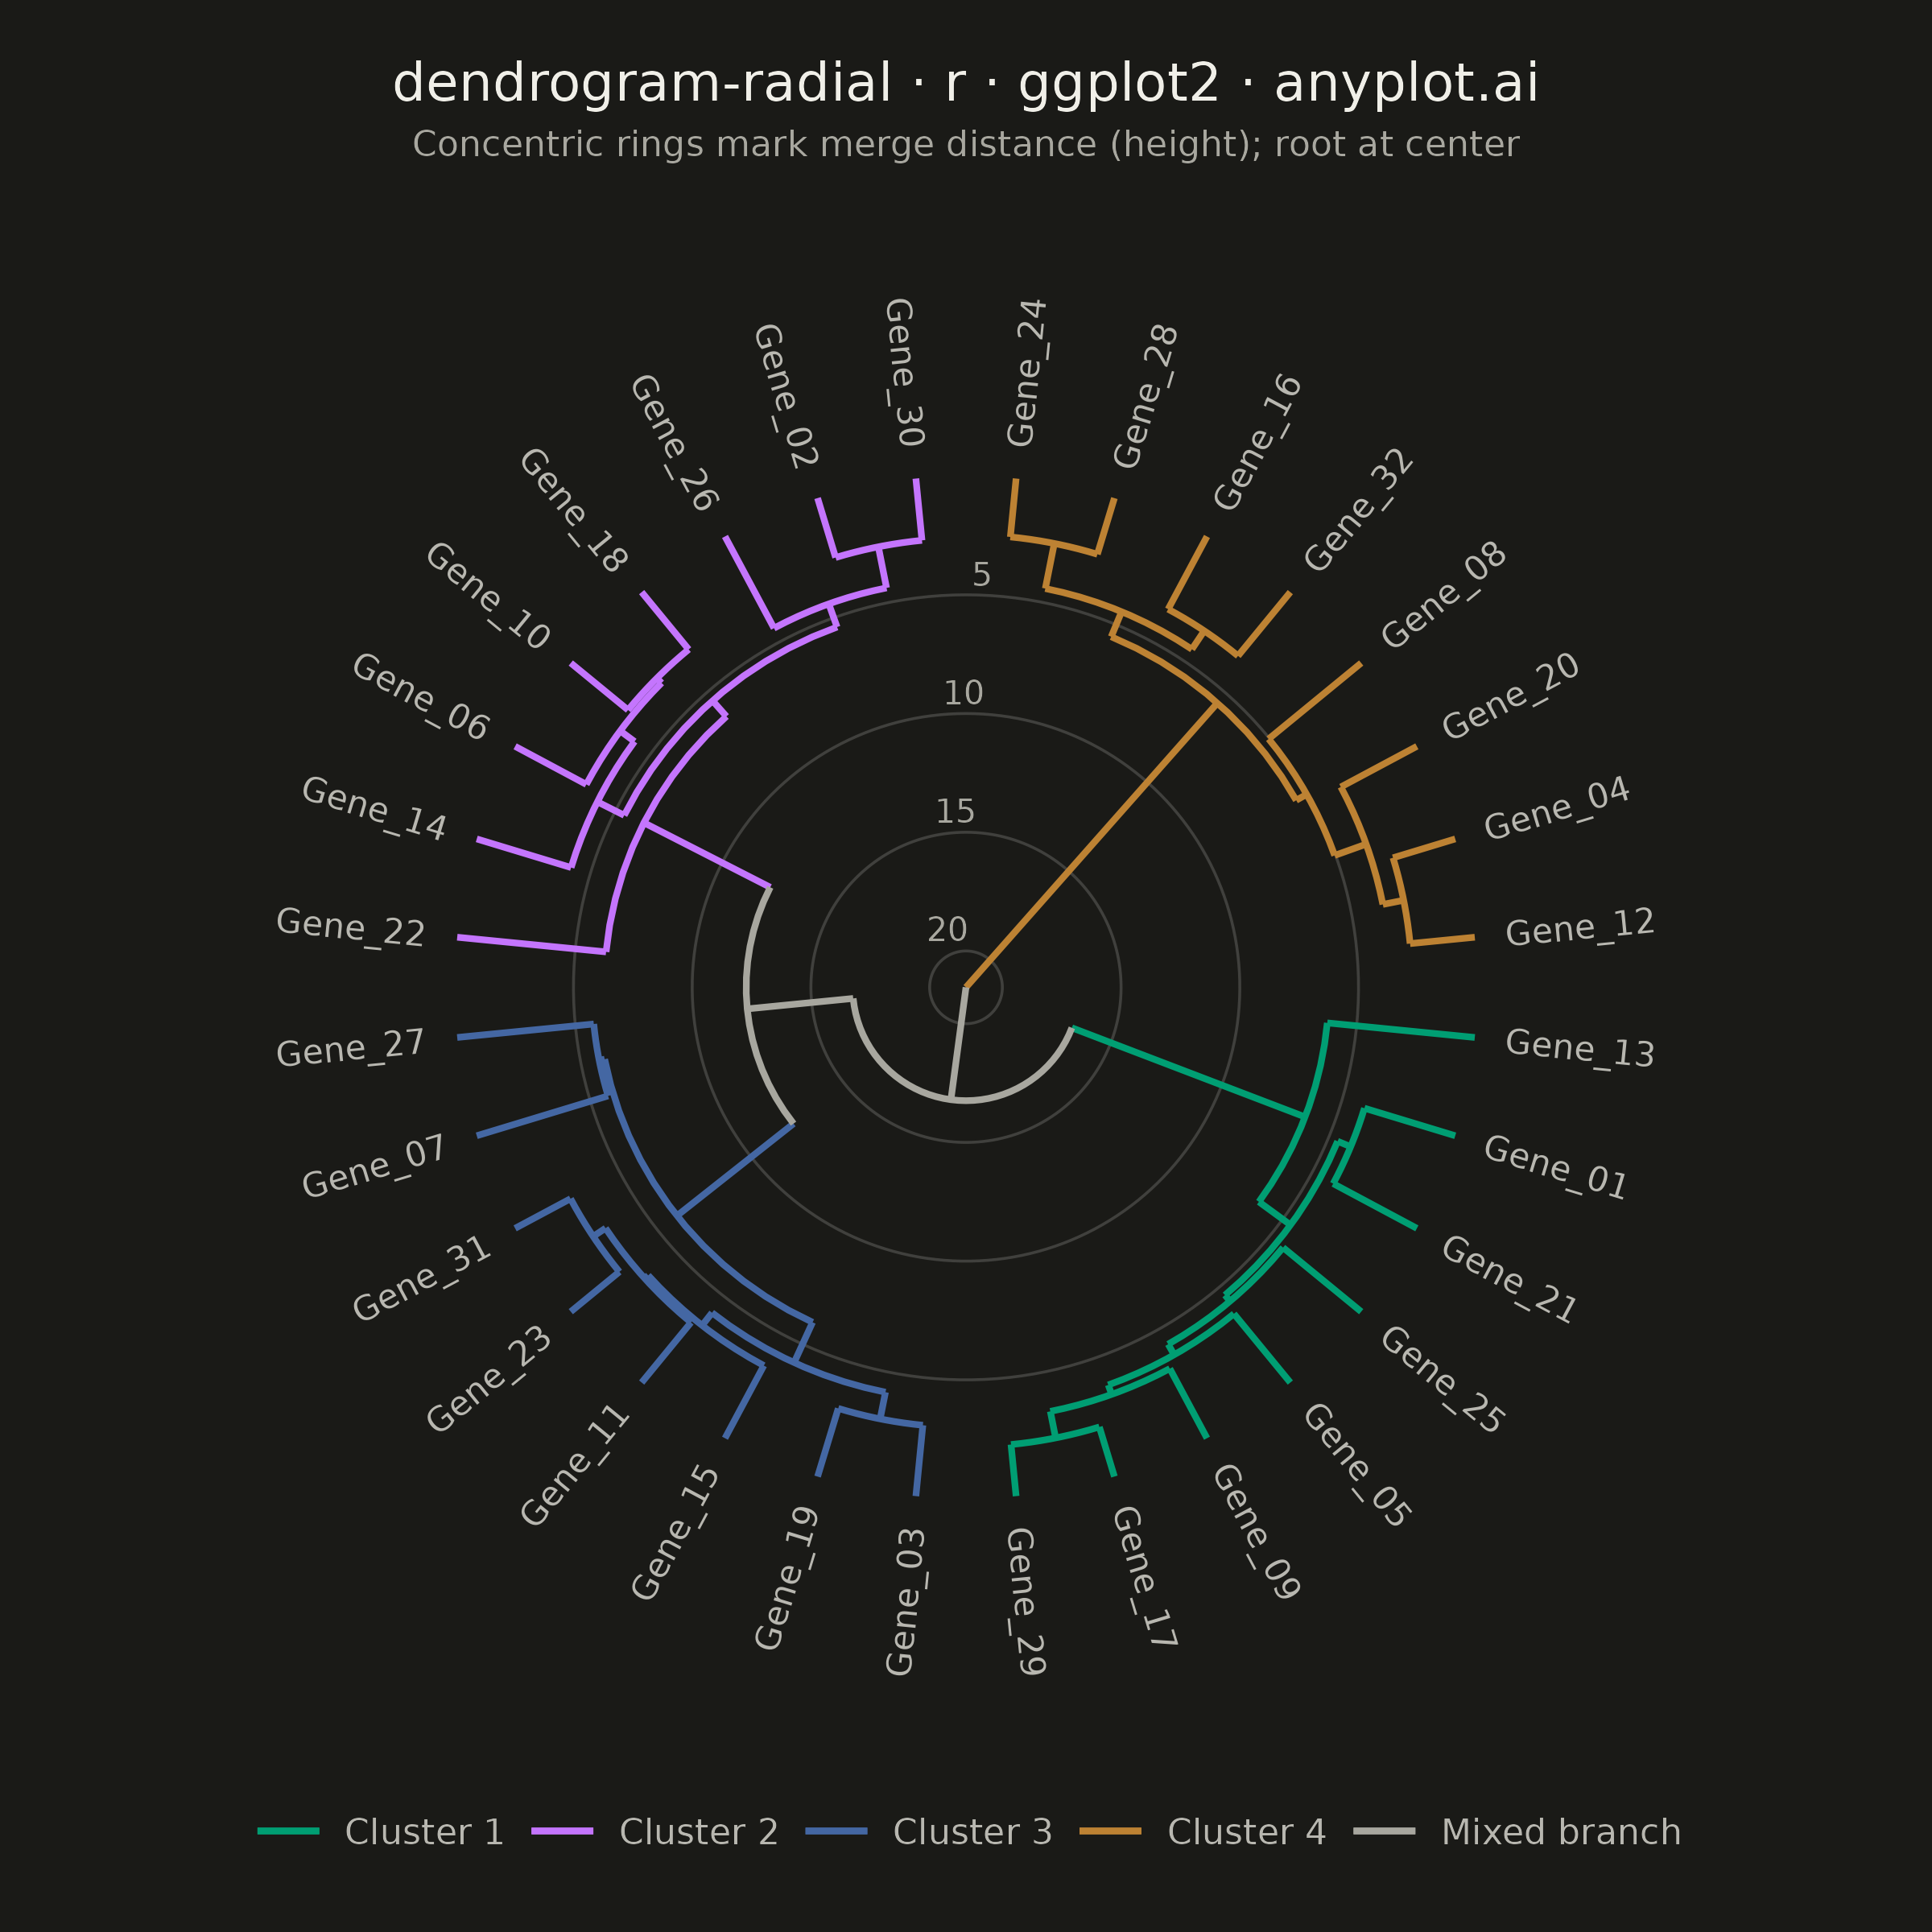
A radial dendrogram renders hierarchical clustering in a circular layout where the root node sits at the center and branches extend outward, with leaf nodes arranged around the circumference. This layout is a space-efficient alternative to linear dendrograms for large hierarchies, making it well-suited for datasets with hundreds of leaves. Branch lengths are proportional to distance or dissimilarity, preserving the quantitative interpretation of cluster merges.
#' anyplot.ai
#' dendrogram-radial: Radial Dendrogram
#' Library: ggplot2 3.5.1 | R 4.4.1
#' Quality: 89/100 | Created: 2026-09-05

library(ggplot2)
library(dplyr)
library(tidyr)
library(tibble)
library(ragg)

set.seed(42)

# --- Theme tokens ------------------------------------------------------------
THEME     <- Sys.getenv("ANYPLOT_THEME", "light")
PAGE_BG   <- if (THEME == "light") "#FAF8F1" else "#1A1A17"
INK       <- if (THEME == "light") "#1A1A17" else "#F0EFE8"
INK_SOFT  <- if (THEME == "light") "#4A4A44" else "#B8B7B0"
INK_MUTED <- if (THEME == "light") "#6B6A63" else "#A8A79F"

# Imprint palette (see prompts/default-style-guide.md "Categorical Palette")
IMPRINT_PALETTE <- c(
  "#009E73", "#C475FD", "#4467A3", "#BD8233",
  "#AE3030", "#2ABCCD", "#954477", "#99B314"
)

# --- Data: synthetic gene expression profiles across 4 latent groups --------
n_genes   <- 32
n_samples <- 8
n_groups  <- 4

group_id     <- rep(1:n_groups, length.out = n_genes)
group_means  <- matrix(rnorm(n_groups * n_samples, mean = 0, sd = 4), nrow = n_groups)
expr <- group_means[group_id, ] + matrix(rnorm(n_genes * n_samples, mean = 0, sd = 1.3), nrow = n_genes)
rownames(expr) <- sprintf("Gene_%02d", seq_len(n_genes))

hc           <- hclust(dist(expr), method = "average")
leaf_cluster <- cutree(hc, k = n_groups)
n            <- n_genes
max_height   <- max(hc$height)

# --- Walk the merge tree: assign circumferential position + branch purity ---
leaf_pos <- match(seq_len(n), hc$order)

node_x       <- numeric(n - 1)
node_cluster <- rep(NA_integer_, n - 1)

get_x       <- function(idx) if (idx < 0) leaf_pos[-idx] else node_x[idx]
get_height  <- function(idx) if (idx < 0) 0 else hc$height[idx]
get_cluster <- function(idx) if (idx < 0) leaf_cluster[[-idx]] else node_cluster[idx]

radial_rows <- vector("list", 2 * (n - 1))
arc_rows    <- vector("list", n - 1)

for (k in seq_len(n - 1)) {
  left  <- hc$merge[k, 1]
  right <- hc$merge[k, 2]

  x_left  <- get_x(left)
  x_right <- get_x(right)
  node_x[k] <- (x_left + x_right) / 2

  h_left  <- get_height(left)
  h_right <- get_height(right)
  h_here  <- hc$height[k]

  c_left  <- get_cluster(left)
  c_right <- get_cluster(right)
  node_cluster[k] <- if (!is.na(c_left) && !is.na(c_right) && c_left == c_right) c_left else NA_integer_

  radial_rows[[2 * k - 1]] <- tibble(
    x = x_left, r_start = max_height - h_left, r_end = max_height - h_here, cluster = c_left
  )
  radial_rows[[2 * k]] <- tibble(
    x = x_right, r_start = max_height - h_right, r_end = max_height - h_here, cluster = c_right
  )

  n_pts  <- max(10, round(abs(x_right - x_left) * 3))
  arc_rows[[k]] <- tibble(
    x = seq(x_left, x_right, length.out = n_pts), r = max_height - h_here,
    cluster = node_cluster[k], seg = k
  )
}

label_with_cluster <- function(df) mutate(df, cluster_label = ifelse(is.na(cluster), "mixed", as.character(cluster)))

radial_df <- label_with_cluster(bind_rows(radial_rows))
arc_df    <- label_with_cluster(bind_rows(arc_rows))

# --- Leaf labels, rotated tangentially around the circumference -------------
leaf_labels <- tibble(x = leaf_pos, label = rownames(expr)) %>%
  mutate(
    r     = max_height * 1.06,
    angle = 90 - 360 * (x - 0.5) / n,
    hjust = ifelse(angle < -90, 1, 0),
    angle = ifelse(angle < -90, angle + 180, angle)
  )

# --- Concentric distance-scale rings (quantitative reading of merge height) --
ring_heights <- pretty(c(0, max_height), n = 4)
ring_heights <- ring_heights[ring_heights > 0 & ring_heights < max_height]

ring_df <- crossing(h = ring_heights, x = seq(0.5, n + 0.5, length.out = 200)) %>%
  mutate(r = max_height - h)

ring_labels <- tibble(h = ring_heights) %>%
  mutate(x = 0.85, r = max_height - h, label = sprintf("%.0f", h))

# --- Colors -------------------------------------------------------------------
cluster_levels <- c(as.character(seq_len(n_groups)), "mixed")
CLUSTER_COLORS <- setNames(c(IMPRINT_PALETTE[seq_len(n_groups)], INK_MUTED), cluster_levels)
CLUSTER_LABELS <- setNames(c(sprintf("Cluster %d", seq_len(n_groups)), "Mixed branch"), cluster_levels)

# --- Plot ---------------------------------------------------------------------
p <- ggplot() +
  geom_path(
    data = ring_df, aes(x = x, y = r, group = h),
    color = INK, alpha = 0.18, linewidth = 0.3
  ) +
  geom_text(
    data = ring_labels, aes(x = x, y = r, label = label),
    color = INK_MUTED, size = 2.6, hjust = 1, vjust = -0.4
  ) +
  geom_segment(
    data = radial_df,
    aes(x = x, xend = x, y = r_start, yend = r_end, color = cluster_label),
    linewidth = 0.7
  ) +
  geom_path(
    data = arc_df,
    aes(x = x, y = r, group = seg, color = cluster_label),
    linewidth = 0.7
  ) +
  geom_text(
    data = leaf_labels,
    aes(x = x, y = r, label = label, angle = angle, hjust = hjust),
    color = INK_SOFT, size = 2.7
  ) +
  scale_color_manual(values = CLUSTER_COLORS, labels = CLUSTER_LABELS, name = NULL) +
  scale_x_continuous(limits = c(0.5, n + 0.5), expand = c(0, 0)) +
  scale_y_continuous(limits = c(0, max_height * 1.22), expand = c(0, 0)) +
  coord_polar(theta = "x", start = 0) +
  labs(
    title    = "dendrogram-radial · r · ggplot2 · anyplot.ai",
    subtitle = "Concentric rings mark merge distance (height); root at center"
  ) +
  theme_void(base_size = 8) +
  theme(
    plot.background  = element_rect(fill = PAGE_BG, color = PAGE_BG),
    panel.background = element_rect(fill = PAGE_BG, color = NA),
    plot.title       = element_text(color = INK, size = 12, hjust = 0.5, margin = margin(b = 4)),
    plot.subtitle    = element_text(color = INK_MUTED, size = 8, hjust = 0.5, margin = margin(b = 10)),
    legend.position  = "bottom",
    legend.text      = element_text(color = INK_SOFT, size = 8),
    plot.margin      = margin(14, 14, 14, 14)
  )

# --- Save -----------------------------------------------------------------
ggsave(
  filename = sprintf("plot-%s.png", THEME),
  plot     = p,
  device   = ragg::agg_png,
  width    = 6,
  height   = 6,
  units    = "in",
  dpi      = 400
)
Runnable source as JSON, for any HTTP client: https://api.anyplot.ai/specs/dendrogram-radial/ggplot2/code. Any spec id and library id listed in llms-full.txt fit the same URL shape; every URL below is complete and callable.
{
  "spec_id": "dendrogram-radial",
  "language": "r",
  "library": "ggplot2",
  "page": "https://anyplot.ai/dendrogram-radial/r/ggplot2",
  "hub": "https://anyplot.ai/dendrogram-radial",
  "code_json": "https://api.anyplot.ai/specs/dendrogram-radial/ggplot2/code",
  "spec_json": "https://api.anyplot.ai/specs/dendrogram-radial",
  "render_light_png": "https://storage.googleapis.com/anyplot-images/plots/dendrogram-radial/r/ggplot2/plot-light.png",
  "render_dark_png": "https://storage.googleapis.com/anyplot-images/plots/dendrogram-radial/r/ggplot2/plot-dark.png",
  "quality_score": 89.0,
  "license": "MIT",
  "guide": "https://anyplot.ai/llms.txt"
}
Part of Radial Dendrogram on anyplot.ai.