The same plot in 14 other libraries — Python: Bokeh, lets-plot, Matplotlib, Plotly, plotnine, Pygal, Seaborn; R: ggplot2; Julia: Makie.jl; JavaScript: Chart.js, D3.js, Apache ECharts, Highcharts, MUI X Charts. Compare all 15 side by side: Radial Dendrogram in Python, R, Julia and JavaScript.
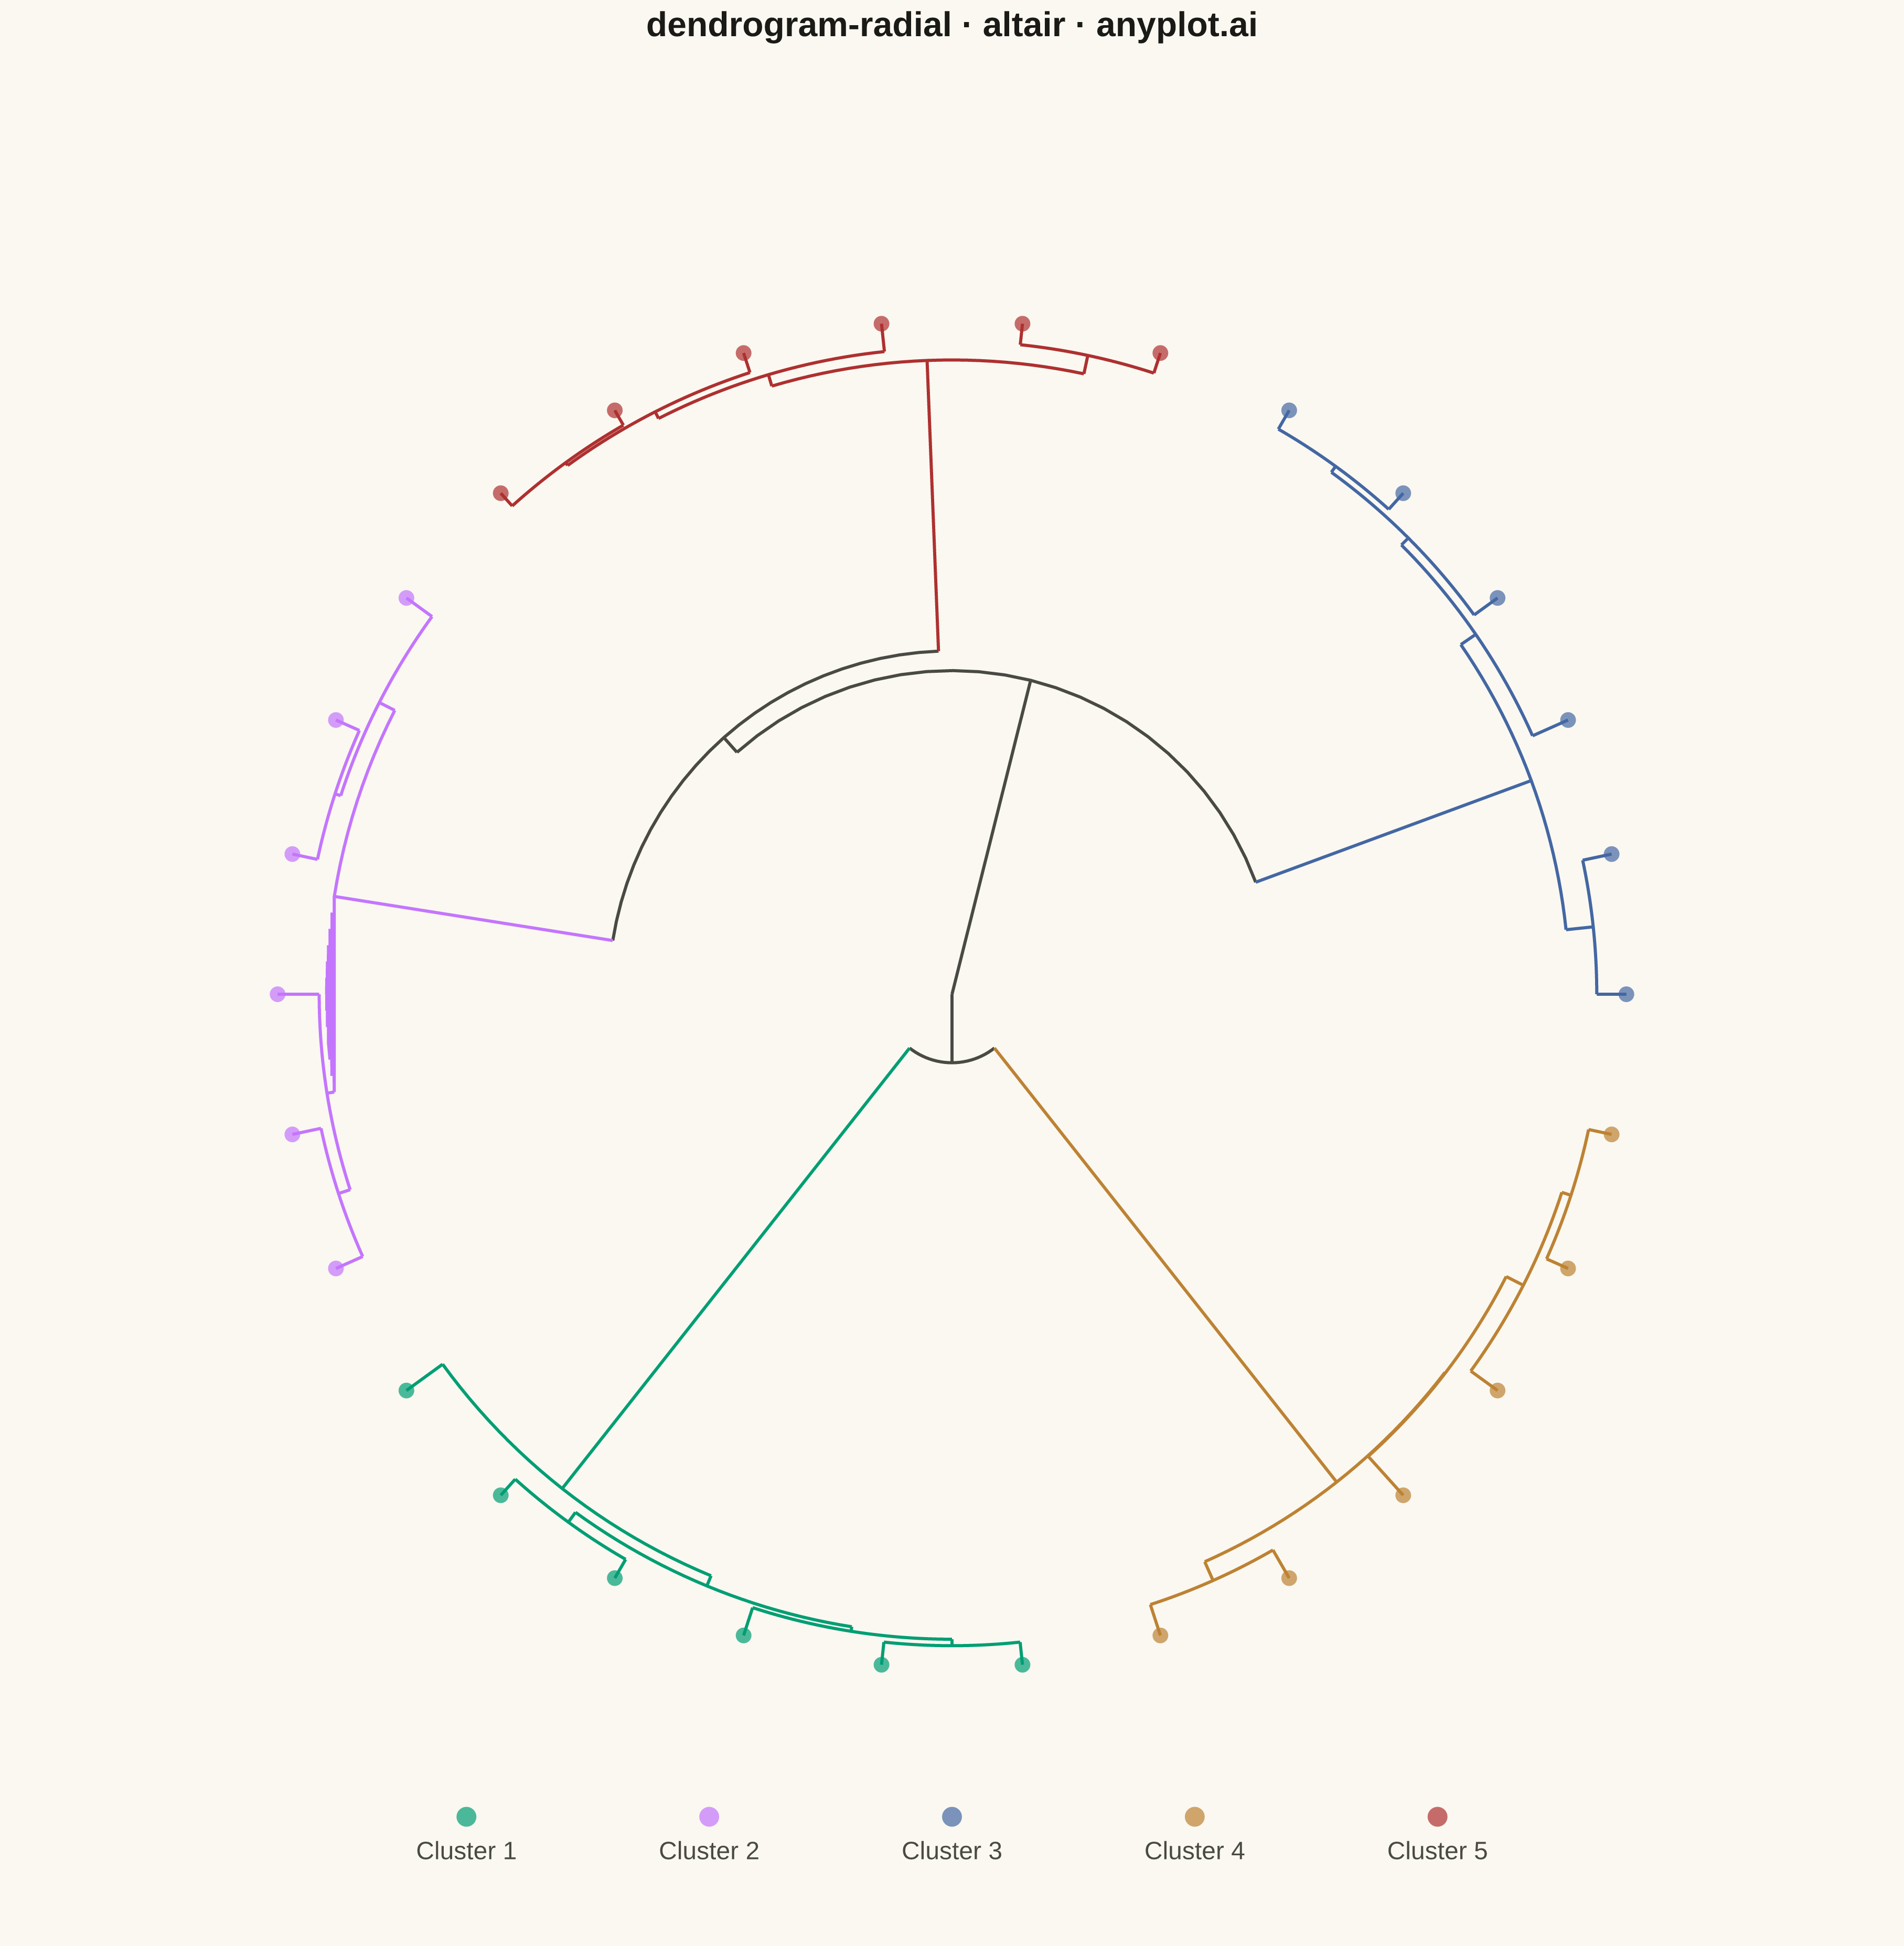
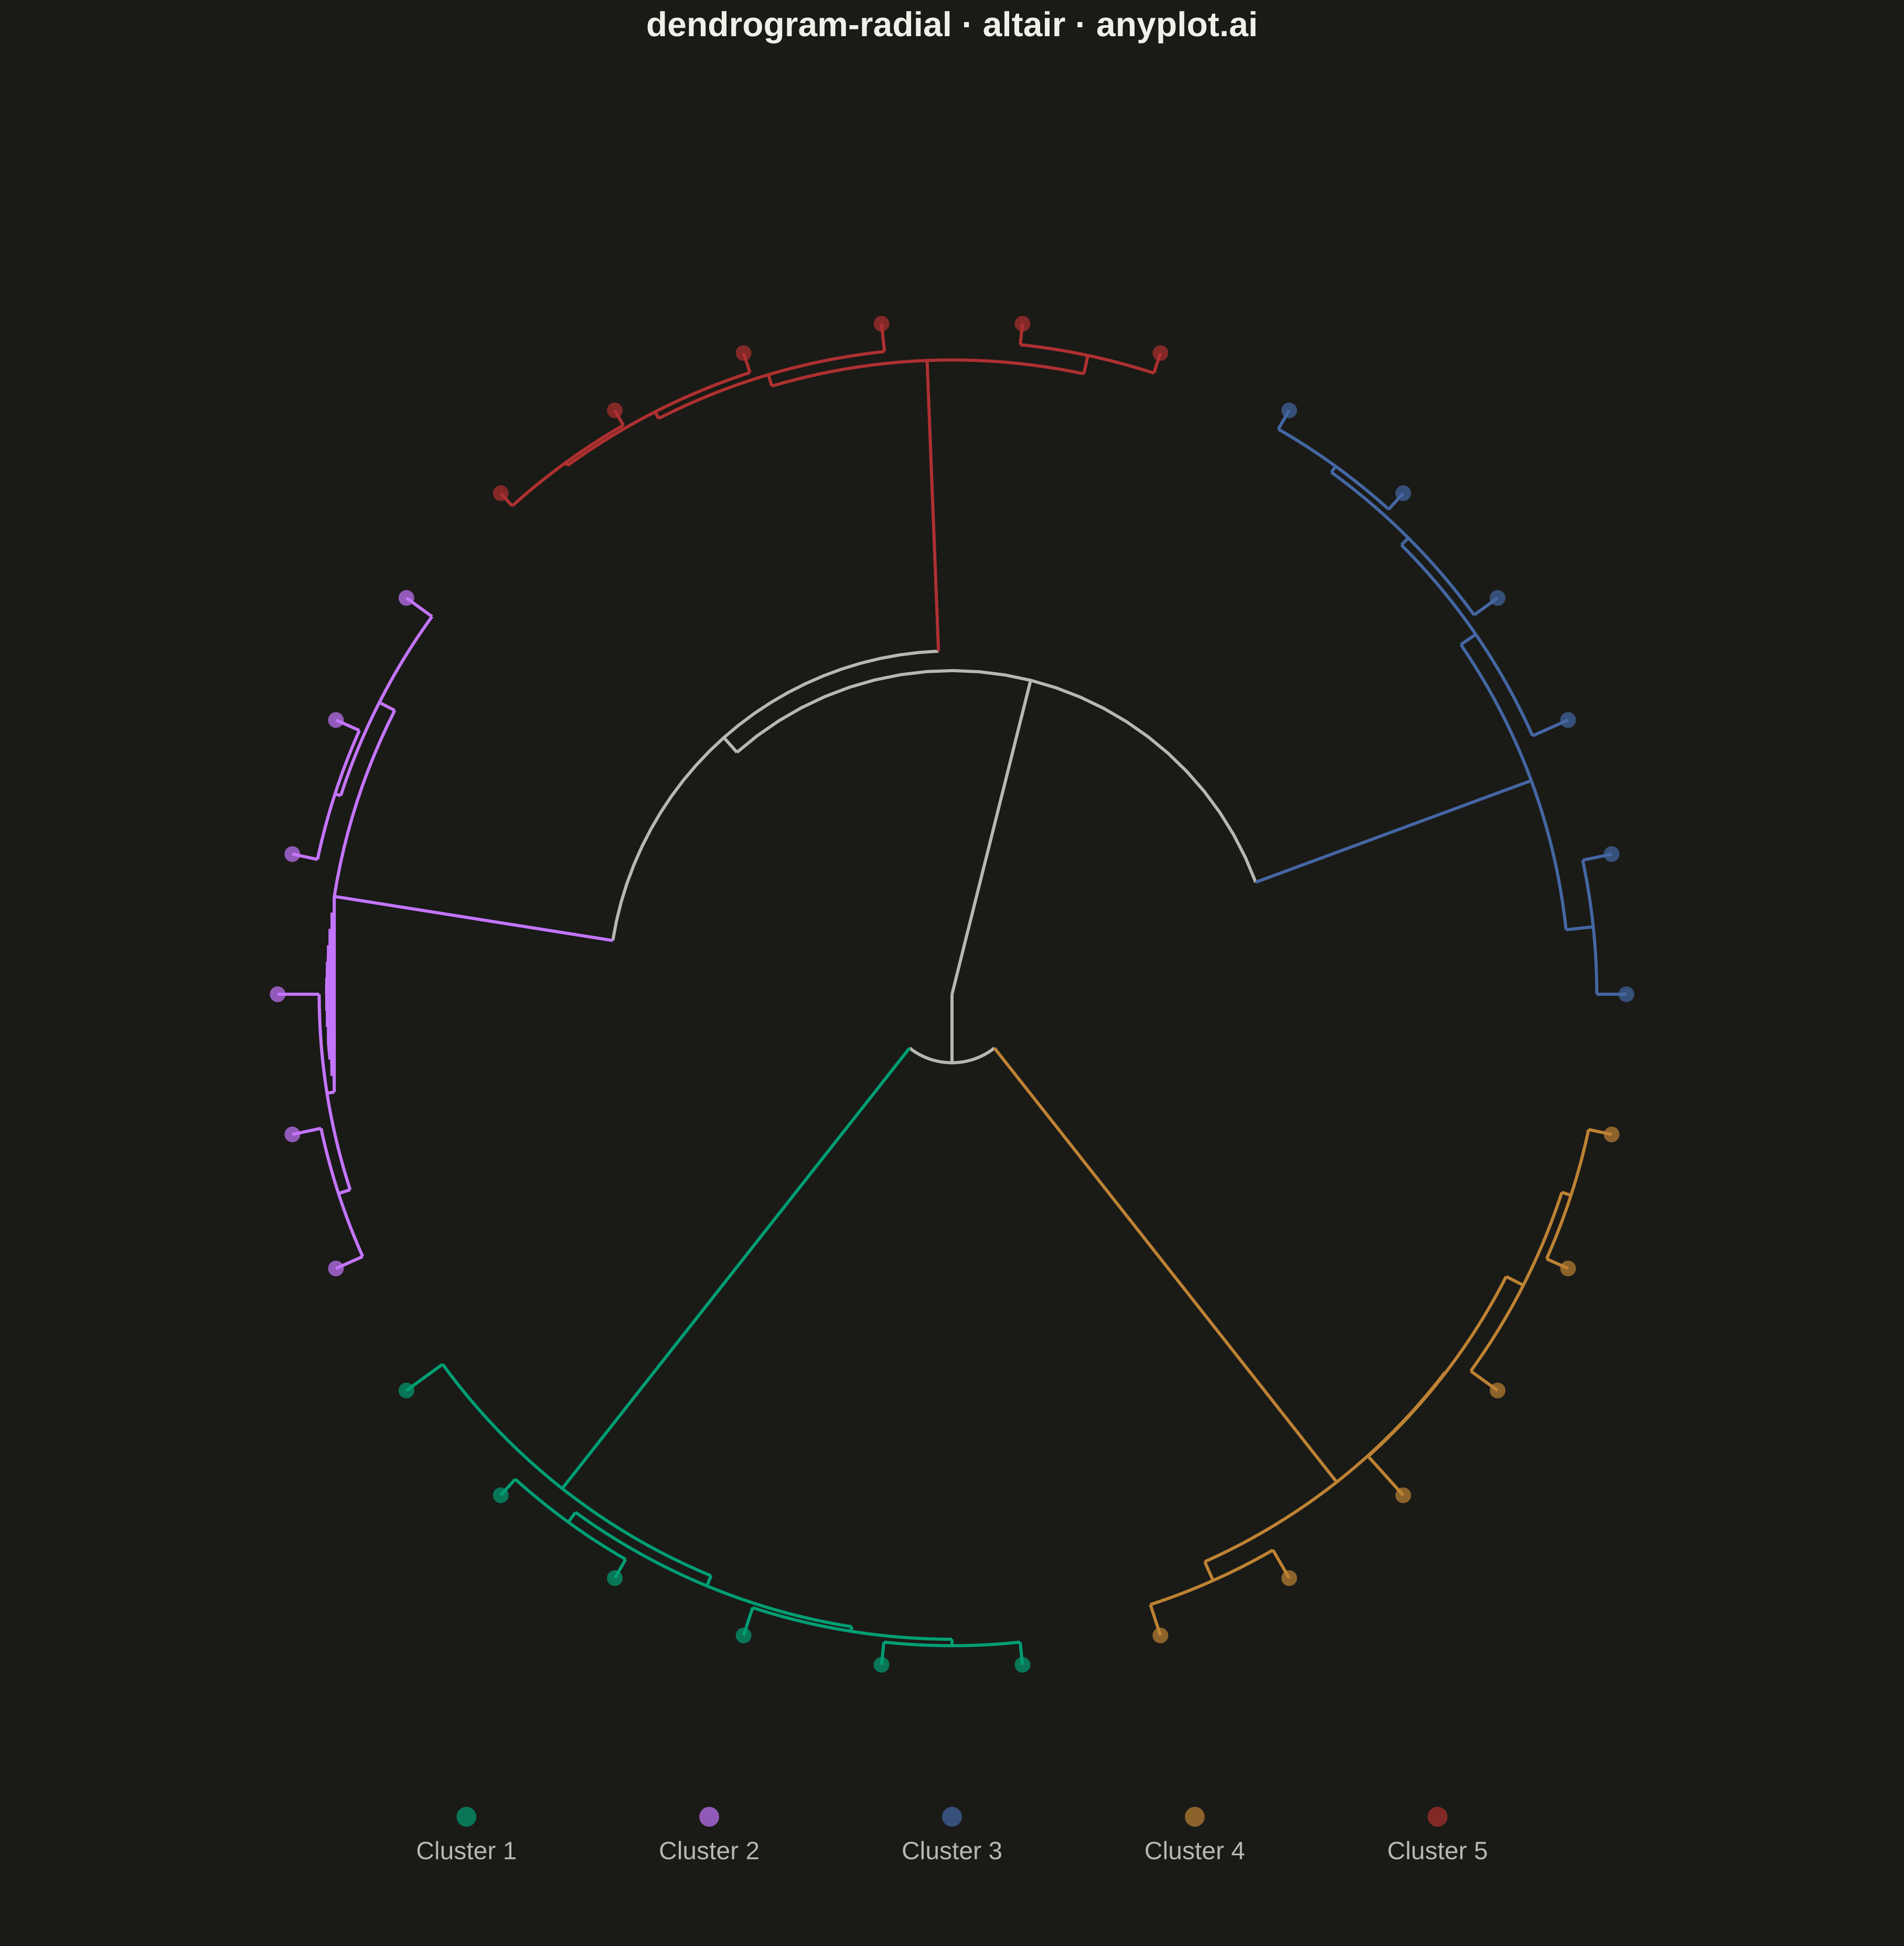
A radial dendrogram renders hierarchical clustering in a circular layout where the root node sits at the center and branches extend outward, with leaf nodes arranged around the circumference. This layout is a space-efficient alternative to linear dendrograms for large hierarchies, making it well-suited for datasets with hundreds of leaves. Branch lengths are proportional to distance or dissimilarity, preserving the quantitative interpretation of cluster merges.
""" anyplot.ai
dendrogram-radial: Radial Dendrogram
Library: altair 6.1.0 | Python 3.13.13
Quality: 83/100 | Created: 2026-05-14
"""

import importlib
import os
import sys

import numpy as np
import pandas as pd
from scipy.cluster.hierarchy import leaves_list, linkage
from scipy.spatial.distance import pdist


# Import altair via importlib after removing this script's directory from sys.path,
# preventing the file named "altair.py" from shadowing the installed altair package.
_script_dir = os.path.dirname(os.path.abspath(__file__))
if _script_dir in sys.path:
    sys.path.remove(_script_dir)
alt = importlib.import_module("altair")


THEME = os.getenv("ANYPLOT_THEME", "light")
PAGE_BG = "#FAF8F1" if THEME == "light" else "#1A1A17"
ELEVATED_BG = "#FFFDF6" if THEME == "light" else "#242420"
INK = "#1A1A17" if THEME == "light" else "#F0EFE8"
INK_SOFT = "#4A4A44" if THEME == "light" else "#B8B7B0"

IMPRINT = ["#009E73", "#C475FD", "#4467A3", "#BD8233", "#AE3030", "#2ABCCD"]

# Data: gene expression profiles, 5 well-separated clusters
np.random.seed(42)
n_genes = 30
n_conditions = 10
n_clusters = 5

cluster_labels = []
for k in range(n_clusters):
    cluster_labels.extend([k] * (n_genes // n_clusters))

cluster_centers = np.random.randn(n_clusters, n_conditions) * 2.5
expression = np.zeros((n_genes, n_conditions))
for idx, c in enumerate(cluster_labels):
    expression[idx] = cluster_centers[c] + np.random.randn(n_conditions) * 0.4

gene_names = [f"G{idx + 1:02d}" for idx in range(n_genes)]

# Hierarchical clustering
dist_matrix = pdist(expression, metric="euclidean")
Z = linkage(dist_matrix, method="ward")

n_leaves = n_genes
leaf_order = leaves_list(Z)
max_dist = Z[-1, 2]

# Equal angular spacing for leaves (in dendrogram order)
leaf_angles_arr = np.linspace(0, 2 * np.pi, n_leaves, endpoint=False)
node_angles = {}
for pos, leaf_idx in enumerate(leaf_order):
    node_angles[leaf_idx] = leaf_angles_arr[pos]

# Radii: leaves at 1.0 (circumference), root near 0.0 (center)
node_radii = dict.fromkeys(range(n_leaves), 1.0)
subtree_clusters = {idx: {cluster_labels[idx]} for idx in range(n_leaves)}

for i, (left, right, dist, _) in enumerate(Z):
    node_id = n_leaves + i
    left, right = int(left), int(right)
    node_radii[node_id] = 1.0 - dist / max_dist

    a1, a2 = node_angles[left], node_angles[right]
    if abs(a2 - a1) > np.pi:
        if a1 < a2:
            a1 += 2 * np.pi
        else:
            a2 += 2 * np.pi
    node_angles[node_id] = ((a1 + a2) / 2) % (2 * np.pi)
    subtree_clusters[node_id] = subtree_clusters[left] | subtree_clusters[right]


def branch_color(node_id):
    clusters = subtree_clusters[node_id]
    if len(clusters) == 1:
        return IMPRINT[list(clusters)[0]]
    return INK_SOFT


# Build line-segment rows: arc (connecting children) + two radial lines (to each child)
ARC_PTS = 25
rows = []
gid = 0

for i, (left, right, _dist, _) in enumerate(Z):
    left, right = int(left), int(right)
    node_id = n_leaves + i
    parent_r = node_radii[node_id]
    left_r = node_radii[left]
    right_r = node_radii[right]
    left_a = node_angles[left]
    right_a = node_angles[right]

    # Arc at parent_r spanning from left_a to right_a (short path)
    a1, a2 = left_a, right_a
    if abs(a2 - a1) > np.pi:
        if a1 < a2:
            a1 += 2 * np.pi
        else:
            a2 += 2 * np.pi
    arc_color = branch_color(node_id)
    for theta in np.linspace(a1, a2, ARC_PTS):
        rows.append({"x": parent_r * np.cos(theta), "y": parent_r * np.sin(theta), "g": gid, "clr": arc_color})
    gid += 1

    # Left radial line
    lc = branch_color(left)
    rows.extend(
        [
            {"x": parent_r * np.cos(left_a), "y": parent_r * np.sin(left_a), "g": gid, "clr": lc},
            {"x": left_r * np.cos(left_a), "y": left_r * np.sin(left_a), "g": gid, "clr": lc},
        ]
    )
    gid += 1

    # Right radial line
    rc = branch_color(right)
    rows.extend(
        [
            {"x": parent_r * np.cos(right_a), "y": parent_r * np.sin(right_a), "g": gid, "clr": rc},
            {"x": right_r * np.cos(right_a), "y": right_r * np.sin(right_a), "g": gid, "clr": rc},
        ]
    )
    gid += 1

df_lines = pd.DataFrame(rows)

# Leaf dots
leaf_rows = []
for leaf_idx in range(n_leaves):
    a = node_angles[leaf_idx]
    c = cluster_labels[leaf_idx]
    leaf_rows.append(
        {
            "x": np.cos(a),
            "y": np.sin(a),
            "label": gene_names[leaf_idx],
            "cluster": f"Cluster {c + 1}",
            "clr": IMPRINT[c],
        }
    )
df_leaves = pd.DataFrame(leaf_rows)

# Horizontal legend below the circle
legend_data = pd.DataFrame(
    {
        "x": np.linspace(-0.72, 0.72, n_clusters),
        "y": [-1.22] * n_clusters,
        "label": [f"Cluster {k + 1}" for k in range(n_clusters)],
        "clr": IMPRINT[:n_clusters],
    }
)

all_colors = sorted(set(df_lines["clr"].unique()) | set(IMPRINT[:n_clusters]))
cscale = alt.Scale(domain=all_colors, range=all_colors)
XY_DOM = [-1.40, 1.40]

lines_layer = (
    alt.Chart(df_lines)
    .mark_line(strokeWidth=2.0)
    .encode(
        x=alt.X("x:Q", scale=alt.Scale(domain=XY_DOM), axis=None),
        y=alt.Y("y:Q", scale=alt.Scale(domain=XY_DOM), axis=None),
        detail="g:N",
        color=alt.Color("clr:N", scale=cscale, legend=None),
    )
)

dots_layer = (
    alt.Chart(df_leaves)
    .mark_circle(size=100)
    .encode(
        x=alt.X("x:Q", scale=alt.Scale(domain=XY_DOM), axis=None),
        y=alt.Y("y:Q", scale=alt.Scale(domain=XY_DOM), axis=None),
        color=alt.Color("clr:N", scale=cscale, legend=None),
        tooltip=["label:N", "cluster:N"],
    )
)

legend_dots_layer = (
    alt.Chart(legend_data)
    .mark_circle(size=160)
    .encode(
        x=alt.X("x:Q", scale=alt.Scale(domain=XY_DOM), axis=None),
        y=alt.Y("y:Q", scale=alt.Scale(domain=XY_DOM), axis=None),
        color=alt.Color("clr:N", scale=cscale, legend=None),
    )
)

legend_text_layer = (
    alt.Chart(legend_data)
    .mark_text(dy=22, fontSize=16, align="center")
    .encode(
        x=alt.X("x:Q", scale=alt.Scale(domain=XY_DOM), axis=None),
        y=alt.Y("y:Q", scale=alt.Scale(domain=XY_DOM), axis=None),
        text="label:N",
        color=alt.value(INK_SOFT),
    )
)

TITLE = "dendrogram-radial · altair · anyplot.ai"

chart = (
    alt.layer(lines_layer, dots_layer, legend_dots_layer, legend_text_layer)
    .properties(width=1200, height=1200, title=alt.Title(TITLE, fontSize=22), background=PAGE_BG)
    .configure_view(fill=PAGE_BG, strokeWidth=0)
    .configure_title(color=INK, fontSize=22)
)

# Save
chart.save(f"plot-{THEME}.png", scale_factor=3.0)
chart.save(f"plot-{THEME}.html")
Runnable source as JSON, for any HTTP client: https://api.anyplot.ai/specs/dendrogram-radial/altair/code. Any spec id and library id listed in llms-full.txt fit the same URL shape; every URL below is complete and callable.
{
  "spec_id": "dendrogram-radial",
  "language": "python",
  "library": "altair",
  "page": "https://anyplot.ai/dendrogram-radial/python/altair",
  "hub": "https://anyplot.ai/dendrogram-radial",
  "code_json": "https://api.anyplot.ai/specs/dendrogram-radial/altair/code",
  "spec_json": "https://api.anyplot.ai/specs/dendrogram-radial",
  "render_light_png": "https://storage.googleapis.com/anyplot-images/plots/dendrogram-radial/python/altair/plot-light.png",
  "render_dark_png": "https://storage.googleapis.com/anyplot-images/plots/dendrogram-radial/python/altair/plot-dark.png",
  "interactive_light_html": "https://storage.googleapis.com/anyplot-images/plots/dendrogram-radial/python/altair/plot-light.html",
  "interactive_dark_html": "https://storage.googleapis.com/anyplot-images/plots/dendrogram-radial/python/altair/plot-dark.html",
  "quality_score": 83.0,
  "license": "MIT",
  "guide": "https://anyplot.ai/llms.txt"
}
Part of Radial Dendrogram on anyplot.ai.