The same plot in 14 other libraries — Python: Altair, Bokeh, lets-plot, Matplotlib, Plotly, plotnine, Pygal; R: ggplot2; Julia: Makie.jl; JavaScript: Chart.js, D3.js, Apache ECharts, Highcharts, MUI X Charts. Compare all 15 side by side: Radial Dendrogram in Python, R, Julia and JavaScript.
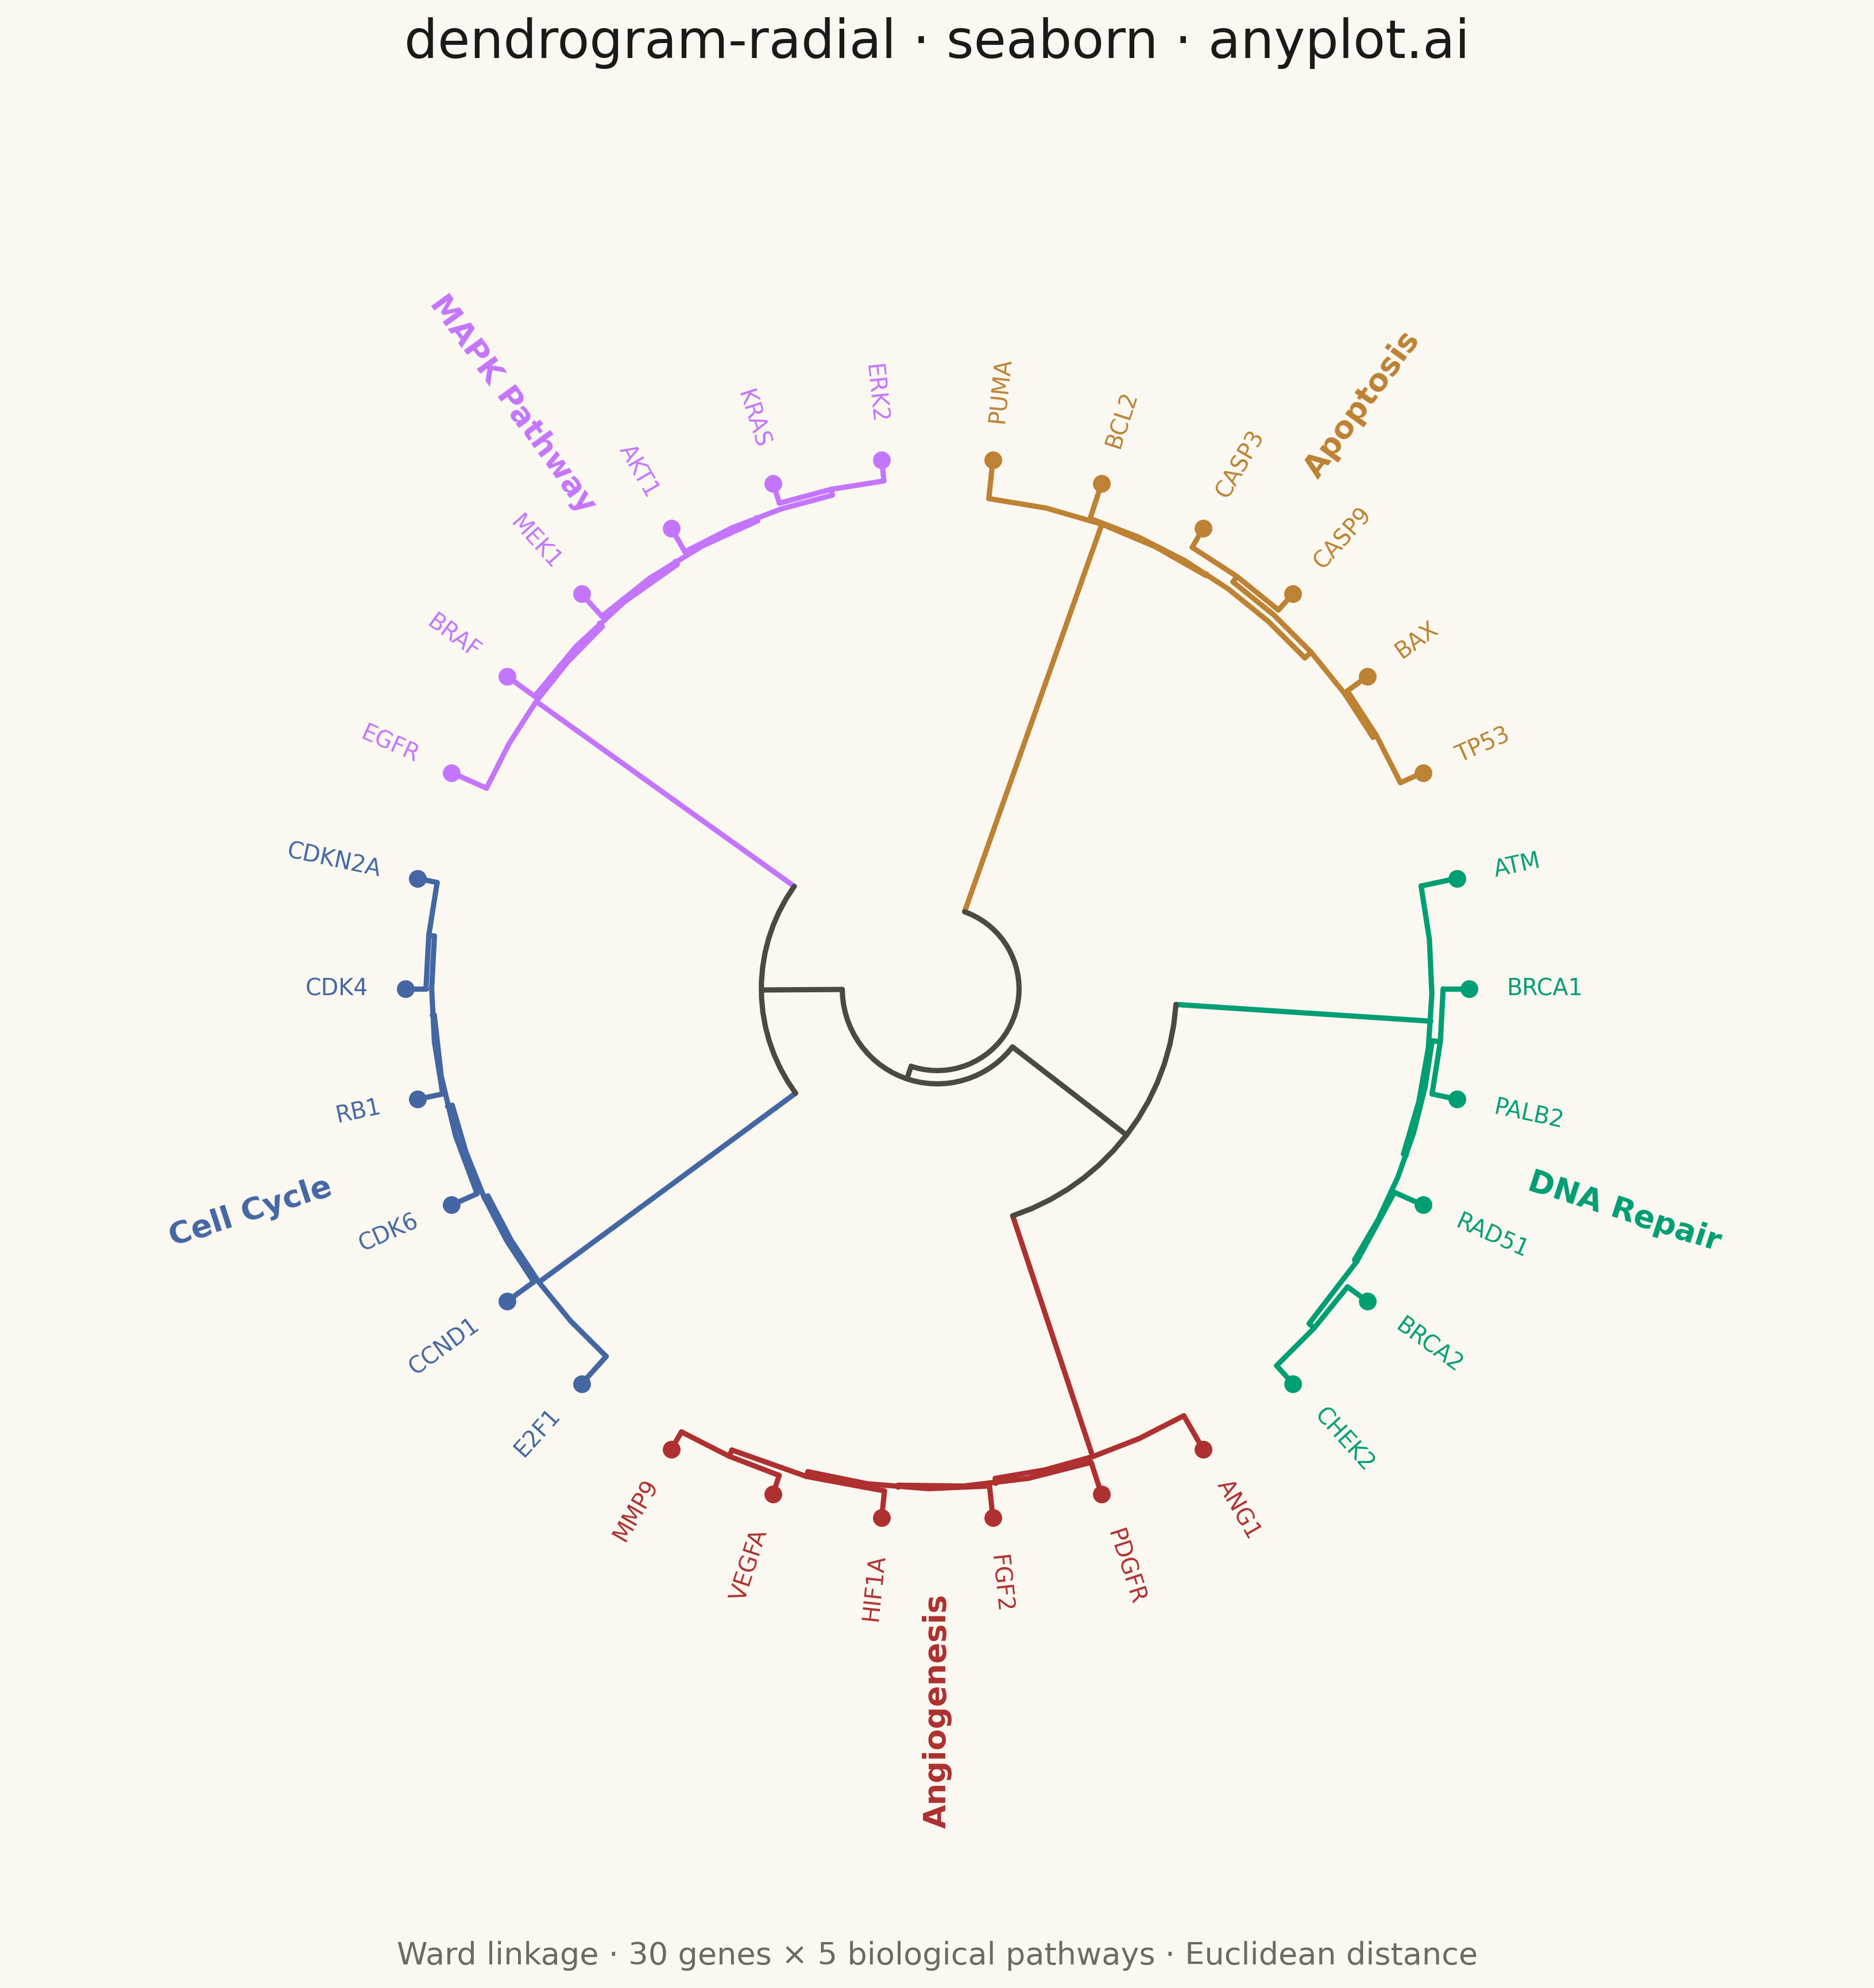
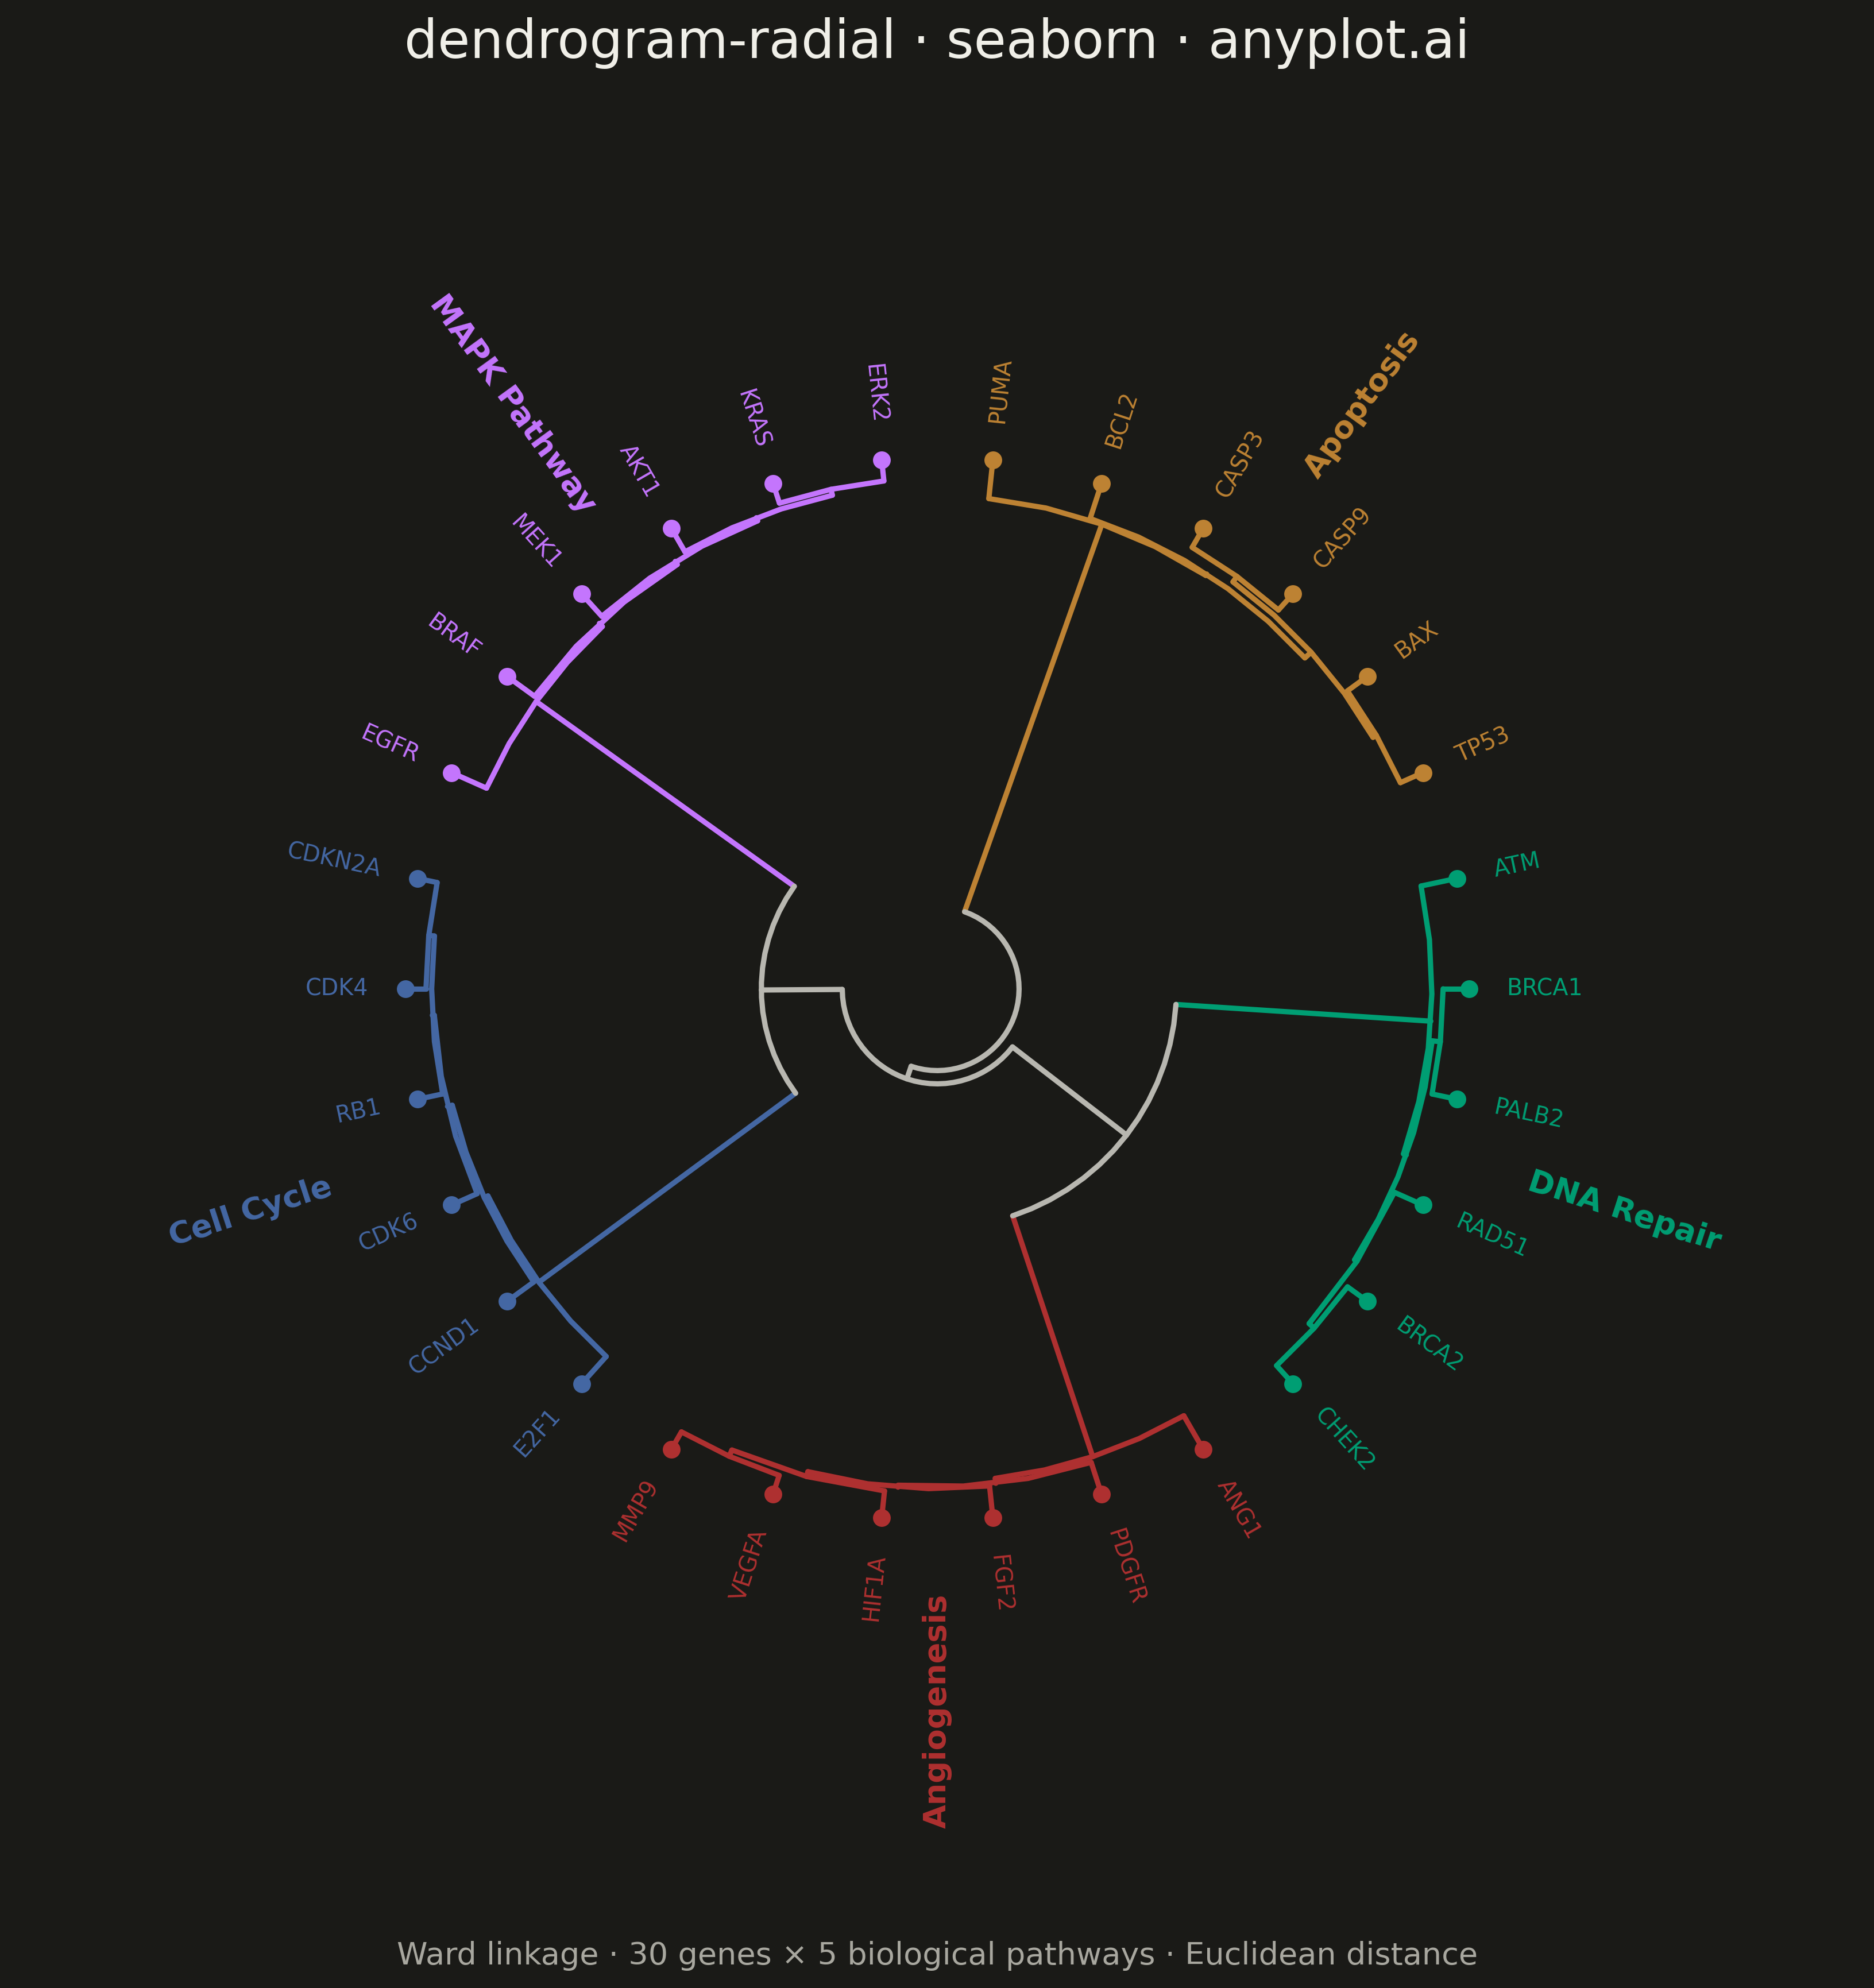
A radial dendrogram renders hierarchical clustering in a circular layout where the root node sits at the center and branches extend outward, with leaf nodes arranged around the circumference. This layout is a space-efficient alternative to linear dendrograms for large hierarchies, making it well-suited for datasets with hundreds of leaves. Branch lengths are proportional to distance or dissimilarity, preserving the quantitative interpretation of cluster merges.
""" anyplot.ai
dendrogram-radial: Radial Dendrogram
Library: seaborn 0.13.2 | Python 3.13.13
Quality: 81/100 | Created: 2026-05-14
"""

import os

import matplotlib.pyplot as plt
import numpy as np
import seaborn as sns
from scipy.cluster.hierarchy import dendrogram, linkage
from scipy.spatial.distance import pdist


# Theme tokens
THEME = os.getenv("ANYPLOT_THEME", "light")
PAGE_BG = "#FAF8F1" if THEME == "light" else "#1A1A17"
ELEVATED_BG = "#FFFDF6" if THEME == "light" else "#242420"
INK = "#1A1A17" if THEME == "light" else "#F0EFE8"
INK_SOFT = "#4A4A44" if THEME == "light" else "#B8B7B0"
INK_MUTED = "#6B6A63" if THEME == "light" else "#A8A79F"

IMPRINT = ["#009E73", "#C475FD", "#4467A3", "#BD8233", "#AE3030"]

sns.set_theme(style="white", rc={"figure.facecolor": PAGE_BG, "axes.facecolor": PAGE_BG, "text.color": INK})

# Data — gene expression profiles for 30 genes across 5 biological pathways
np.random.seed(42)
N_CLUSTERS = 5
N_PER_CLUSTER = 6
N_SAMPLES = N_CLUSTERS * N_PER_CLUSTER
N_FEATURES = 20

pathway_labels = [
    ["BRCA1", "BRCA2", "RAD51", "PALB2", "CHEK2", "ATM"],
    ["EGFR", "KRAS", "BRAF", "MEK1", "ERK2", "AKT1"],
    ["CDK4", "CDK6", "CCND1", "RB1", "E2F1", "CDKN2A"],
    ["BCL2", "BAX", "CASP3", "CASP9", "TP53", "PUMA"],
    ["VEGFA", "HIF1A", "PDGFR", "FGF2", "ANG1", "MMP9"],
]
pathway_names = ["DNA Repair", "MAPK Pathway", "Cell Cycle", "Apoptosis", "Angiogenesis"]
gene_labels = [gene for pathway in pathway_labels for gene in pathway]
true_clusters = np.repeat(np.arange(N_CLUSTERS), N_PER_CLUSTER)

cluster_centers = np.random.randn(N_CLUSTERS, N_FEATURES) * 4
X = np.vstack([cluster_centers[c] + np.random.randn(N_PER_CLUSTER, N_FEATURES) * 0.7 for c in range(N_CLUSTERS)])

# Hierarchical clustering
Z = linkage(pdist(X, metric="euclidean"), method="ward")
# Use true_clusters for coloring so pathway labels stay consistent with colors
flat = true_clusters

# Dendrogram layout (Cartesian, no render)
dend = dendrogram(Z, no_plot=True, labels=gene_labels)
icoord = np.array(dend["icoord"])
dcoord = np.array(dend["dcoord"])
leaf_order = dend["leaves"]

x_max = 10.0 * N_SAMPLES
y_max = float(dcoord.max())

R_LEAF = 0.78  # outer radius (leaves)
R_ROOT = 0.12  # inner radius (root)


def x_to_angle(x):
    return x / x_max * 2 * np.pi


def y_to_radius(y):
    # y=0 (leaves) -> R_LEAF outer; y=y_max (root) -> R_ROOT inner
    return R_LEAF - (y / y_max) * (R_LEAF - R_ROOT)


# Subtree coloring: pure cluster -> Okabe-Ito color; mixed -> neutral
def get_subtree_leaves(node_id):
    if node_id < N_SAMPLES:
        return [int(node_id)]
    idx = int(node_id) - N_SAMPLES
    return get_subtree_leaves(int(Z[idx, 0])) + get_subtree_leaves(int(Z[idx, 1]))


def get_node_color(node_id):
    leaves_in = get_subtree_leaves(node_id)
    clusters_in = {flat[leaf] for leaf in leaves_in}
    if len(clusters_in) == 1:
        return IMPRINT[clusters_in.pop()]
    return INK_SOFT


# Map merge height -> Z row index (Ward distances are unique)
dist_to_z_idx = {round(float(Z[i, 2]), 6): i for i in range(len(Z))}

# Plot — square canvas for symmetric layout
fig = plt.figure(figsize=(12, 12), facecolor=PAGE_BG)
ax = fig.add_subplot(111, projection="polar")
ax.set_facecolor(PAGE_BG)
ax.set_theta_zero_location("N")
ax.set_theta_direction(-1)  # clockwise so layout reads naturally top -> right -> bottom

# Draw each U-shape as radial lines + arc
LW = 2.2
for ic, dc in zip(icoord, dcoord, strict=False):
    merge_height = round(float(dc[1]), 6)
    z_idx = dist_to_z_idx.get(merge_height)

    if z_idx is not None:
        left_id = int(Z[z_idx, 0])
        right_id = int(Z[z_idx, 1])
        color_left = get_node_color(left_id)
        color_right = get_node_color(right_id)
        color_arc = get_node_color(N_SAMPLES + z_idx)
    else:
        color_left = color_right = color_arc = INK_SOFT

    theta_left = x_to_angle(ic[0])
    theta_right = x_to_angle(ic[3])
    r_left_bot = y_to_radius(dc[0])
    r_right_bot = y_to_radius(dc[3])
    r_top = y_to_radius(dc[1])

    # Left radial bar (child to merge height)
    ax.plot([theta_left, theta_left], [r_left_bot, r_top], color=color_left, lw=LW, solid_capstyle="round")
    # Right radial bar
    ax.plot([theta_right, theta_right], [r_right_bot, r_top], color=color_right, lw=LW, solid_capstyle="round")
    # Arc connecting children at merge radius
    n_pts = max(3, int(abs(theta_right - theta_left) * 40 / np.pi))
    theta_arc = np.linspace(theta_left, theta_right, n_pts)
    ax.plot(theta_arc, np.full(n_pts, r_top), color=color_arc, lw=LW, solid_capstyle="round")

# Leaf dots and gene labels around circumference
R_DOT = R_LEAF
R_LABEL = R_LEAF + 0.055

for disp_pos, leaf_idx in enumerate(leaf_order):
    angle = x_to_angle(10 * disp_pos + 5)
    cluster_id = flat[leaf_idx]
    color = IMPRINT[cluster_id]

    # Colored dot at leaf
    ax.scatter([angle], [R_DOT], color=color, s=55, zorder=5, linewidths=0)

    # Gene name — rotate to read outward (radially away from center)
    angle_deg = np.degrees(angle) % 360
    if angle_deg < 180:
        ha = "left"
        rot = 90 - angle_deg
    else:
        ha = "right"
        rot = 270 - angle_deg
    ax.text(
        angle,
        R_LABEL,
        gene_labels[leaf_idx],
        ha=ha,
        va="center",
        fontsize=9.5,
        color=color,
        fontweight="medium",
        rotation=rot,
        rotation_mode="anchor",
    )

# Pathway labels at outer ring — positioned at angular centroid of each cluster
R_PATHWAY = R_LEAF + 0.28
for c in range(N_CLUSTERS):
    positions = [disp_pos for disp_pos, leaf_idx in enumerate(leaf_order) if flat[leaf_idx] == c]
    if not positions:
        continue
    center_angle = x_to_angle(10 * np.mean(positions) + 5)
    angle_deg = np.degrees(center_angle) % 360
    if angle_deg < 180:
        rot = 90 - angle_deg
    else:
        rot = 270 - angle_deg
    ax.text(
        center_angle,
        R_PATHWAY,
        pathway_names[c],
        ha="center",
        va="center",
        fontsize=13,
        fontweight="bold",
        color=IMPRINT[c],
        rotation=rot,
        rotation_mode="anchor",
    )

# Polar axis cleanup
ax.set_ylim(0, 1.35)
ax.set_xticks([])
ax.set_yticks([])
ax.spines["polar"].set_visible(False)
ax.grid(False)

# Title and subtitle
fig.text(
    0.5,
    0.97,
    "dendrogram-radial · seaborn · anyplot.ai",
    ha="center",
    va="top",
    fontsize=22,
    fontweight="medium",
    color=INK,
)
fig.text(
    0.5,
    0.025,
    "Ward linkage · 30 genes × 5 biological pathways · Euclidean distance",
    ha="center",
    va="bottom",
    fontsize=13,
    color=INK_MUTED,
)

plt.tight_layout(rect=[0, 0.04, 1, 0.96])
plt.savefig(f"plot-{THEME}.png", dpi=300, bbox_inches="tight", facecolor=PAGE_BG)
Runnable source as JSON, for any HTTP client: https://api.anyplot.ai/specs/dendrogram-radial/seaborn/code. Any spec id and library id listed in llms-full.txt fit the same URL shape; every URL below is complete and callable.
{
  "spec_id": "dendrogram-radial",
  "language": "python",
  "library": "seaborn",
  "page": "https://anyplot.ai/dendrogram-radial/python/seaborn",
  "hub": "https://anyplot.ai/dendrogram-radial",
  "code_json": "https://api.anyplot.ai/specs/dendrogram-radial/seaborn/code",
  "spec_json": "https://api.anyplot.ai/specs/dendrogram-radial",
  "render_light_png": "https://storage.googleapis.com/anyplot-images/plots/dendrogram-radial/python/seaborn/plot-light.png",
  "render_dark_png": "https://storage.googleapis.com/anyplot-images/plots/dendrogram-radial/python/seaborn/plot-dark.png",
  "quality_score": 81.0,
  "license": "MIT",
  "guide": "https://anyplot.ai/llms.txt"
}
Part of Radial Dendrogram on anyplot.ai.