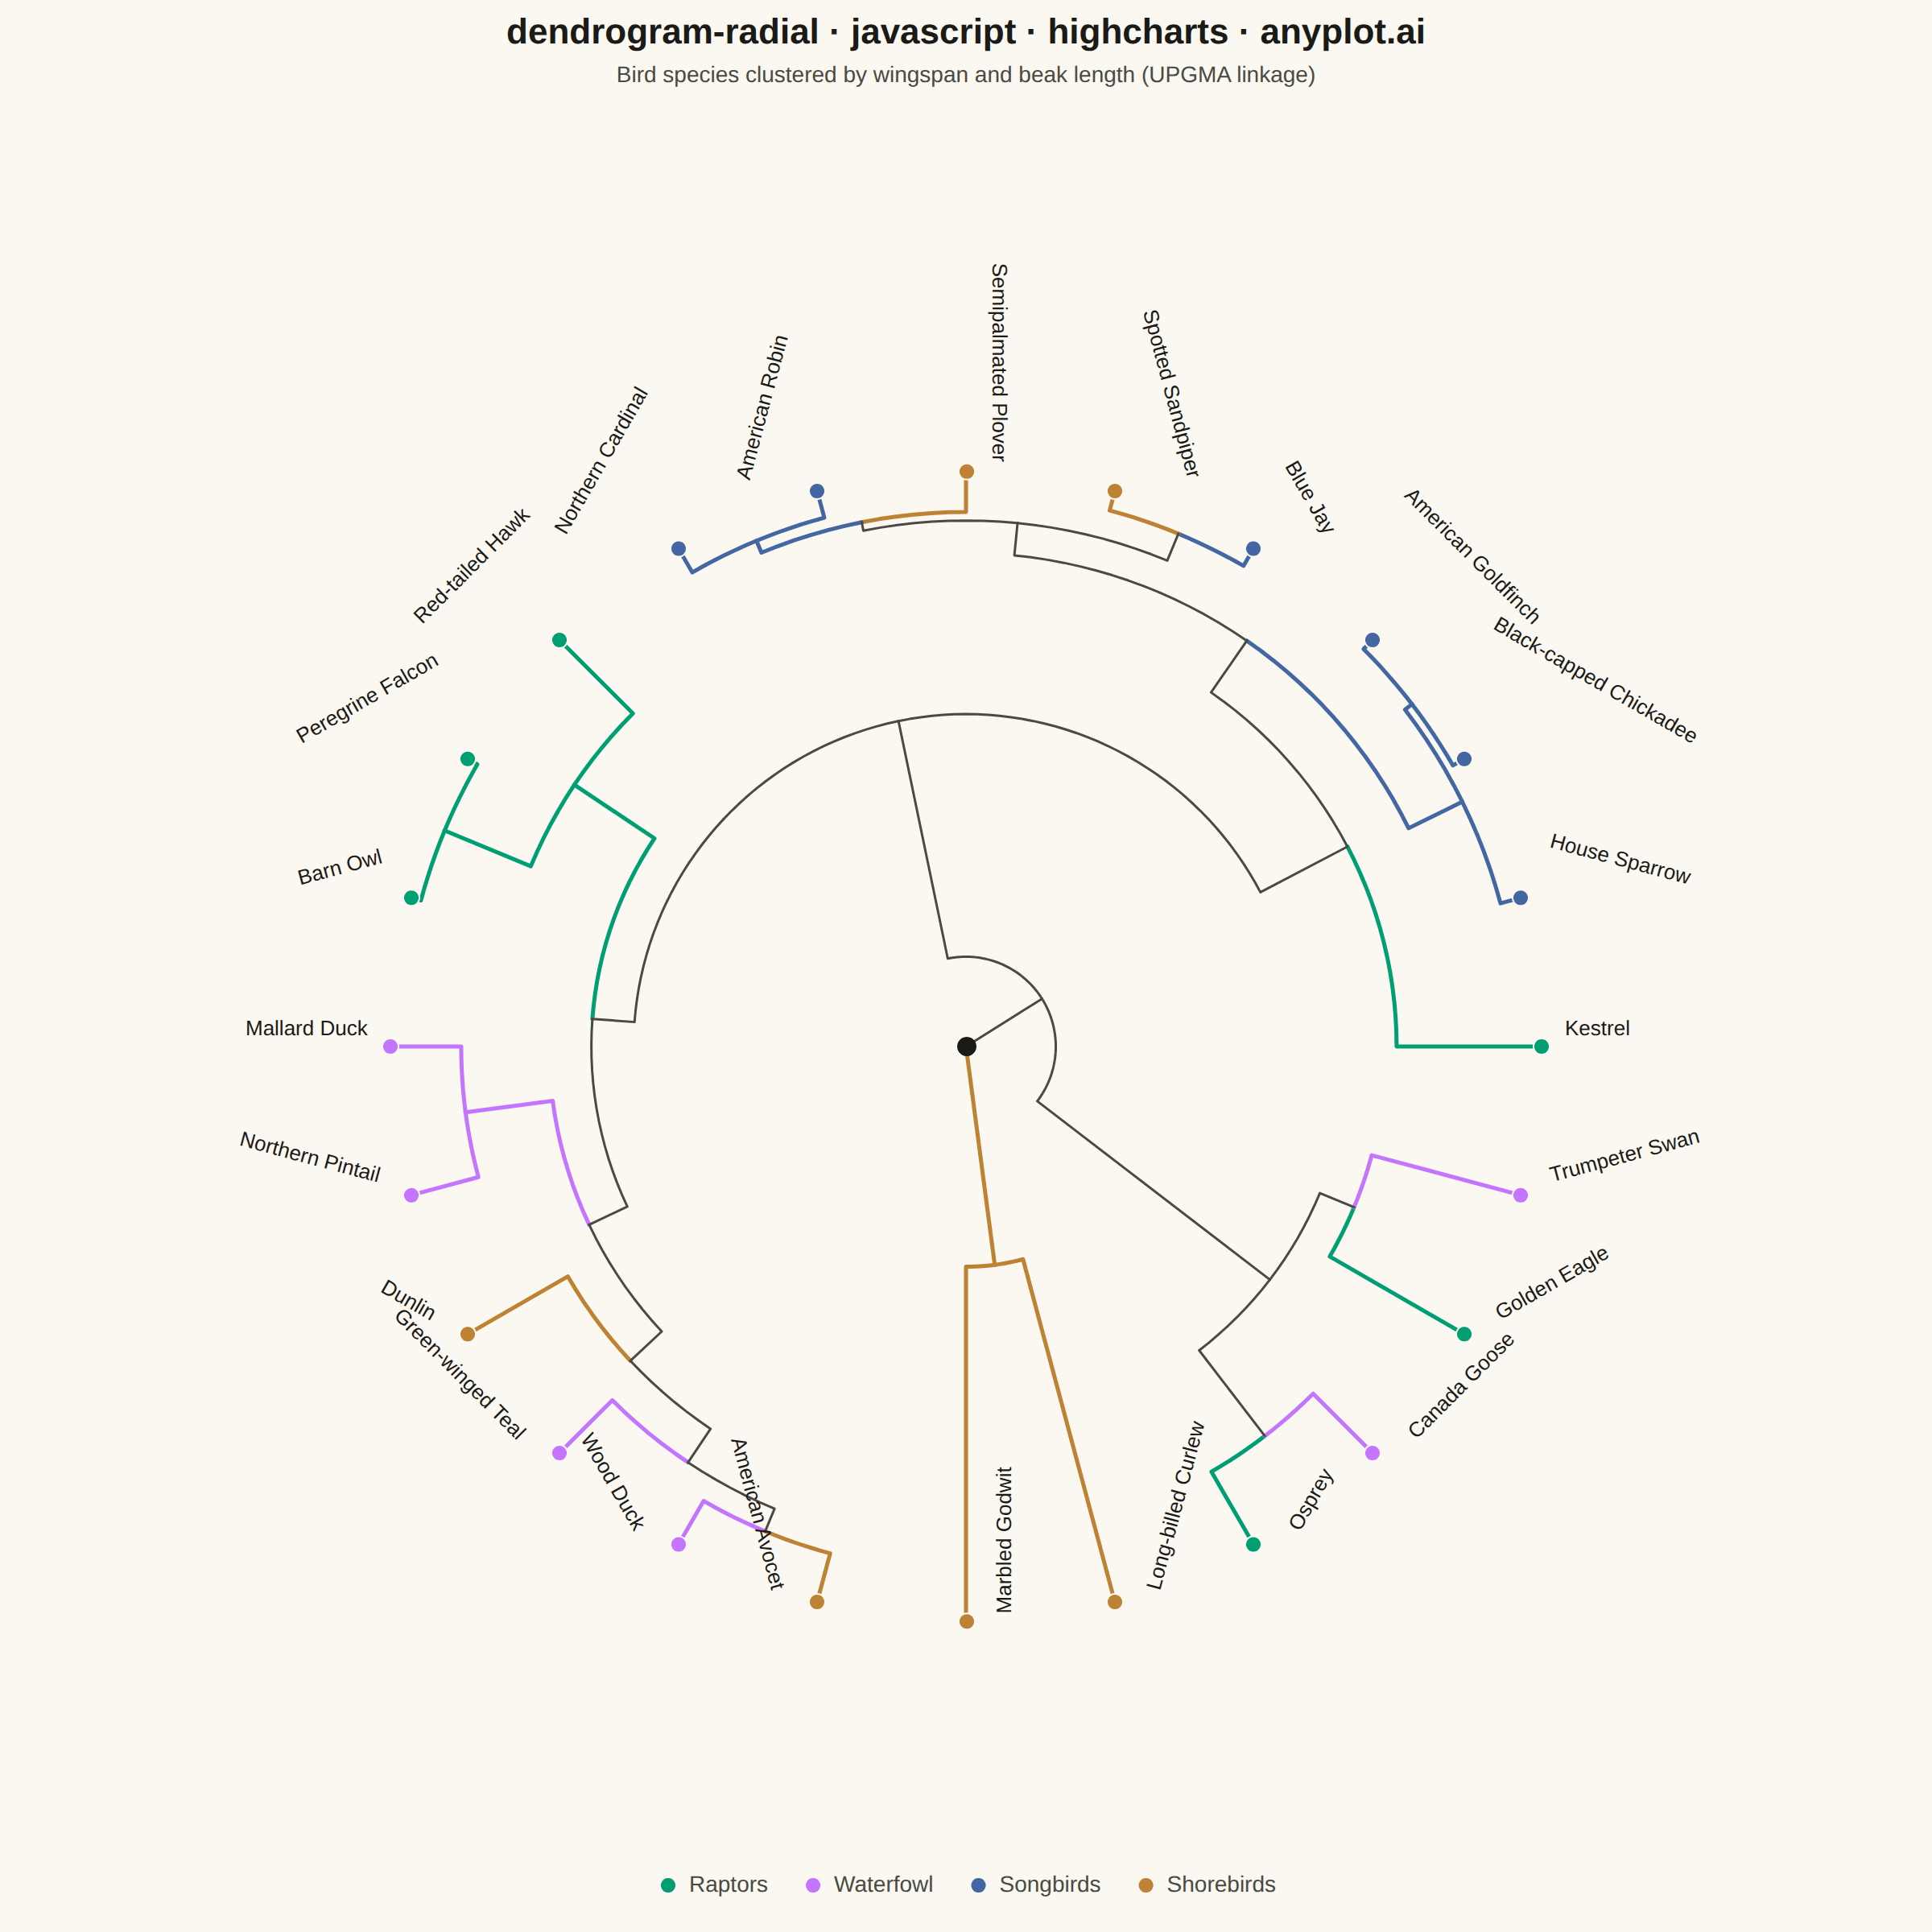
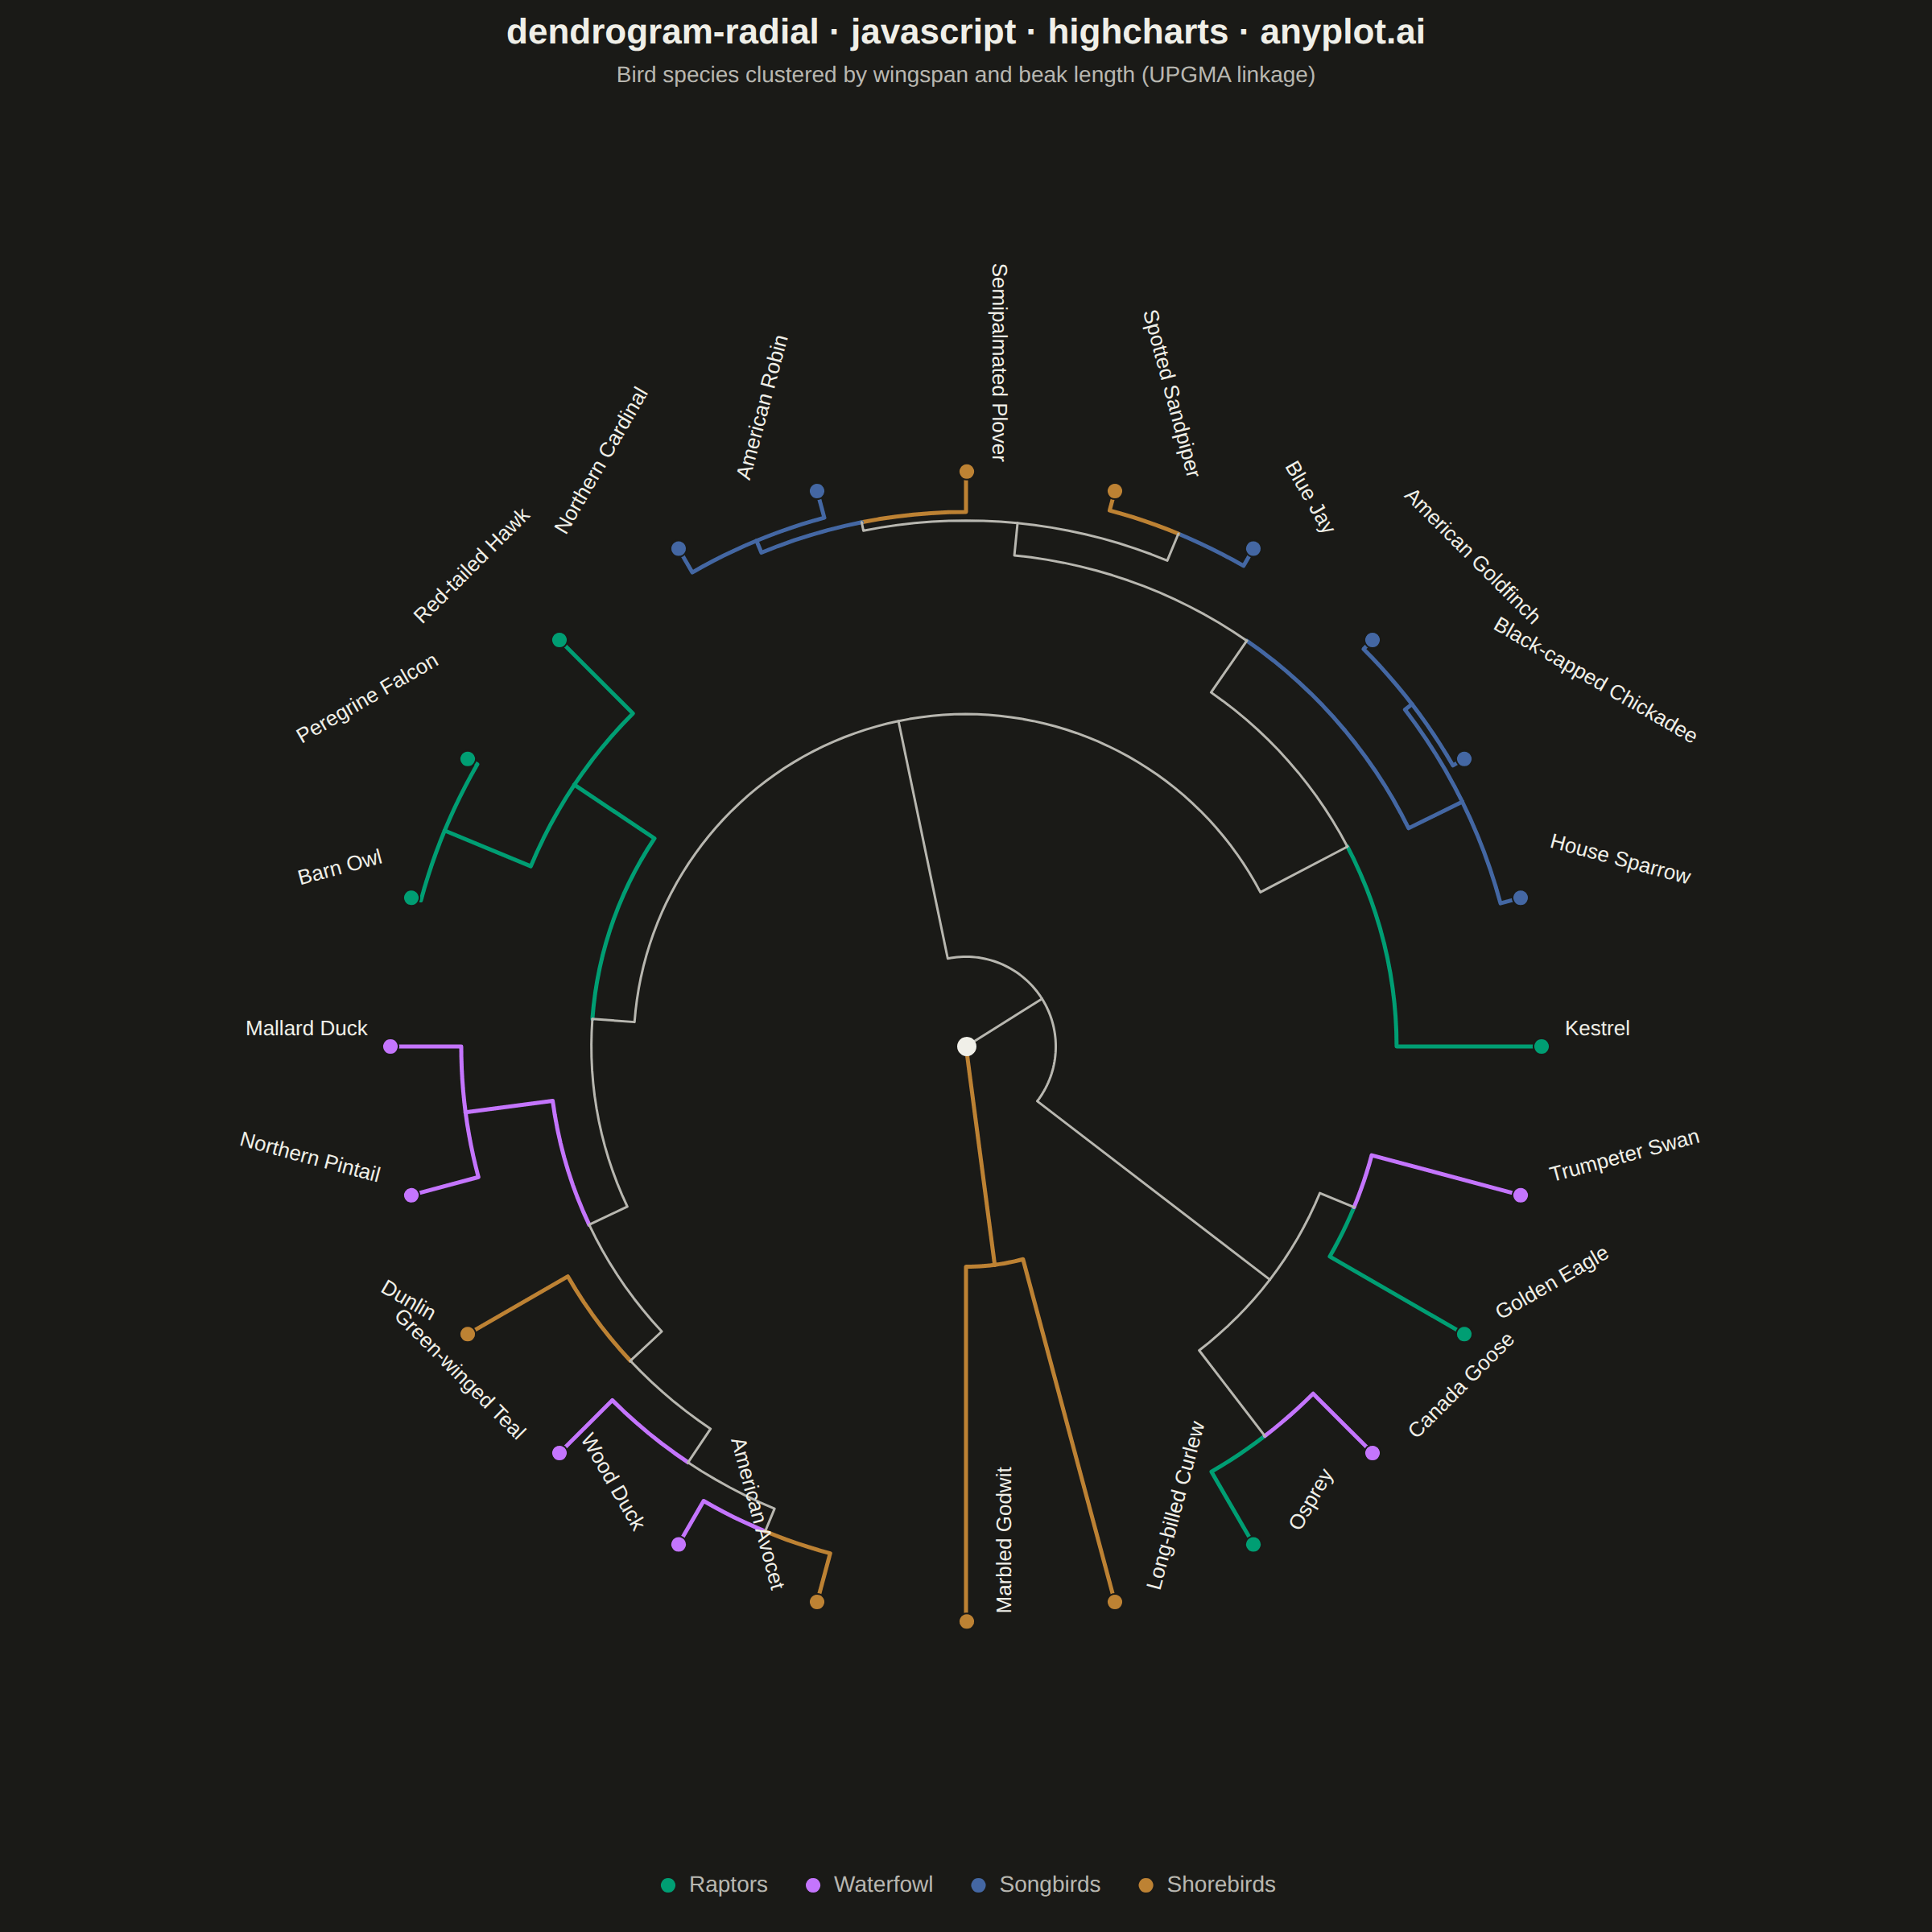
The same plot in 14 other libraries — JavaScript: Chart.js, D3.js, Apache ECharts, MUI X Charts; Python: Altair, Bokeh, lets-plot, Matplotlib, Plotly, plotnine, Pygal, Seaborn; R: ggplot2; Julia: Makie.jl. Compare all 15 side by side: Radial Dendrogram in Python, R, Julia and JavaScript.
A radial dendrogram renders hierarchical clustering in a circular layout where the root node sits at the center and branches extend outward, with leaf nodes arranged around the circumference. This layout is a space-efficient alternative to linear dendrograms for large hierarchies, making it well-suited for datasets with hundreds of leaves. Branch lengths are proportional to distance or dissimilarity, preserving the quantitative interpretation of cluster merges.
// anyplot.ai
// dendrogram-radial: Radial Dendrogram
// Library: highcharts 12.6.0 | JavaScript 22.23.2
// Quality: 83/100 | Created: 2026-09-05
//# anyplot-orientation: square
// anyplot.ai
// dendrogram-radial: Radial Dendrogram
// Library: Highcharts 12.6.0 | Node 22
// License: Highcharts — commercial license, free for non-commercial use (highcharts.com/license)
// Quality: pending | Created: 2026-09-05

const t = window.ANYPLOT_TOKENS;

// --- Data: bird species with wingspan / beak-length traits, grouped by family ----------
// [name, wingspanCm, beakLengthMm, familyIndex]
const SPECIES = [
  ["Golden Eagle", 204, 48, 0],
  ["Red-tailed Hawk", 127, 32, 0],
  ["Peregrine Falcon", 104, 22, 0],
  ["Barn Owl", 107, 22, 0],
  ["Osprey", 168, 40, 0],
  ["Kestrel", 71, 14, 0],
  ["Mallard Duck", 89, 55, 1],
  ["Canada Goose", 155, 50, 1],
  ["Trumpeter Swan", 200, 70, 1],
  ["Wood Duck", 74, 33, 1],
  ["Northern Pintail", 88, 45, 1],
  ["Green-winged Teal", 61, 28, 1],
  ["House Sparrow", 24, 11, 2],
  ["American Robin", 36, 17, 2],
  ["Blue Jay", 41, 20, 2],
  ["Northern Cardinal", 31, 14, 2],
  ["Black-capped Chickadee", 19, 8, 2],
  ["American Goldfinch", 22, 9, 2],
  ["Spotted Sandpiper", 37, 22, 3],
  ["Semipalmated Plover", 43, 13, 3],
  ["American Avocet", 71, 40, 3],
  ["Marbled Godwit", 76, 80, 3],
  ["Long-billed Curlew", 91, 130, 3],
  ["Dunlin", 38, 32, 3],
];
const FAMILY_NAMES = ["Raptors", "Waterfowl", "Songbirds", "Shorebirds"];
const FAMILY_COLORS = [t.palette[0], t.palette[1], t.palette[2], t.palette[3]];
const n = SPECIES.length;

// --- Standardize traits, then average-linkage (UPGMA) agglomerative clustering --------
const mean = (arr) => arr.reduce((sum, v) => sum + v, 0) / arr.length;
const std = (arr) => {
  const m = mean(arr);
  return Math.sqrt(mean(arr.map((v) => (v - m) ** 2)));
};
const wingMean = mean(SPECIES.map((s) => s[1]));
const wingStd = std(SPECIES.map((s) => s[1]));
const beakMean = mean(SPECIES.map((s) => s[2]));
const beakStd = std(SPECIES.map((s) => s[2]));
const points = SPECIES.map((s) => [(s[1] - wingMean) / wingStd, (s[2] - beakMean) / beakStd]);
const euclidean = (a, b) => Math.hypot(a[0] - b[0], a[1] - b[1]);

// linkage rows in scipy format: [idA, idB, distance, mergedSize]
const linkage = [];
let clusters = points.map((_, i) => ({ id: i, members: [i] }));
let nextId = n;
while (clusters.length > 1) {
  let best = { i: 0, j: 1, d: Infinity };
  for (let i = 0; i < clusters.length; i += 1) {
    for (let j = i + 1; j < clusters.length; j += 1) {
      let total = 0;
      let count = 0;
      for (const a of clusters[i].members) {
        for (const b of clusters[j].members) {
          total += euclidean(points[a], points[b]);
          count += 1;
        }
      }
      const d = total / count;
      if (d < best.d) best = { i, j, d };
    }
  }
  const a = clusters[best.i];
  const b = clusters[best.j];
  const merged = { id: nextId, members: a.members.concat(b.members) };
  linkage.push([a.id, b.id, best.d, merged.members.length]);
  nextId += 1;
  clusters = clusters.filter((_, idx) => idx !== best.i && idx !== best.j).concat(merged);
}

// --- Tree structure: parent links, merge distance, family purity per node -------------
const parent = new Map();
const mergeDistance = new Map();
const children = new Map();
const family = new Map();
SPECIES.forEach((s, leafId) => family.set(leafId, s[3]));
linkage.forEach((row, i) => {
  const nodeId = n + i;
  const [a, b, d] = row;
  parent.set(a, nodeId);
  parent.set(b, nodeId);
  mergeDistance.set(nodeId, d);
  children.set(nodeId, [a, b]);
  const fa = family.get(a);
  const fb = family.get(b);
  family.set(nodeId, fa === fb ? fa : null);
});
const rootId = n + linkage.length - 1;
const maxDistance = mergeDistance.get(rootId);

// --- Leaf ordering (in-order traversal) drives angular position -----------------------
const leafOrder = [];
const collectLeaves = (nodeId) => {
  if (nodeId < n) {
    leafOrder.push(nodeId);
    return;
  }
  const [a, b] = children.get(nodeId);
  collectLeaves(a);
  collectLeaves(b);
};
collectLeaves(rootId);

// --- Radial layout: leaves on the circumference, root at the center -------------------
const angle = new Map();
const radius = new Map();
leafOrder.forEach((leafId, i) => {
  angle.set(leafId, (2 * Math.PI * i) / n);
  radius.set(leafId, 1);
});
linkage.forEach((row, i) => {
  const nodeId = n + i;
  const [a, b, d] = row;
  angle.set(nodeId, (angle.get(a) + angle.get(b)) / 2);
  radius.set(nodeId, (maxDistance - d) / maxDistance);
});

const nodeAngleRad = (nodeId) => angle.get(nodeId) - Math.PI / 2;
const toXY = (nodeId) => {
  const r = radius.get(nodeId);
  const a = nodeAngleRad(nodeId);
  return { x: r * Math.cos(a), y: r * Math.sin(a) };
};

// --- Branches: an arc at the parent's radius plus a radial segment out to the child.
// Straight point-to-point connectors can visually cross unrelated branches once a
// subtree spans a wide angle; the arc+radial "elbow" (the classic circular-dendrogram
// convention) never does, because each segment stays either at a fixed radius or a
// fixed angle. Colored while a subtree stays within one family, gray once families merge.
const arcPoints = (r, angleFrom, angleTo) => {
  const steps = Math.max(6, Math.ceil((Math.abs(angleTo - angleFrom) * 180) / Math.PI / 2));
  const pts = [];
  for (let s = 0; s <= steps; s += 1) {
    const a = angleFrom + ((angleTo - angleFrom) * s) / steps;
    pts.push({ x: r * Math.cos(a), y: r * Math.sin(a) });
  }
  return pts;
};
const edgeColor = (childId) => {
  const f = family.get(childId);
  return f === null || f === undefined ? t.inkSoft : FAMILY_COLORS[f];
};
const branchSeries = [];
const totalNodes = 2 * n - 1;
for (let nodeId = 0; nodeId < totalNodes; nodeId += 1) {
  if (nodeId === rootId) continue;
  const parentId = parent.get(nodeId);
  const parentR = radius.get(parentId);
  const arc = arcPoints(parentR, nodeAngleRad(parentId), nodeAngleRad(nodeId));
  const childXY = toXY(nodeId);
  const pure = family.get(nodeId) !== null && family.get(nodeId) !== undefined;
  branchSeries.push({
    type: "line",
    data: [...arc, childXY],
    color: edgeColor(nodeId),
    lineWidth: pure ? 2.5 : 1.5,
    marker: { enabled: false },
    enableMouseTracking: false,
    showInLegend: false,
  });
}

// --- Leaves: one scatter series per family so the legend reads as cluster identity ----
const leafSeriesByFamily = FAMILY_NAMES.map((fname, fi) => ({
  type: "scatter",
  name: fname,
  color: FAMILY_COLORS[fi],
  marker: { radius: 5, symbol: "circle", lineWidth: 1, lineColor: t.pageBg },
  tooltip: { pointFormat: "<b>{point.name}</b>" },
  data: [],
}));
SPECIES.forEach((s, leafId) => {
  const [name, , , fi] = s;
  const { x, y } = toXY(leafId);
  const a = nodeAngleRad(leafId);
  const leftHalf = Math.cos(a) < 0;
  const deg = (a * 180) / Math.PI;
  leafSeriesByFamily[fi].data.push({
    x,
    y,
    name,
    dataLabels: {
      enabled: true,
      format: "{point.name}",
      rotation: leftHalf ? deg + 180 : deg,
      align: leftHalf ? "right" : "left",
      x: leftHalf ? -10 : 10,
      y: 0,
      style: { color: t.ink, fontSize: "13px", fontWeight: "400", textOutline: "none" },
    },
  });
});

// --- Root marker --------------------------------------------------------------------
const rootPoint = toXY(rootId);
const rootSeries = {
  type: "scatter",
  name: "Root",
  data: [rootPoint],
  color: t.ink,
  marker: { radius: 6, symbol: "circle" },
  enableMouseTracking: false,
  showInLegend: false,
};

// --- Chart ----------------------------------------------------------------------------
Highcharts.chart("container", {
  chart: {
    type: "scatter",
    backgroundColor: "transparent",
    animation: false,
    margin: [150, 100, 50, 100],
    style: { fontFamily: "inherit" },
  },
  credits: { enabled: false },
  colors: t.palette,
  title: {
    text: "dendrogram-radial · javascript · highcharts · anyplot.ai",
    style: { color: t.ink, fontSize: "22px", fontWeight: "600" },
  },
  subtitle: {
    text: "Bird species clustered by wingspan and beak length (UPGMA linkage)",
    style: { color: t.inkSoft, fontSize: "14px" },
  },
  xAxis: { min: -1.4, max: 1.4, startOnTick: false, endOnTick: false, visible: false },
  yAxis: { min: -1.4, max: 1.4, startOnTick: false, endOnTick: false, visible: false, title: null },
  legend: {
    itemStyle: { color: t.inkSoft, fontSize: "14px" },
    itemHoverStyle: { color: t.ink },
  },
  tooltip: { backgroundColor: t.elevatedBg, style: { color: t.ink } },
  // allowOverlap: with 24 radiating labels, Highcharts' default overlap suppression
  // silently drops labels whose axis-aligned bounding box touches a neighbor's — even
  // though the rotated glyphs themselves diverge outward and rarely actually collide.
  // Every leaf must keep its label visible.
  plotOptions: { series: { animation: false, dataLabels: { allowOverlap: true } } },
  series: [...branchSeries, rootSeries, ...leafSeriesByFamily],
});
Runnable source as JSON, for any HTTP client: https://api.anyplot.ai/specs/dendrogram-radial/highcharts/code. Any spec id and library id listed in llms-full.txt fit the same URL shape; every URL below is complete and callable.
{
  "spec_id": "dendrogram-radial",
  "language": "javascript",
  "library": "highcharts",
  "page": "https://anyplot.ai/dendrogram-radial/javascript/highcharts",
  "hub": "https://anyplot.ai/dendrogram-radial",
  "code_json": "https://api.anyplot.ai/specs/dendrogram-radial/highcharts/code",
  "spec_json": "https://api.anyplot.ai/specs/dendrogram-radial",
  "render_light_png": "https://storage.googleapis.com/anyplot-images/plots/dendrogram-radial/javascript/highcharts/plot-light.png",
  "render_dark_png": "https://storage.googleapis.com/anyplot-images/plots/dendrogram-radial/javascript/highcharts/plot-dark.png",
  "interactive_light_html": "https://storage.googleapis.com/anyplot-images/plots/dendrogram-radial/javascript/highcharts/plot-light.html",
  "interactive_dark_html": "https://storage.googleapis.com/anyplot-images/plots/dendrogram-radial/javascript/highcharts/plot-dark.html",
  "quality_score": 83.0,
  "license": "MIT",
  "guide": "https://anyplot.ai/llms.txt"
}
Part of Radial Dendrogram on anyplot.ai.