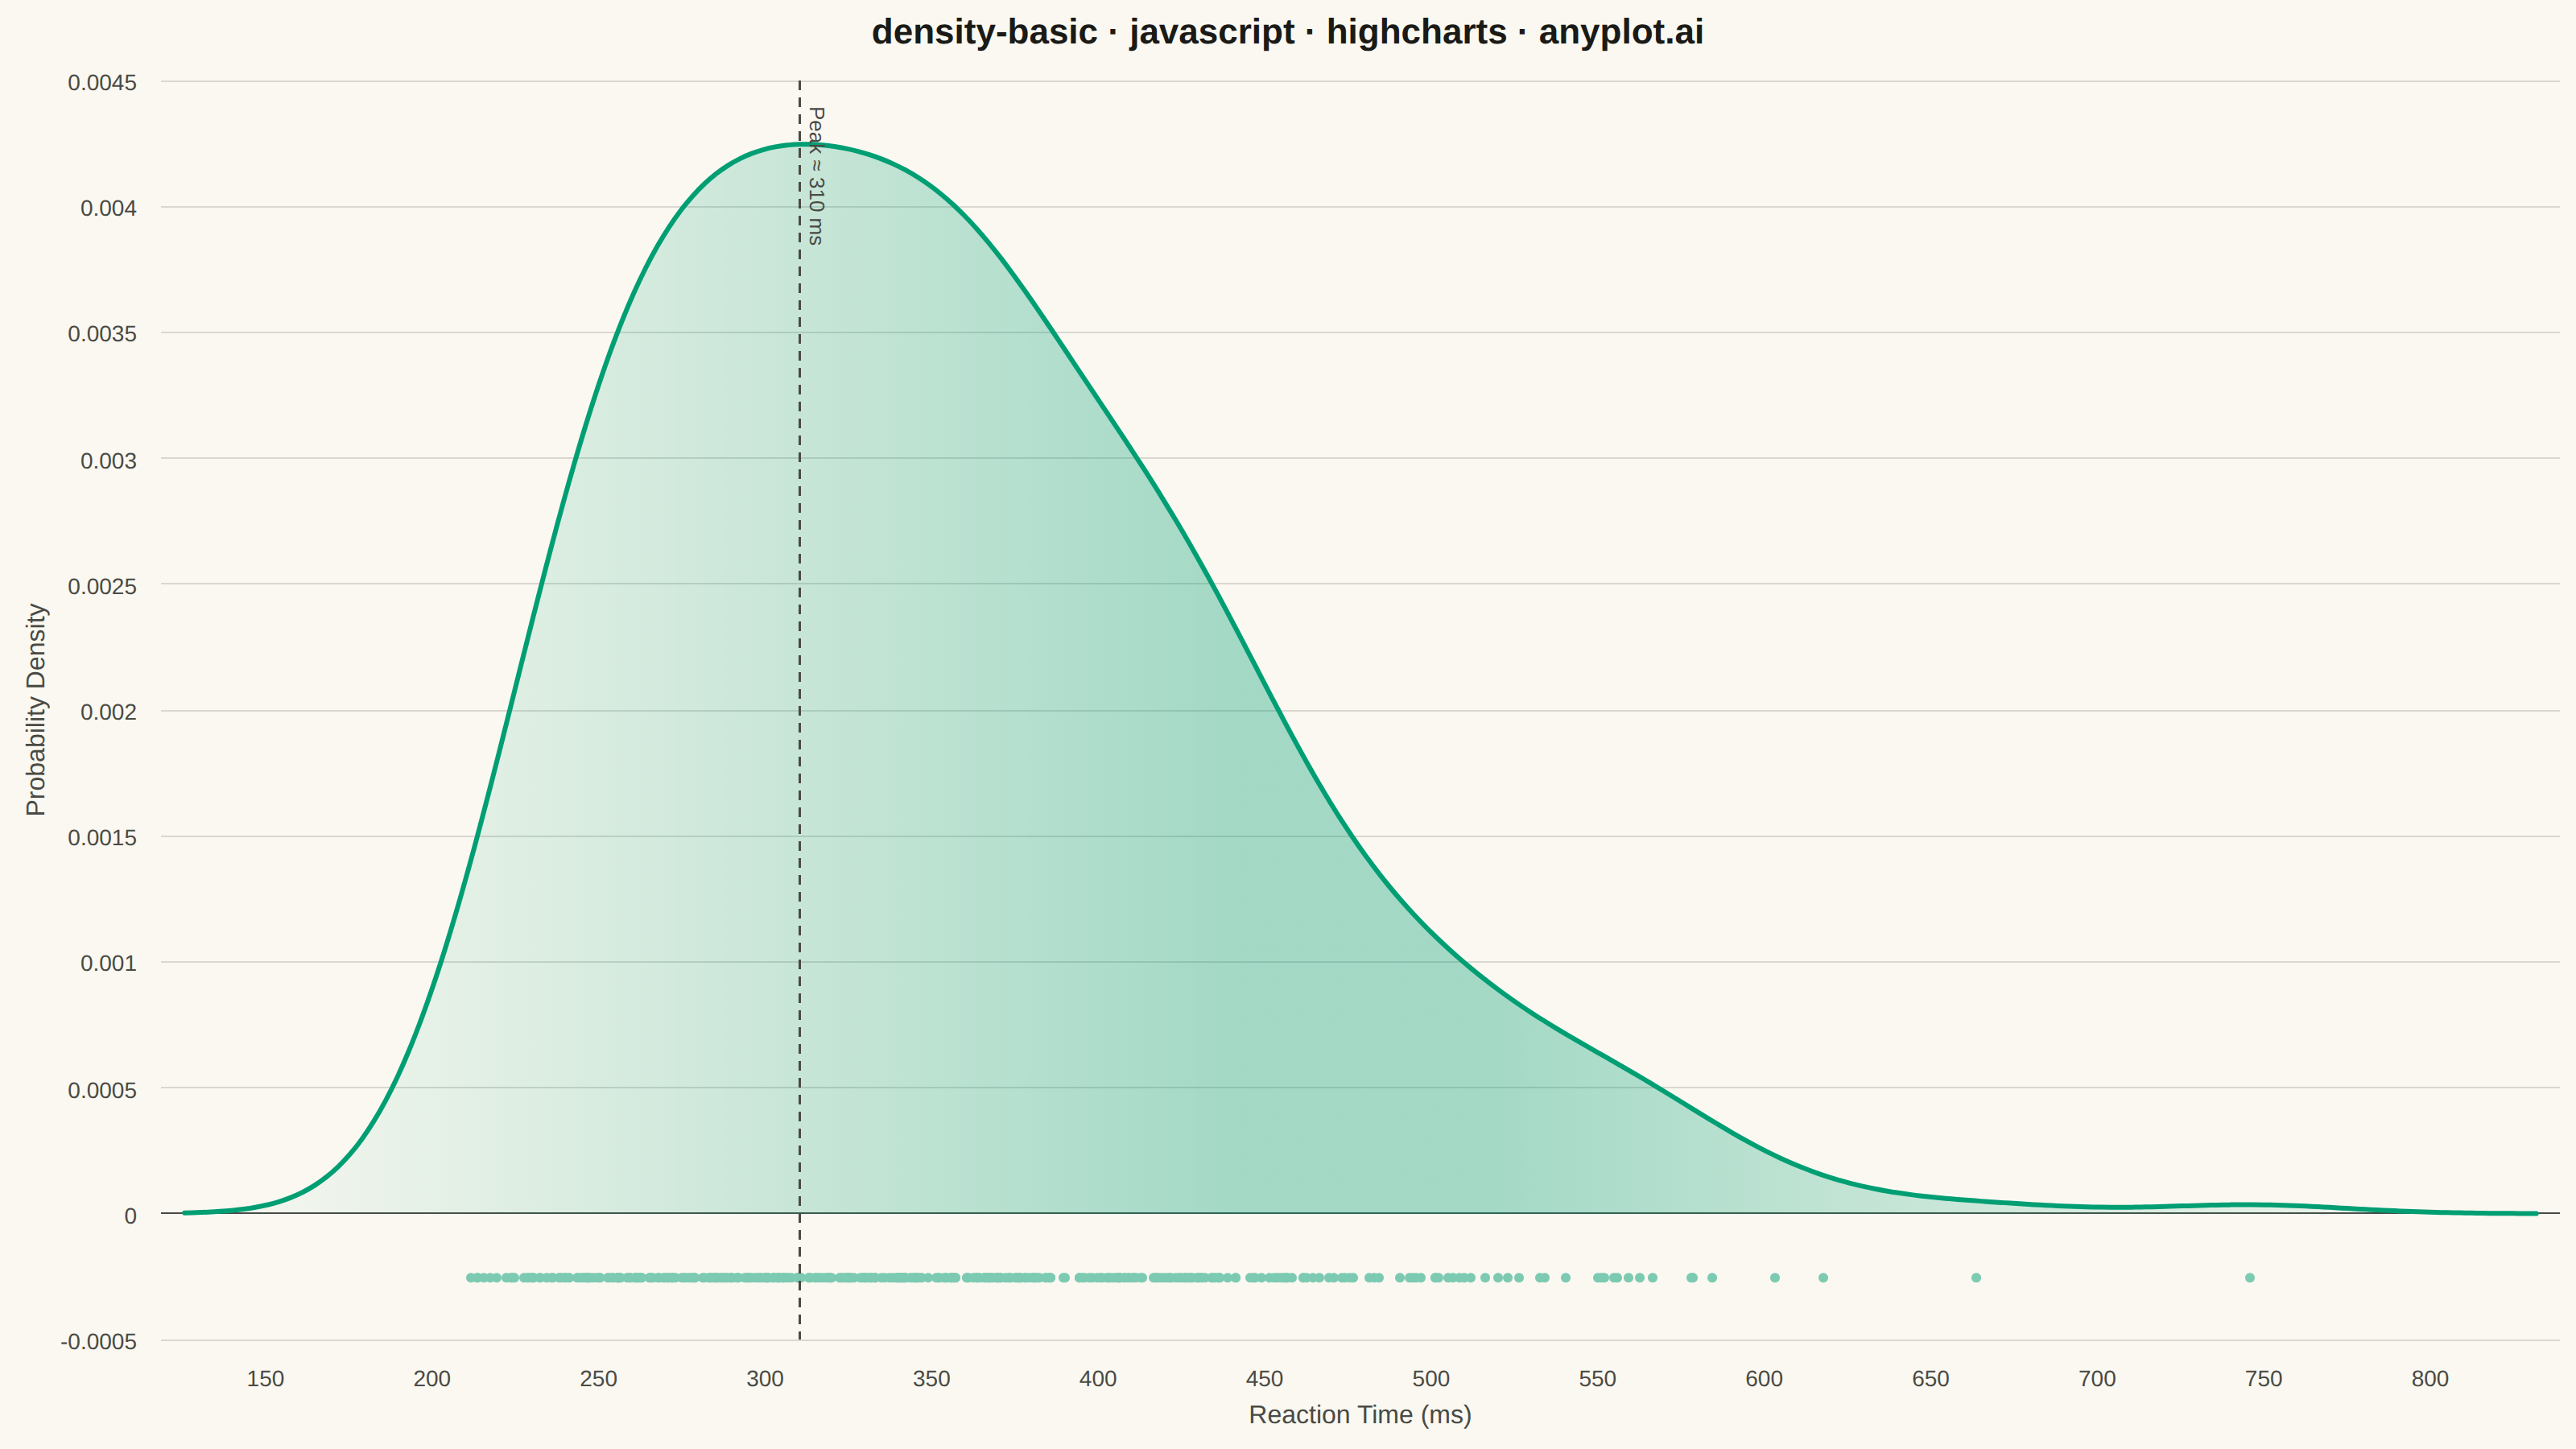
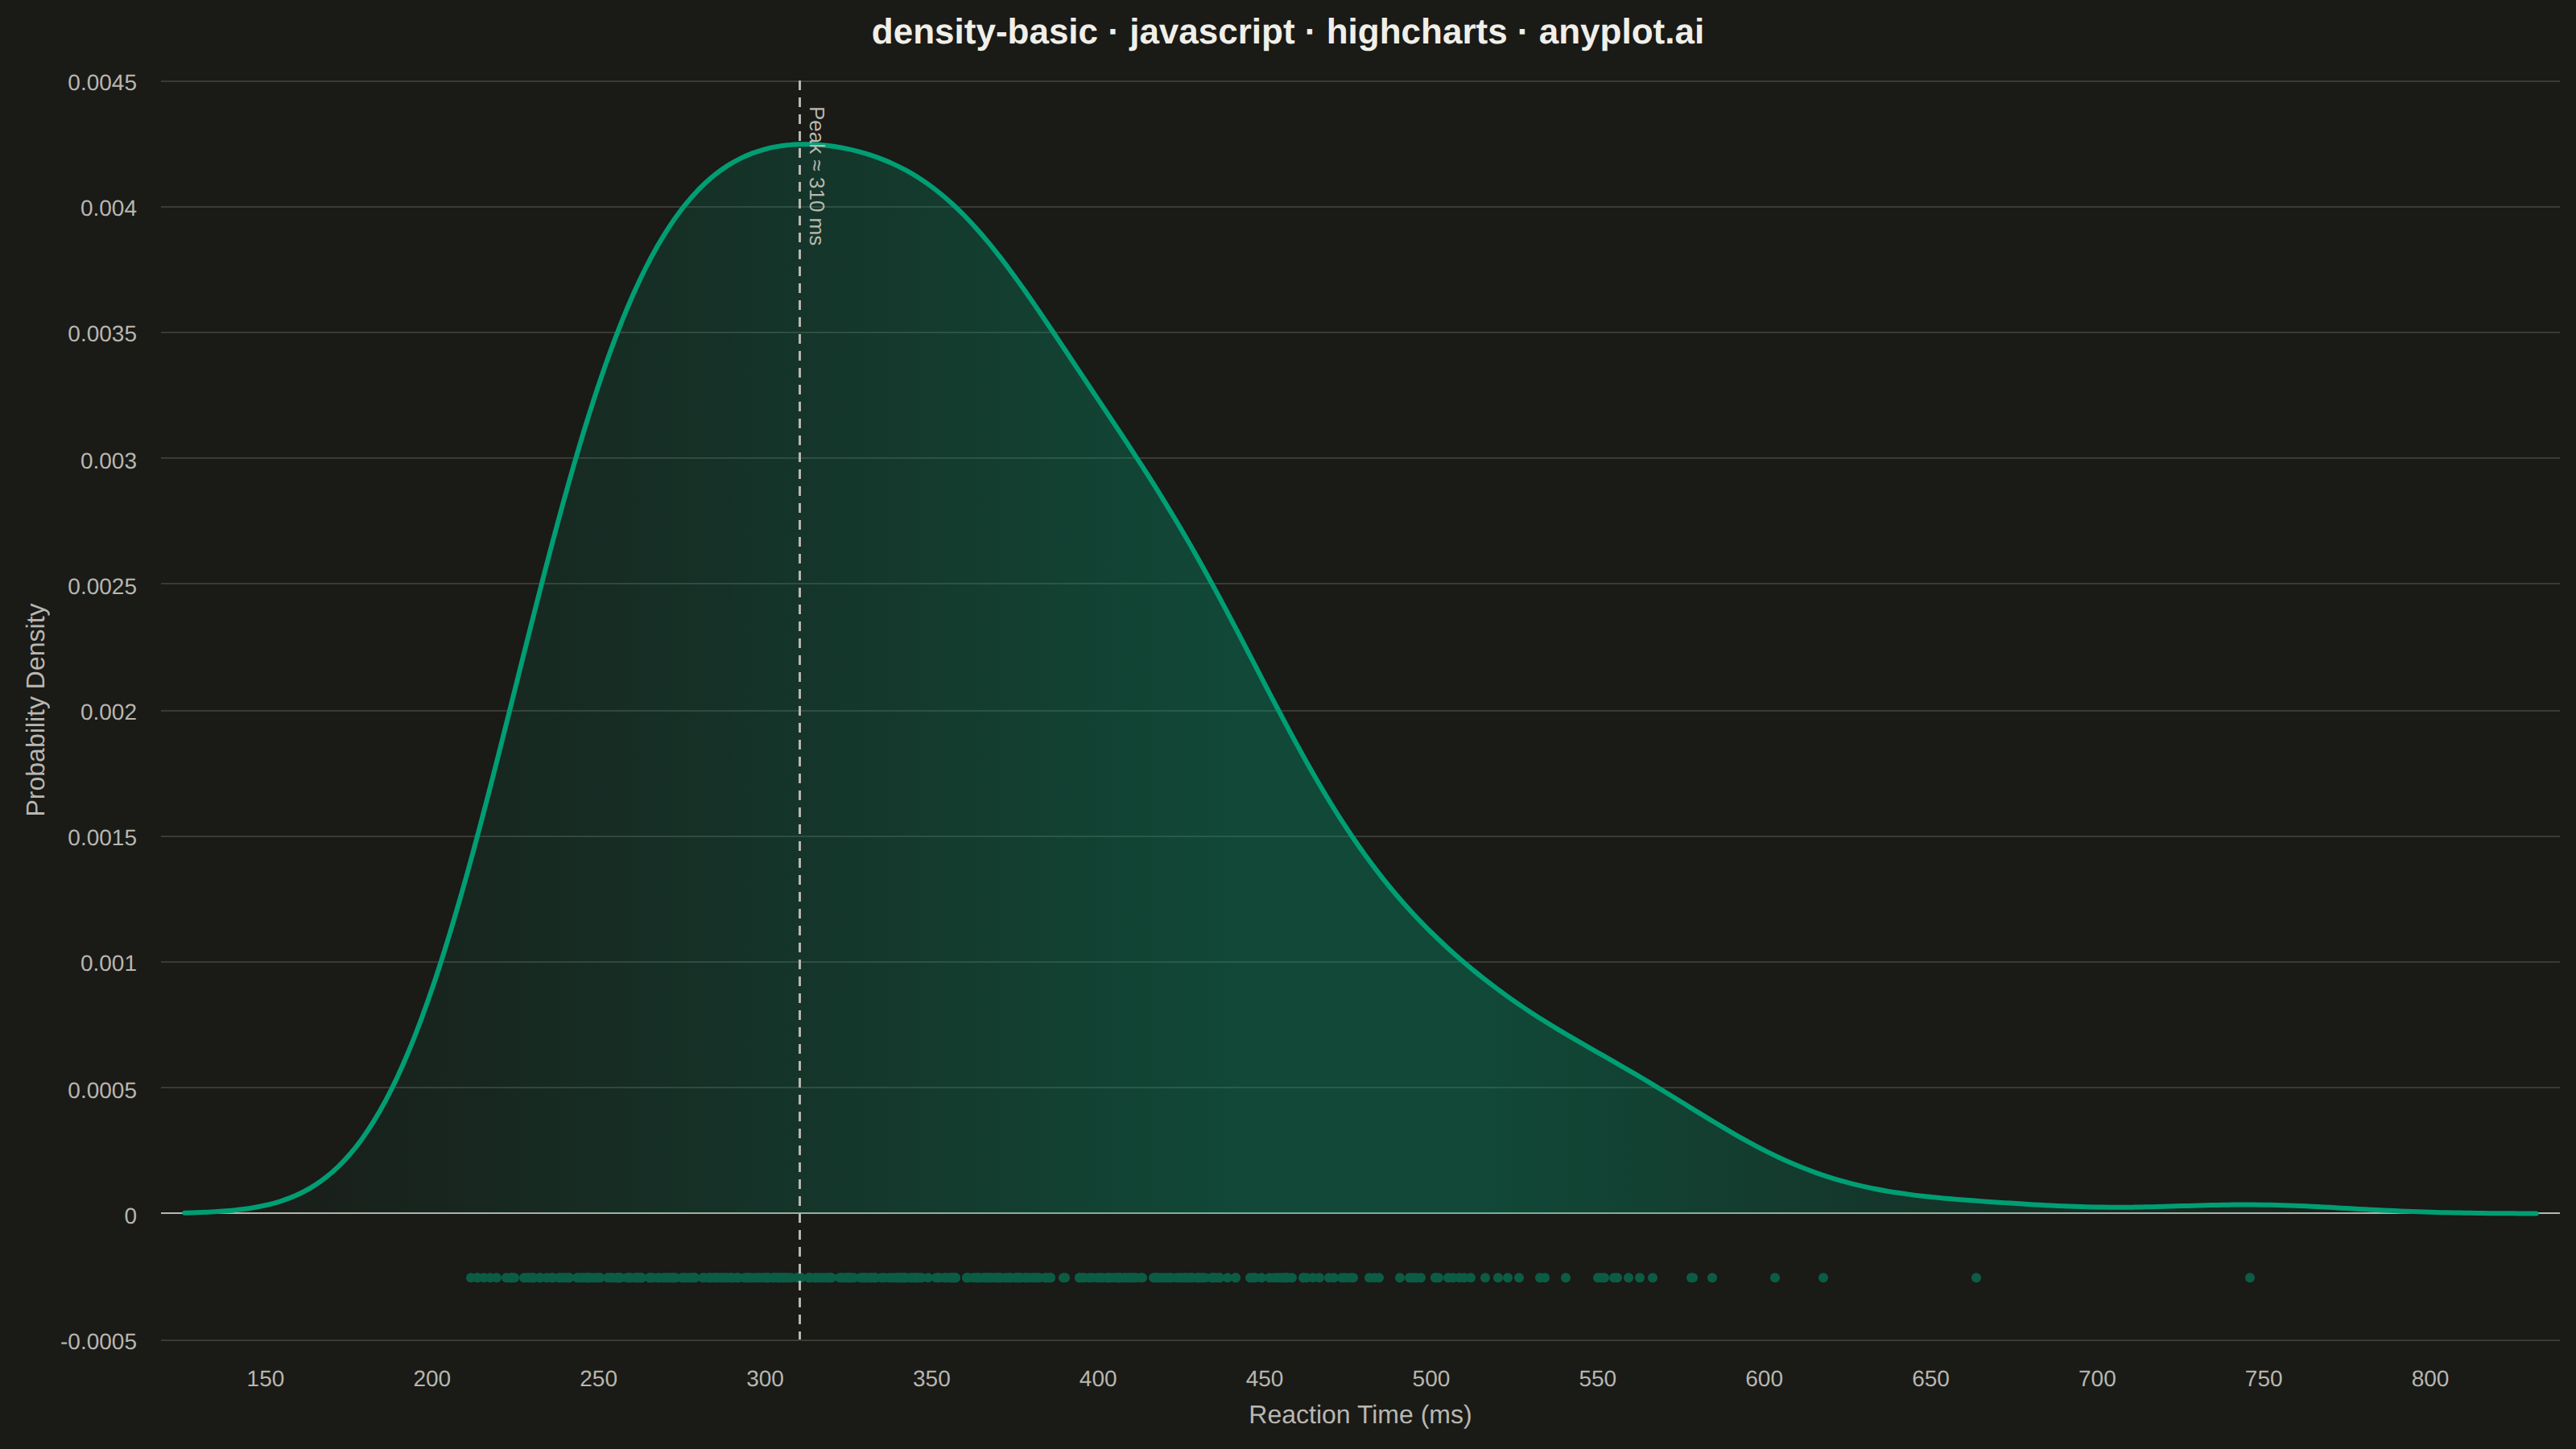
A density plot (also known as Kernel Density Estimation or KDE plot) visualizes the distribution of a continuous variable by smoothing the data into a continuous probability density curve. Unlike histograms which use discrete bins, density plots provide a smooth representation of the underlying distribution, making it easier to identify patterns such as skewness, modality, and overall shape.
Preview render from the Highcharts implementation.