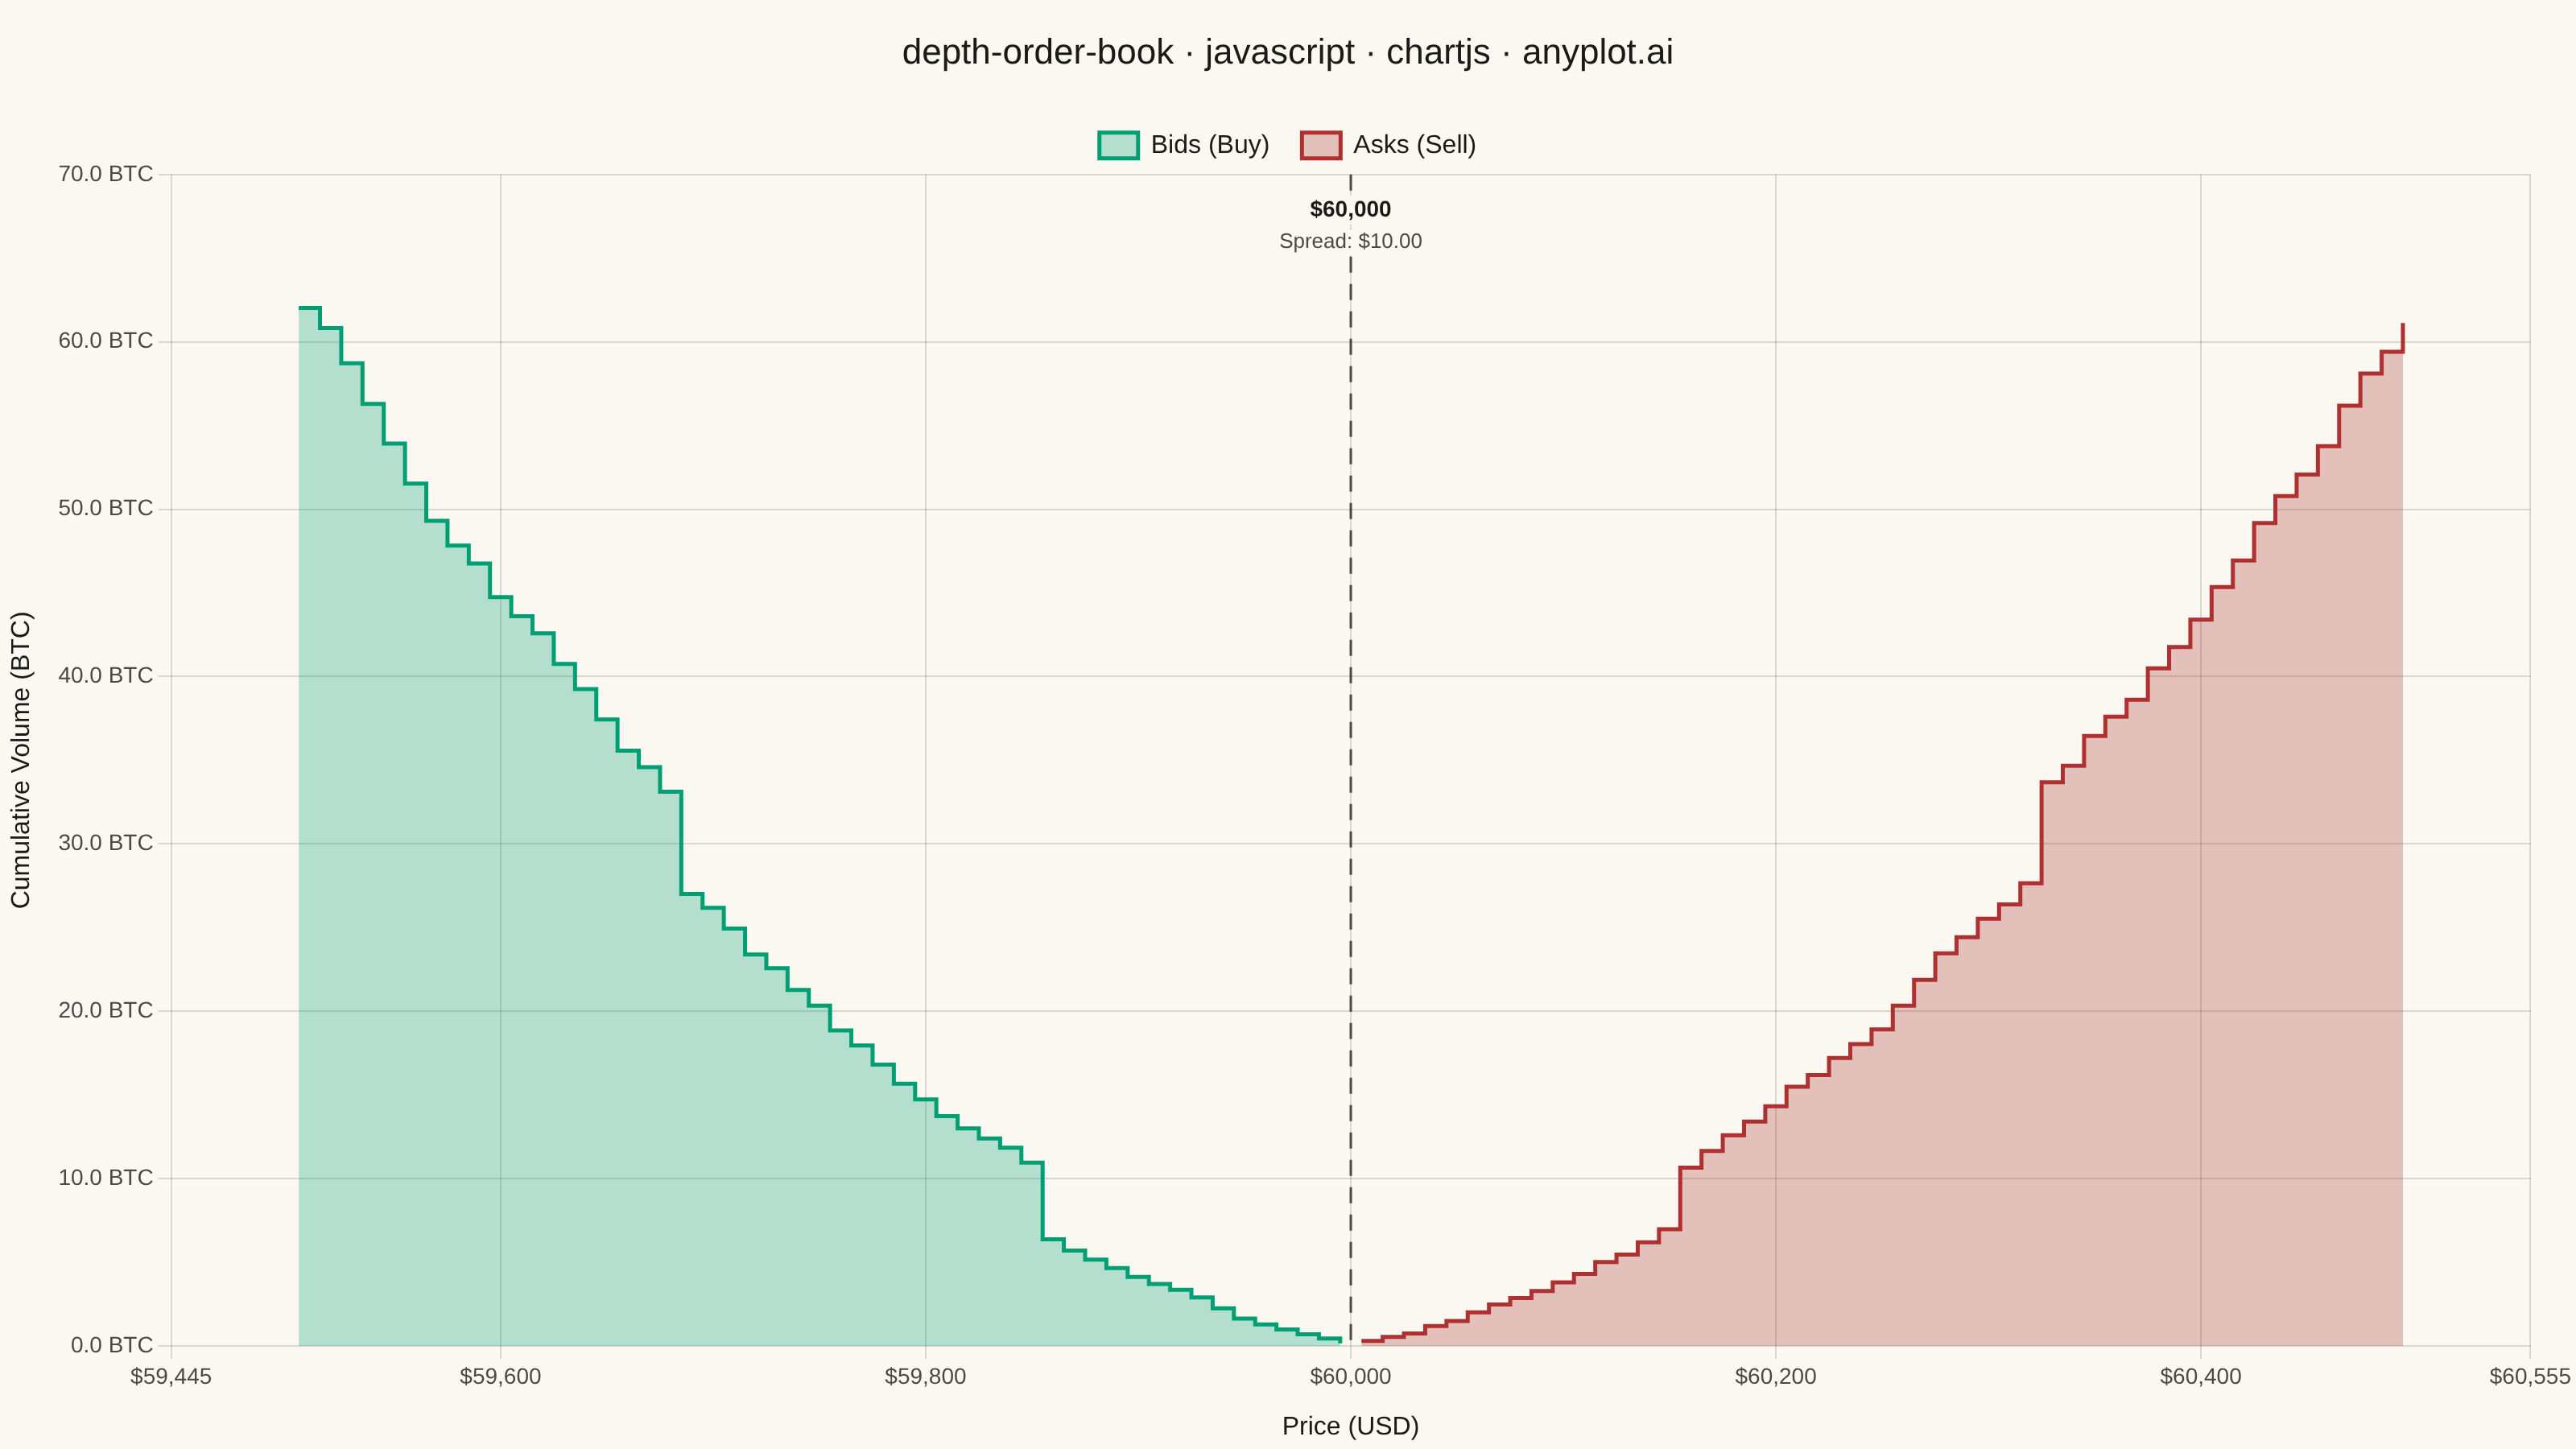
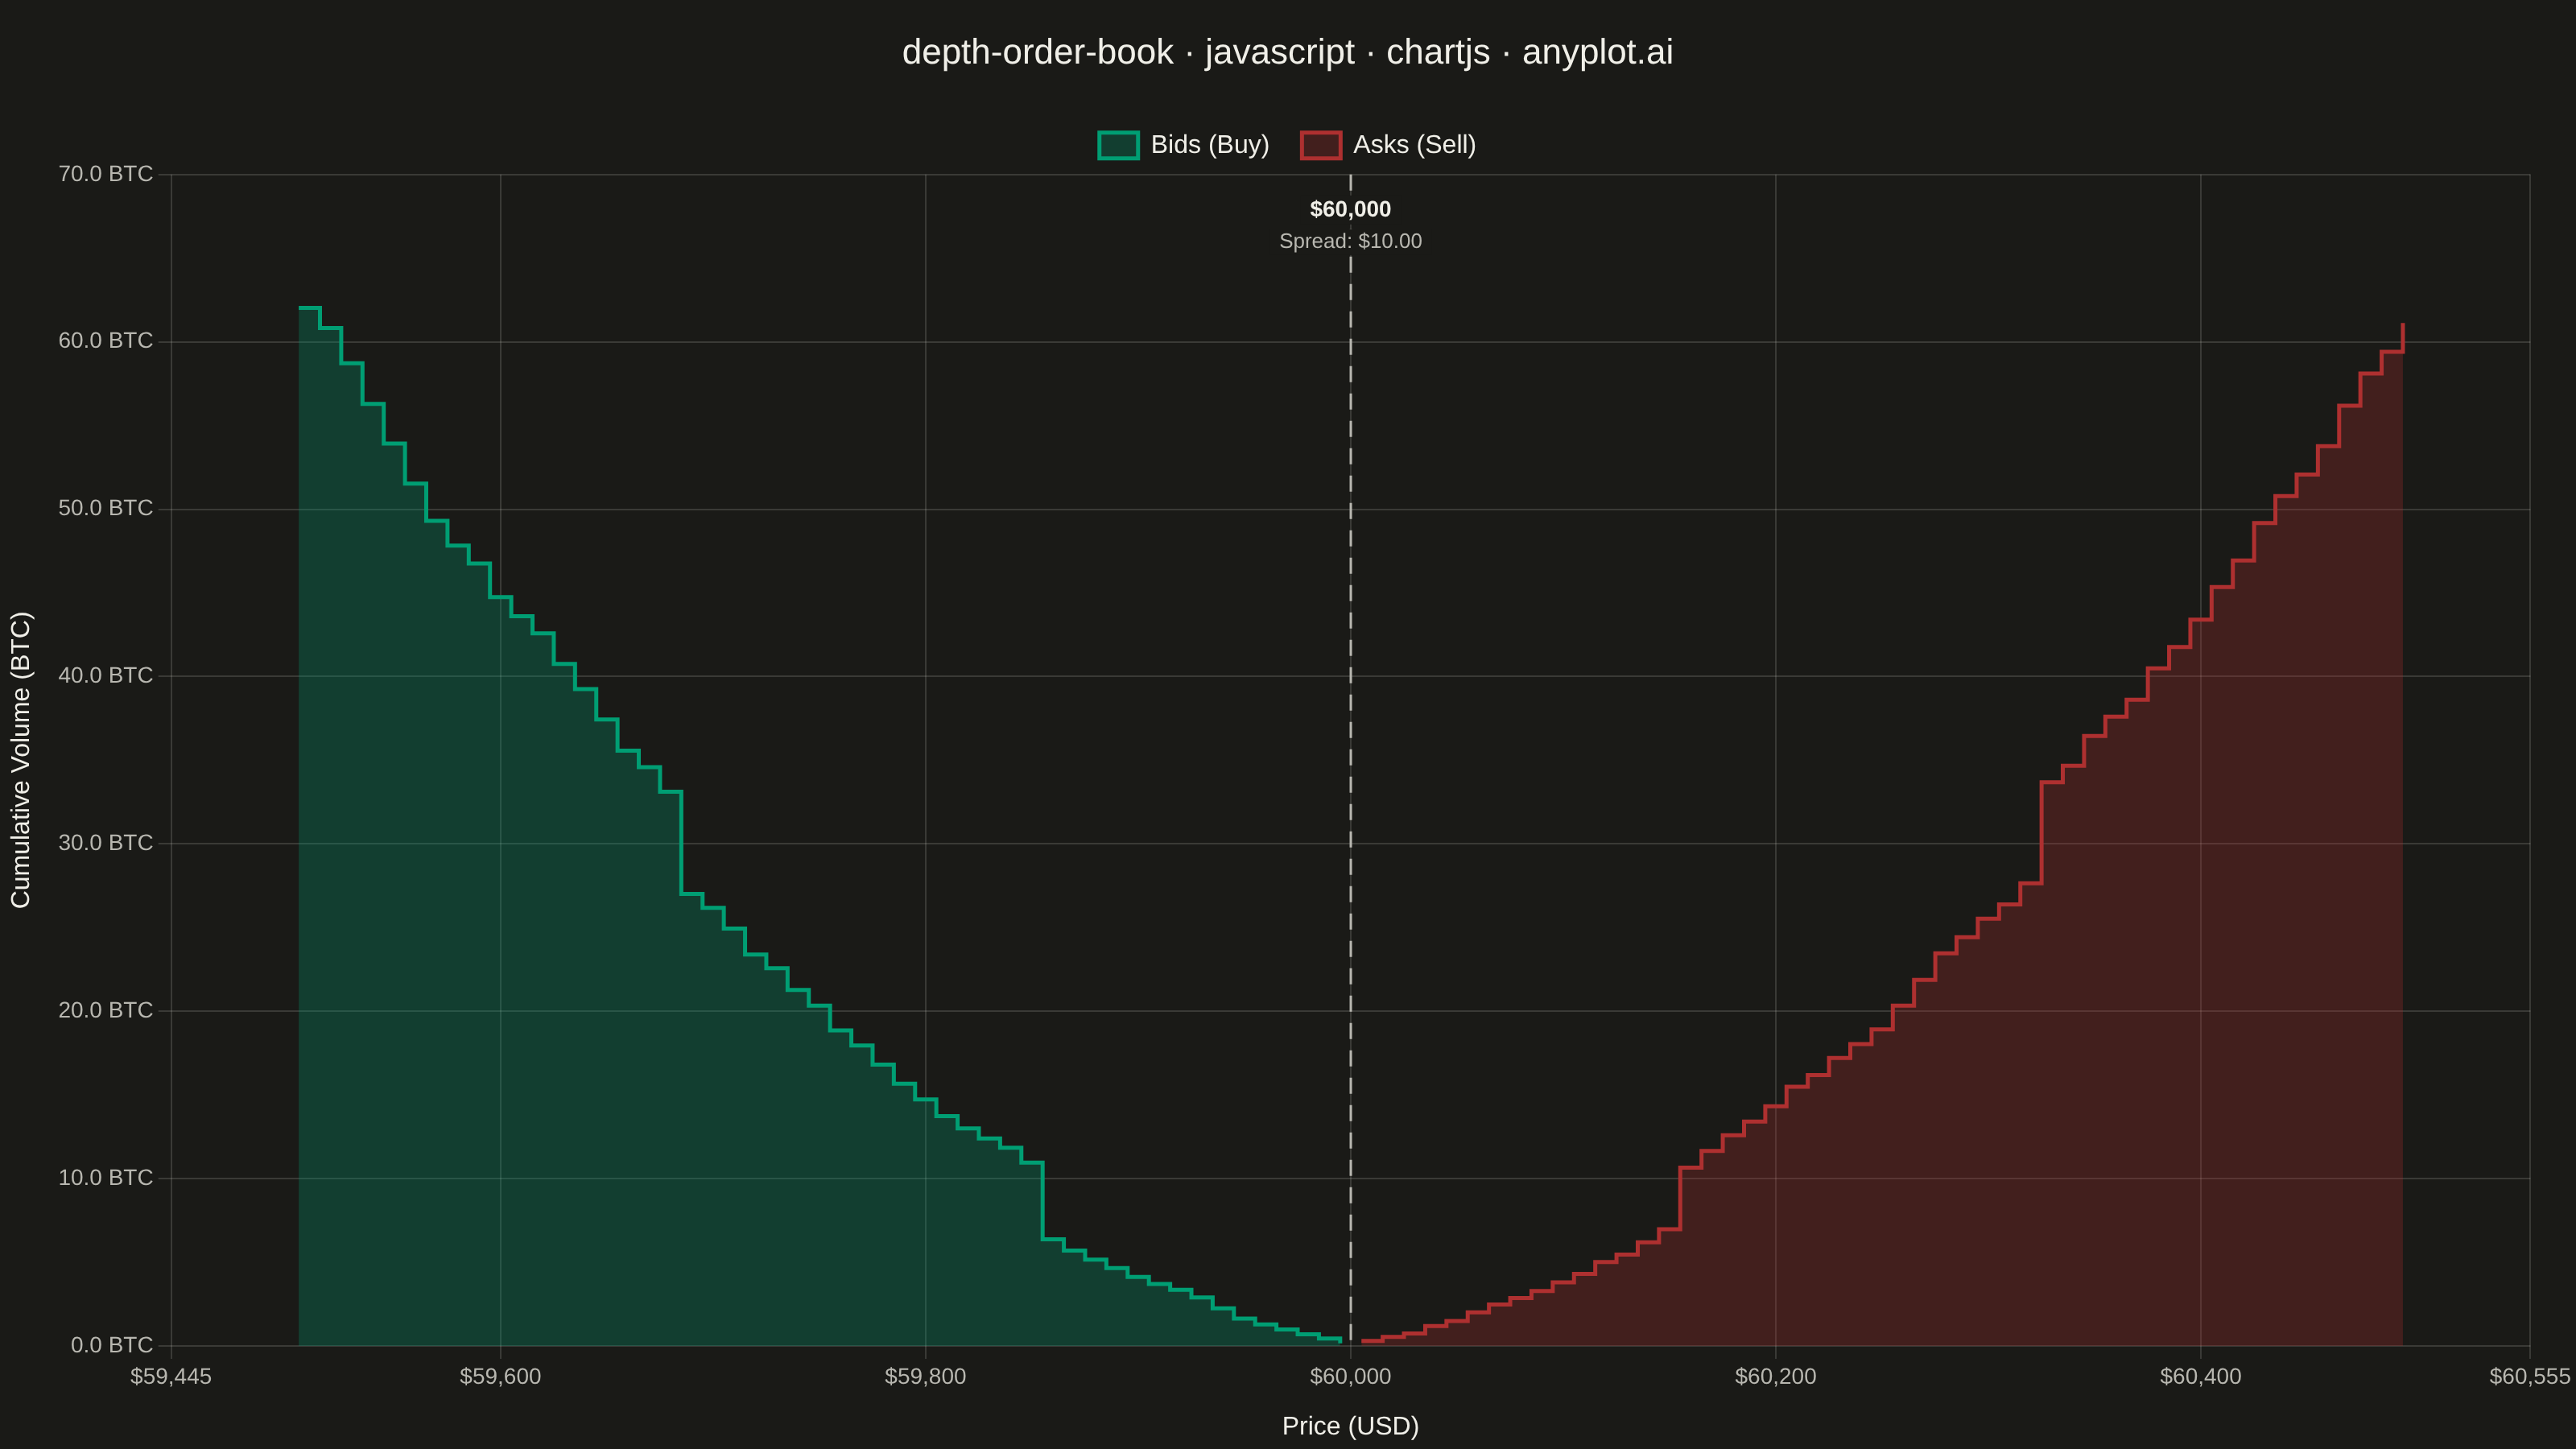
A market depth chart visualizes a snapshot of an exchange order book as two cumulative step areas around the mid price. Cumulative bid volume rises as a green step area to the left of the mid price (summing buy orders from the best bid downward), while cumulative ask volume rises as a red step area to the right (summing sell orders from the best ask upward). The bid-ask spread appears as a gap at the center, with price on the x-axis and cumulative quantity on the y-axis. This is the iconic chart found in nearly every trading and crypto exchange UI, revealing liquidity, support/resistance walls, and the imbalance between buying and selling pressure.
// anyplot.ai
// depth-order-book: Order Book Depth Chart
// Library: chartjs 4.4.7 | JavaScript 22.22.3
// Quality: 89/100 | Created: 2026-06-15

const t = window.ANYPLOT_TOKENS;

// --- Data: BTC/USD order book snapshot, mid price $60,000 ---
const MID = 60000;
const BEST_BID = 59995;
const BEST_ASK = 60005;
const SPREAD = BEST_ASK - BEST_BID;
const TICK = 10;
const N = 50;

// XORshift LCG — deterministic, seed 42
let _s = 42;
function rng() {
  _s ^= _s << 13;
  _s ^= _s >> 17;
  _s ^= _s << 5;
  return (_s >>> 0) / 4294967296;
}

// Bid levels: index 0 = worst bid (lowest price), index N-1 = best bid
const bidLevels = [];
for (let i = 0; i < N; i++) {
  const price = BEST_BID - (N - 1 - i) * TICK;
  const distTicks = N - 1 - i; // 0 at best bid, N-1 at worst
  const base = 0.25 + (distTicks / N) * 1.8;
  const wall = (distTicks === 15 || distTicks === 32) ? 3.0 + rng() * 2.0 : 0;
  bidLevels.push({ price, qty: base * (0.6 + rng() * 0.7) + wall });
}

// Cumulate bid from best bid outward (index N-1 → 0)
let cBid = 0;
for (let i = N - 1; i >= 0; i--) {
  cBid += bidLevels[i].qty;
  bidLevels[i].cum = cBid;
}
const bidData = bidLevels.map(l => ({ x: l.price, y: l.cum }));

// Ask levels: index 0 = best ask (lowest price), index N-1 = worst ask
const askLevels = [];
for (let i = 0; i < N; i++) {
  const price = BEST_ASK + i * TICK;
  const distTicks = i; // 0 at best ask, N-1 at worst
  const base = 0.25 + (distTicks / N) * 1.8;
  const wall = (distTicks === 15 || distTicks === 32) ? 3.0 + rng() * 2.0 : 0;
  askLevels.push({ price, qty: base * (0.6 + rng() * 0.7) + wall });
}

// Cumulate ask from best ask outward (index 0 → N-1)
let cAsk = 0;
for (let i = 0; i < N; i++) {
  cAsk += askLevels[i].qty;
  askLevels[i].cum = cAsk;
}
const askData = askLevels.map(l => ({ x: l.price, y: l.cum }));

// --- Mount ---
const canvas = document.createElement('canvas');
document.getElementById('container').appendChild(canvas);

// --- Plugins ---
const bgPlugin = {
  id: 'bgPlugin',
  beforeDraw(chart) {
    chart.ctx.save();
    chart.ctx.fillStyle = t.pageBg;
    chart.ctx.fillRect(0, 0, chart.width, chart.height);
    chart.ctx.restore();
  },
};

const midLinePlugin = {
  id: 'midLinePlugin',
  afterDatasetsDraw(chart) {
    const { ctx, scales: { x: xs, y: ys } } = chart;
    const mx = xs.getPixelForValue(MID);

    // Dashed vertical line at mid price
    ctx.save();
    ctx.setLineDash([10, 7]);
    ctx.strokeStyle = t.inkSoft;
    ctx.lineWidth = 1.5;
    ctx.beginPath();
    ctx.moveTo(mx, ys.top);
    ctx.lineTo(mx, ys.bottom);
    ctx.stroke();
    ctx.restore();

    // Mid price and spread labels with opaque background to avoid line intersection
    ctx.save();
    ctx.textAlign = 'center';
    ctx.textBaseline = 'middle';
    const pad = 6;

    ctx.font = 'bold 14px sans-serif';
    const midText = '$' + MID.toLocaleString();
    const midW = ctx.measureText(midText).width;
    const midY = ys.top + 22;
    ctx.fillStyle = t.pageBg;
    ctx.fillRect(mx - midW / 2 - pad, midY - 9, midW + pad * 2, 18);
    ctx.fillStyle = t.ink;
    ctx.fillText(midText, mx, midY);

    ctx.font = '13px sans-serif';
    const spreadText = 'Spread: $' + SPREAD.toFixed(2);
    const spreadW = ctx.measureText(spreadText).width;
    const spreadY = ys.top + 42;
    ctx.fillStyle = t.pageBg;
    ctx.fillRect(mx - spreadW / 2 - pad, spreadY - 8, spreadW + pad * 2, 16);
    ctx.fillStyle = t.inkSoft;
    ctx.fillText(spreadText, mx, spreadY);

    ctx.restore();
  },
};

// --- Chart ---
new Chart(canvas, {
  type: 'line',
  data: {
    datasets: [
      {
        label: 'Bids (Buy)',
        data: bidData,
        stepped: 'before',
        fill: 'origin',
        backgroundColor: 'rgba(0,158,115,0.28)',
        borderColor: t.palette[0],
        borderWidth: 2.5,
        pointRadius: 0,
      },
      {
        label: 'Asks (Sell)',
        data: askData,
        stepped: 'before',
        fill: 'origin',
        backgroundColor: 'rgba(174,48,48,0.28)',
        borderColor: t.palette[4],
        borderWidth: 2.5,
        pointRadius: 0,
      },
    ],
  },
  options: {
    responsive: true,
    maintainAspectRatio: false,
    animation: false,
    parsing: false,
    plugins: {
      title: {
        display: true,
        text: 'depth-order-book · javascript · chartjs · anyplot.ai',
        color: t.ink,
        font: { size: 22, weight: '500' },
        padding: { top: 20, bottom: 16 },
      },
      legend: {
        labels: {
          color: t.ink,
          font: { size: 16 },
          boxWidth: 24,
          padding: 20,
        },
      },
    },
    scales: {
      x: {
        type: 'linear',
        border: { display: false },
        min: BEST_BID - (N - 1) * TICK - 60,
        max: BEST_ASK + (N - 1) * TICK + 60,
        ticks: {
          color: t.inkSoft,
          font: { size: 14 },
          callback: v => '$' + Number(v).toLocaleString(),
          maxTicksLimit: 11,
        },
        grid: { color: t.grid },
        title: {
          display: true,
          text: 'Price (USD)',
          color: t.ink,
          font: { size: 16 },
          padding: { top: 10 },
        },
      },
      y: {
        beginAtZero: true,
        border: { display: false },
        ticks: {
          color: t.inkSoft,
          font: { size: 14 },
          callback: v => Number(v).toFixed(1) + ' BTC',
          maxTicksLimit: 8,
        },
        grid: { color: t.grid },
        title: {
          display: true,
          text: 'Cumulative Volume (BTC)',
          color: t.ink,
          font: { size: 16 },
          padding: { bottom: 10 },
        },
      },
    },
  },
  plugins: [bgPlugin, midLinePlugin],
});
Runnable source as JSON, for any HTTP client: https://api.anyplot.ai/specs/depth-order-book/chartjs/code. Any spec id and library id listed in llms-full.txt fit the same URL shape; every URL below is complete and callable.
{
  "spec_id": "depth-order-book",
  "language": "javascript",
  "library": "chartjs",
  "page": "https://anyplot.ai/depth-order-book/javascript/chartjs",
  "hub": "https://anyplot.ai/depth-order-book",
  "code_json": "https://api.anyplot.ai/specs/depth-order-book/chartjs/code",
  "spec_json": "https://api.anyplot.ai/specs/depth-order-book",
  "render_light_png": "https://storage.googleapis.com/anyplot-images/plots/depth-order-book/javascript/chartjs/plot-light.png",
  "render_dark_png": "https://storage.googleapis.com/anyplot-images/plots/depth-order-book/javascript/chartjs/plot-dark.png",
  "interactive_light_html": "https://storage.googleapis.com/anyplot-images/plots/depth-order-book/javascript/chartjs/plot-light.html",
  "interactive_dark_html": "https://storage.googleapis.com/anyplot-images/plots/depth-order-book/javascript/chartjs/plot-dark.html",
  "quality_score": 89.0,
  "license": "MIT",
  "guide": "https://anyplot.ai/llms.txt"
}
Part of Order Book Depth Chart on anyplot.ai.