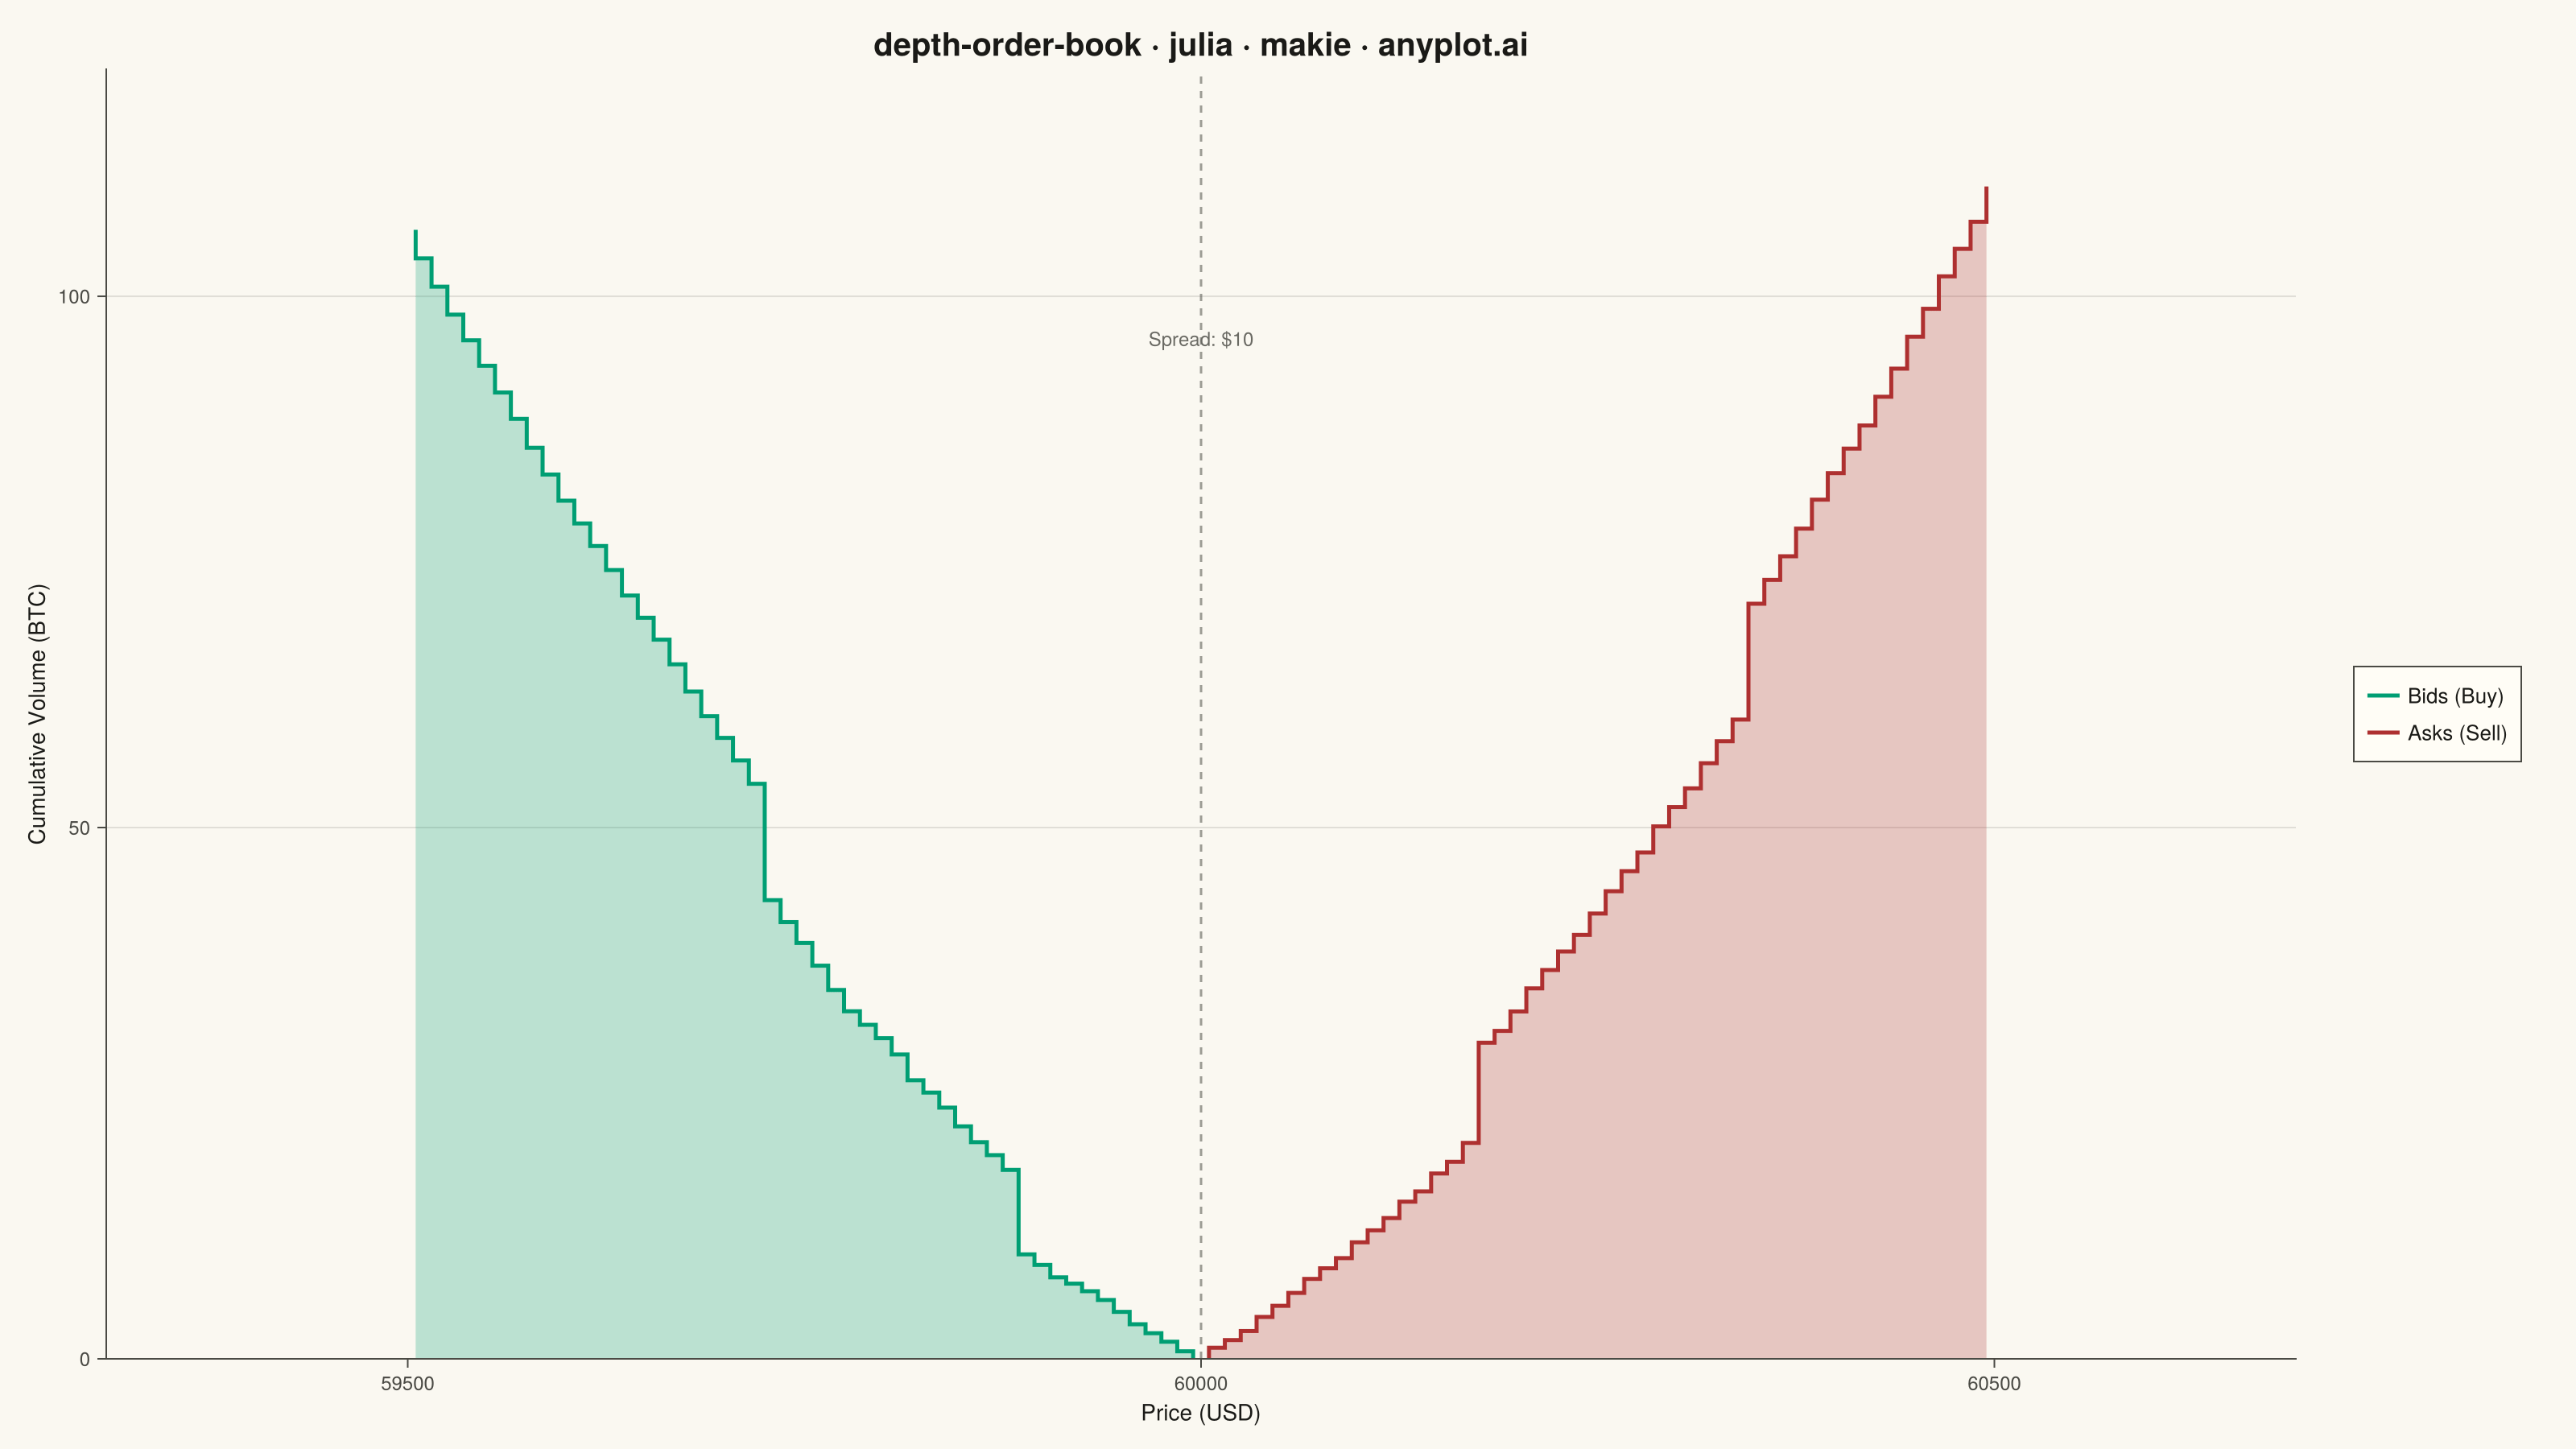
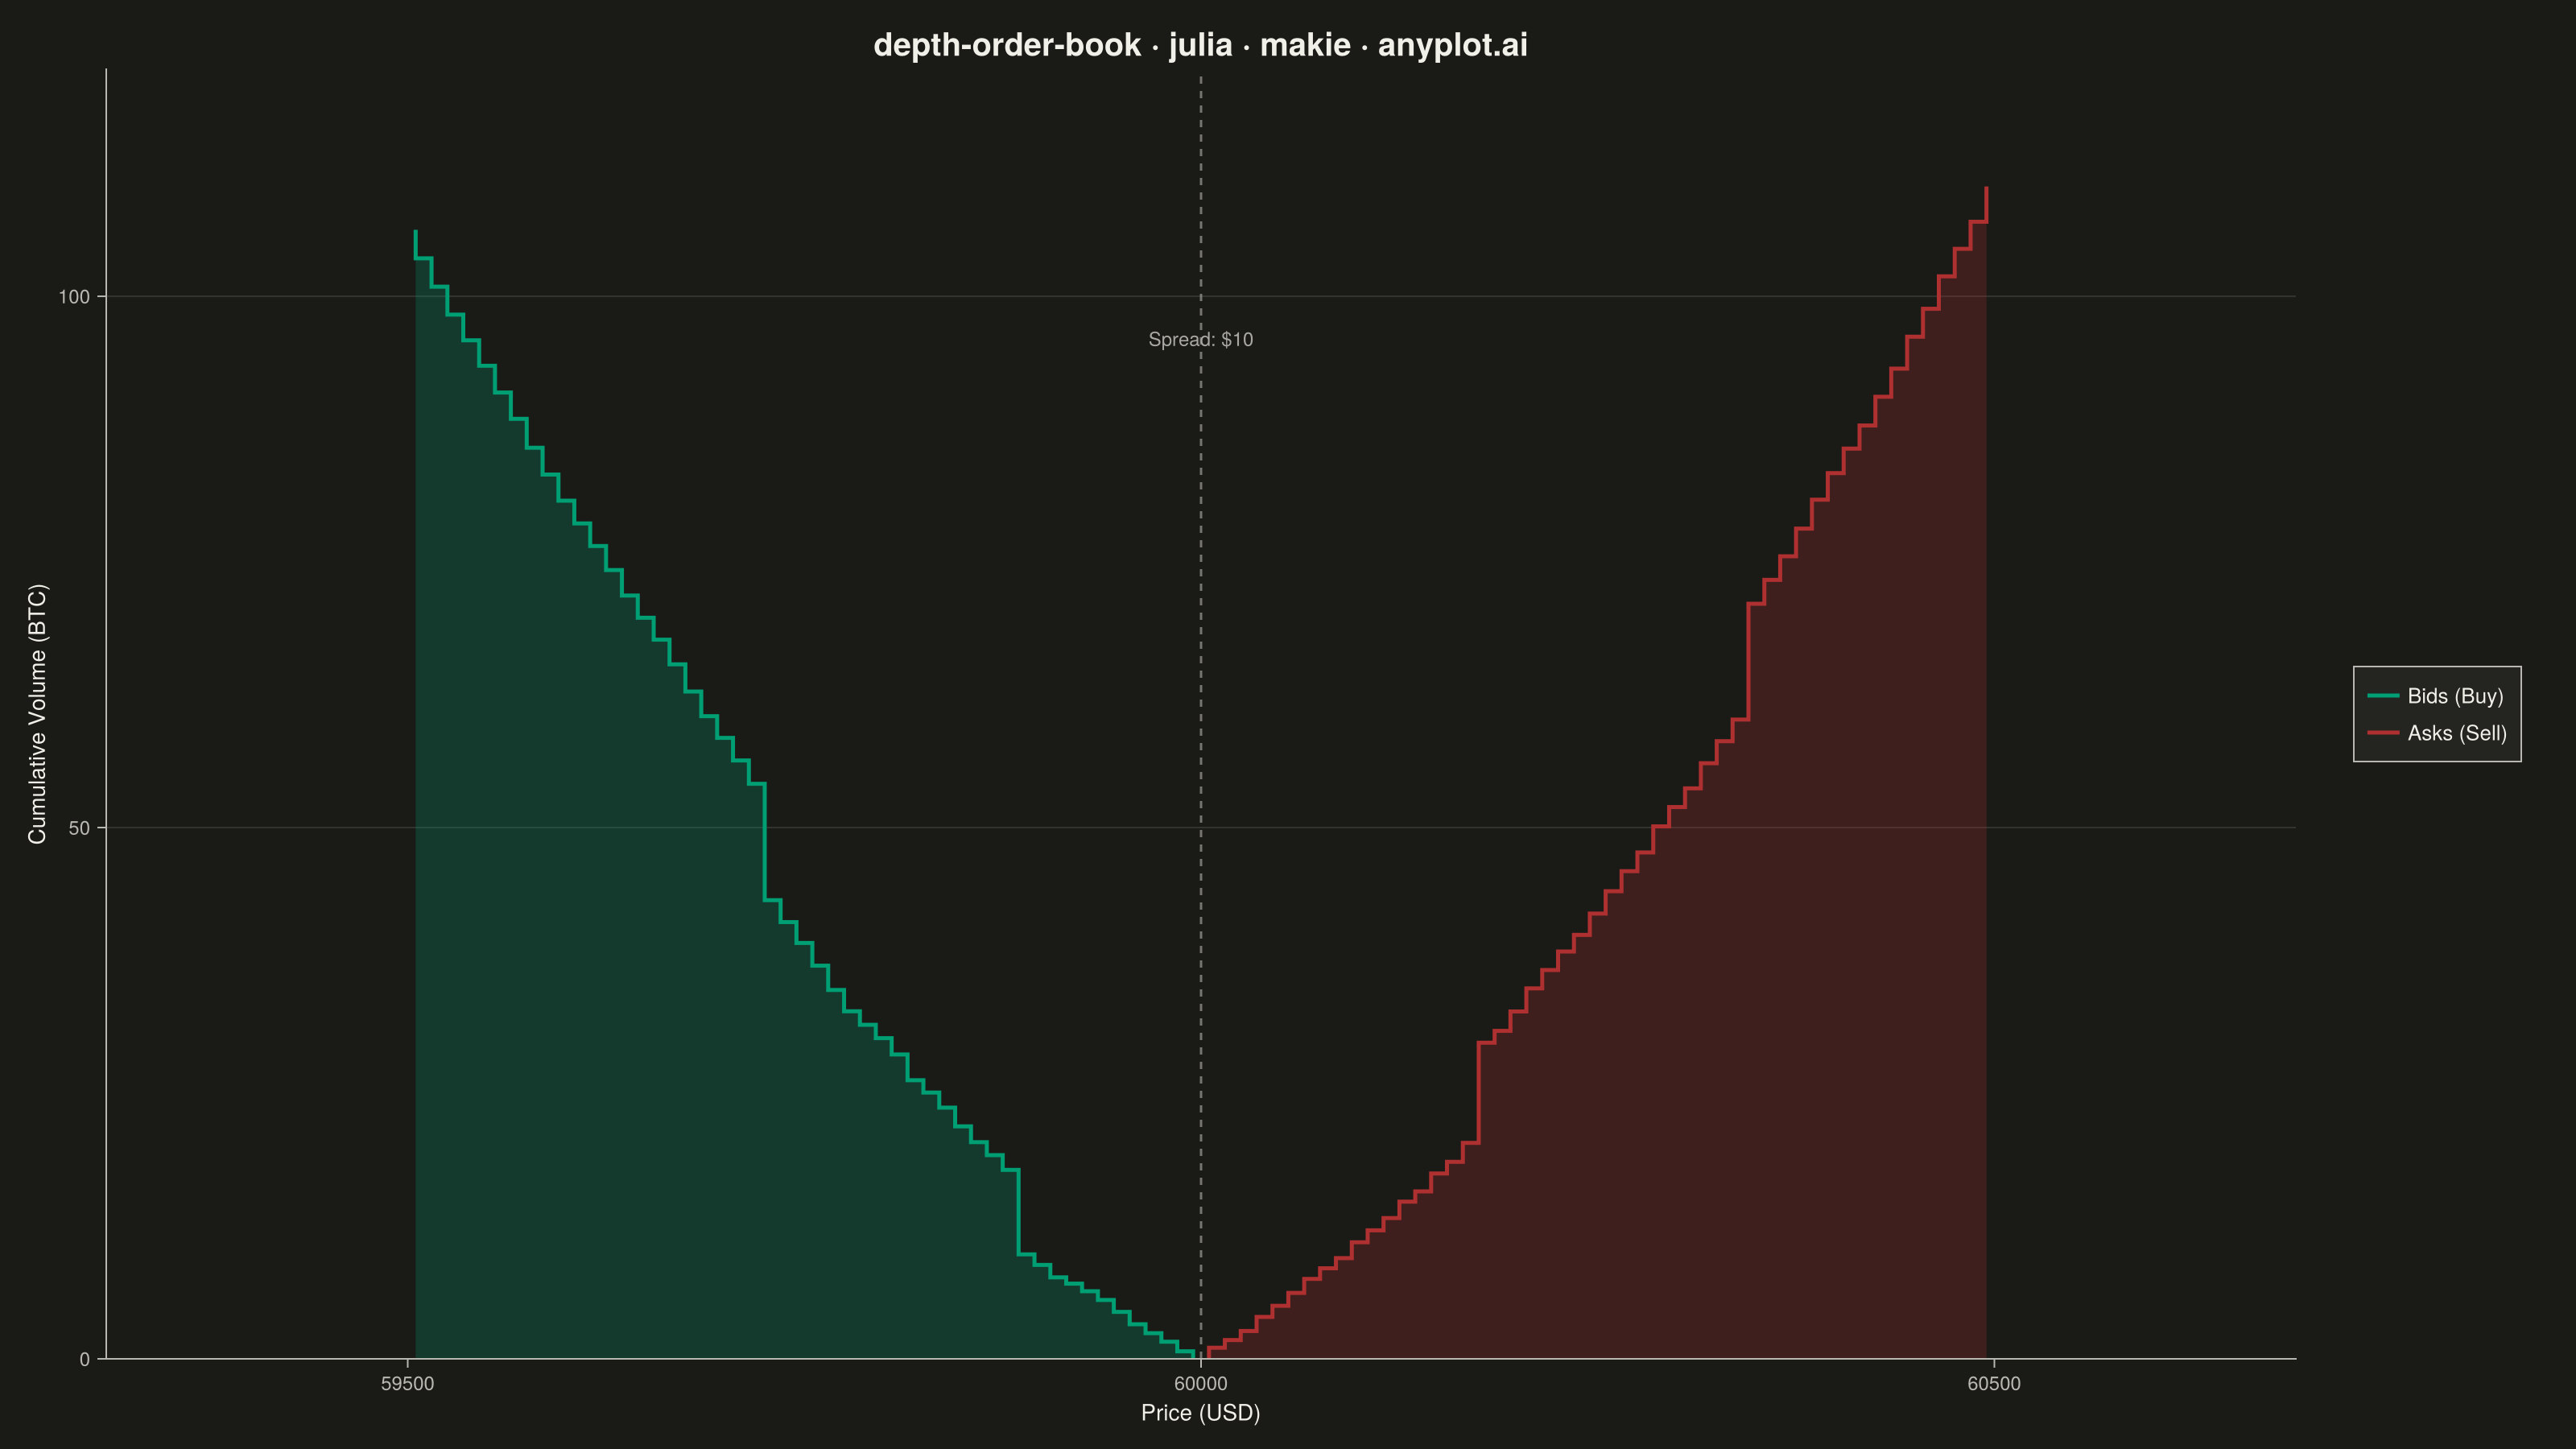
A market depth chart visualizes a snapshot of an exchange order book as two cumulative step areas around the mid price. Cumulative bid volume rises as a green step area to the left of the mid price (summing buy orders from the best bid downward), while cumulative ask volume rises as a red step area to the right (summing sell orders from the best ask upward). The bid-ask spread appears as a gap at the center, with price on the x-axis and cumulative quantity on the y-axis. This is the iconic chart found in nearly every trading and crypto exchange UI, revealing liquidity, support/resistance walls, and the imbalance between buying and selling pressure.
# anyplot.ai
# depth-order-book: Order Book Depth Chart
# Library: makie 0.22.10 | Julia 1.11.9
# Quality: 90/100 | Created: 2026-06-15

using CairoMakie
using Colors
using Random

Random.seed!(42)

# Theme tokens
const THEME       = get(ENV, "ANYPLOT_THEME", "light")
const PAGE_BG     = THEME == "light" ? colorant"#FAF8F1" : colorant"#1A1A17"
const ELEVATED_BG = THEME == "light" ? colorant"#FFFDF6" : colorant"#242420"
const INK         = THEME == "light" ? colorant"#1A1A17" : colorant"#F0EFE8"
const INK_SOFT    = THEME == "light" ? colorant"#4A4A44" : colorant"#B8B7B0"
const INK_MUTED   = THEME == "light" ? colorant"#6B6A63" : colorant"#A8A79F"

# Imprint palette — position 1 (brand green) for bids; position 5 (matte red) for asks
const BID_COLOR = colorant"#009E73"
const ASK_COLOR = colorant"#AE3030"

# Data — BTC/USD order book snapshot near $60,000
const MID_PRICE = 60_000.0
const SPREAD    = 10.0
const N_LEVELS  = 50
const TICK      = 10.0

best_bid = MID_PRICE - SPREAD / 2
best_ask = MID_PRICE + SPREAD / 2

bid_prices = [best_bid - (i - 1) * TICK for i in 1:N_LEVELS]
ask_prices = [best_ask + (i - 1) * TICK for i in 1:N_LEVELS]

# Quantities — thin near mid price, thicker away from it, with realistic variation
bid_qtys = max.(0.05, 0.8 .+ collect(0:N_LEVELS-1) .* 0.04 .+ randn(N_LEVELS) .* 0.25)
ask_qtys = max.(0.05, 0.9 .+ collect(0:N_LEVELS-1) .* 0.04 .+ randn(N_LEVELS) .* 0.25)

# Large resting limit orders acting as support / resistance walls
bid_qtys[12] += 6.5
bid_qtys[28] += 9.0
ask_qtys[18] += 7.5
ask_qtys[35] += 8.5

# Cumulative volumes from best price outward
bid_cum = cumsum(bid_qtys)
ask_cum = cumsum(ask_qtys)

# Build staircase for bids (prices descend: best → worst)
bid_xs = Float64[bid_prices[1]]
bid_ys = Float64[0.0]
for i in 1:N_LEVELS
    push!(bid_xs, bid_prices[i])
    push!(bid_ys, bid_cum[i])
    if i < N_LEVELS
        push!(bid_xs, bid_prices[i + 1])
        push!(bid_ys, bid_cum[i])
    end
end

# Build staircase for asks (prices ascend: best → worst)
ask_xs = Float64[ask_prices[1]]
ask_ys = Float64[0.0]
for i in 1:N_LEVELS
    push!(ask_xs, ask_prices[i])
    push!(ask_ys, ask_cum[i])
    if i < N_LEVELS
        push!(ask_xs, ask_prices[i + 1])
        push!(ask_ys, ask_cum[i])
    end
end

# Polygon for bid fill — close staircase back to x-axis
bid_poly = [Point2f(x, y) for (x, y) in zip(
    vcat(bid_xs, [bid_xs[end], bid_xs[1]]),
    vcat(bid_ys, [0.0, 0.0]),
)]

# Polygon for ask fill
ask_poly = [Point2f(x, y) for (x, y) in zip(
    vcat(ask_xs, [ask_xs[end], ask_xs[1]]),
    vcat(ask_ys, [0.0, 0.0]),
)]

max_cum = max(maximum(bid_cum), maximum(ask_cum))

# Figure
fig = Figure(
    size            = (1600, 900),
    fontsize        = 14,
    backgroundcolor = PAGE_BG,
)

ax = Axis(
    fig[1, 1];
    title              = "depth-order-book · julia · makie · anyplot.ai",
    titlesize          = 20,
    titlecolor         = INK,
    xlabel             = "Price (USD)",
    ylabel             = "Cumulative Volume (BTC)",
    xlabelsize         = 14,
    ylabelsize         = 14,
    xlabelcolor        = INK,
    ylabelcolor        = INK,
    xticklabelsize     = 12,
    yticklabelsize     = 12,
    xticklabelcolor    = INK_SOFT,
    yticklabelcolor    = INK_SOFT,
    xtickcolor         = INK_SOFT,
    ytickcolor         = INK_SOFT,
    backgroundcolor    = PAGE_BG,
    topspinevisible    = false,
    rightspinevisible  = false,
    leftspinecolor     = INK_SOFT,
    bottomspinecolor   = INK_SOFT,
    xgridvisible       = false,
    ygridcolor         = RGBAf(Float32(INK.r), Float32(INK.g), Float32(INK.b), 0.12f0),
    yminorgridvisible  = false,
    xminorgridvisible  = false,
)

# Semi-transparent fill areas
poly!(ax, bid_poly; color = (BID_COLOR, 0.25), strokewidth = 0)
poly!(ax, ask_poly; color = (ASK_COLOR, 0.25), strokewidth = 0)

# Staircase outlines (labeled for legend)
lines!(ax, bid_xs, bid_ys; color = BID_COLOR, linewidth = 2.5, label = "Bids (Buy)")
lines!(ax, ask_xs, ask_ys; color = ASK_COLOR, linewidth = 2.5, label = "Asks (Sell)")

# Dashed vertical line at mid price
vlines!(ax, [MID_PRICE]; color = (INK_MUTED, 0.65), linestyle = :dash, linewidth = 1.5)

# Spread annotation
text!(ax, MID_PRICE, max_cum * 0.87;
    text     = "Spread: \$$(Int(SPREAD))",
    align    = (:center, :center),
    fontsize = 12,
    color    = INK_MUTED,
)

# Legend in right column
Legend(
    fig[1, 2], ax;
    framecolor      = INK_SOFT,
    framevisible    = true,
    backgroundcolor = ELEVATED_BG,
    labelcolor      = INK,
    labelsize       = 13,
    padding         = (8f0, 8f0, 8f0, 8f0),
)
colsize!(fig.layout, 2, Fixed(140))

# Axis limits — symmetric x range around mid price
x_half = (N_LEVELS - 1) * TICK + 200.0
xlims!(ax, MID_PRICE - x_half, MID_PRICE + x_half)
ylims!(ax, 0.0, max_cum * 1.1)

save("plot-$(THEME).png", fig; px_per_unit = 2)
Runnable source as JSON, for any HTTP client: https://api.anyplot.ai/specs/depth-order-book/makie/code. Any spec id and library id listed in llms-full.txt fit the same URL shape; every URL below is complete and callable.
{
  "spec_id": "depth-order-book",
  "language": "julia",
  "library": "makie",
  "page": "https://anyplot.ai/depth-order-book/julia/makie",
  "hub": "https://anyplot.ai/depth-order-book",
  "code_json": "https://api.anyplot.ai/specs/depth-order-book/makie/code",
  "spec_json": "https://api.anyplot.ai/specs/depth-order-book",
  "render_light_png": "https://storage.googleapis.com/anyplot-images/plots/depth-order-book/julia/makie/plot-light.png",
  "render_dark_png": "https://storage.googleapis.com/anyplot-images/plots/depth-order-book/julia/makie/plot-dark.png",
  "quality_score": 90.0,
  "license": "MIT",
  "guide": "https://anyplot.ai/llms.txt"
}
Part of Order Book Depth Chart on anyplot.ai.