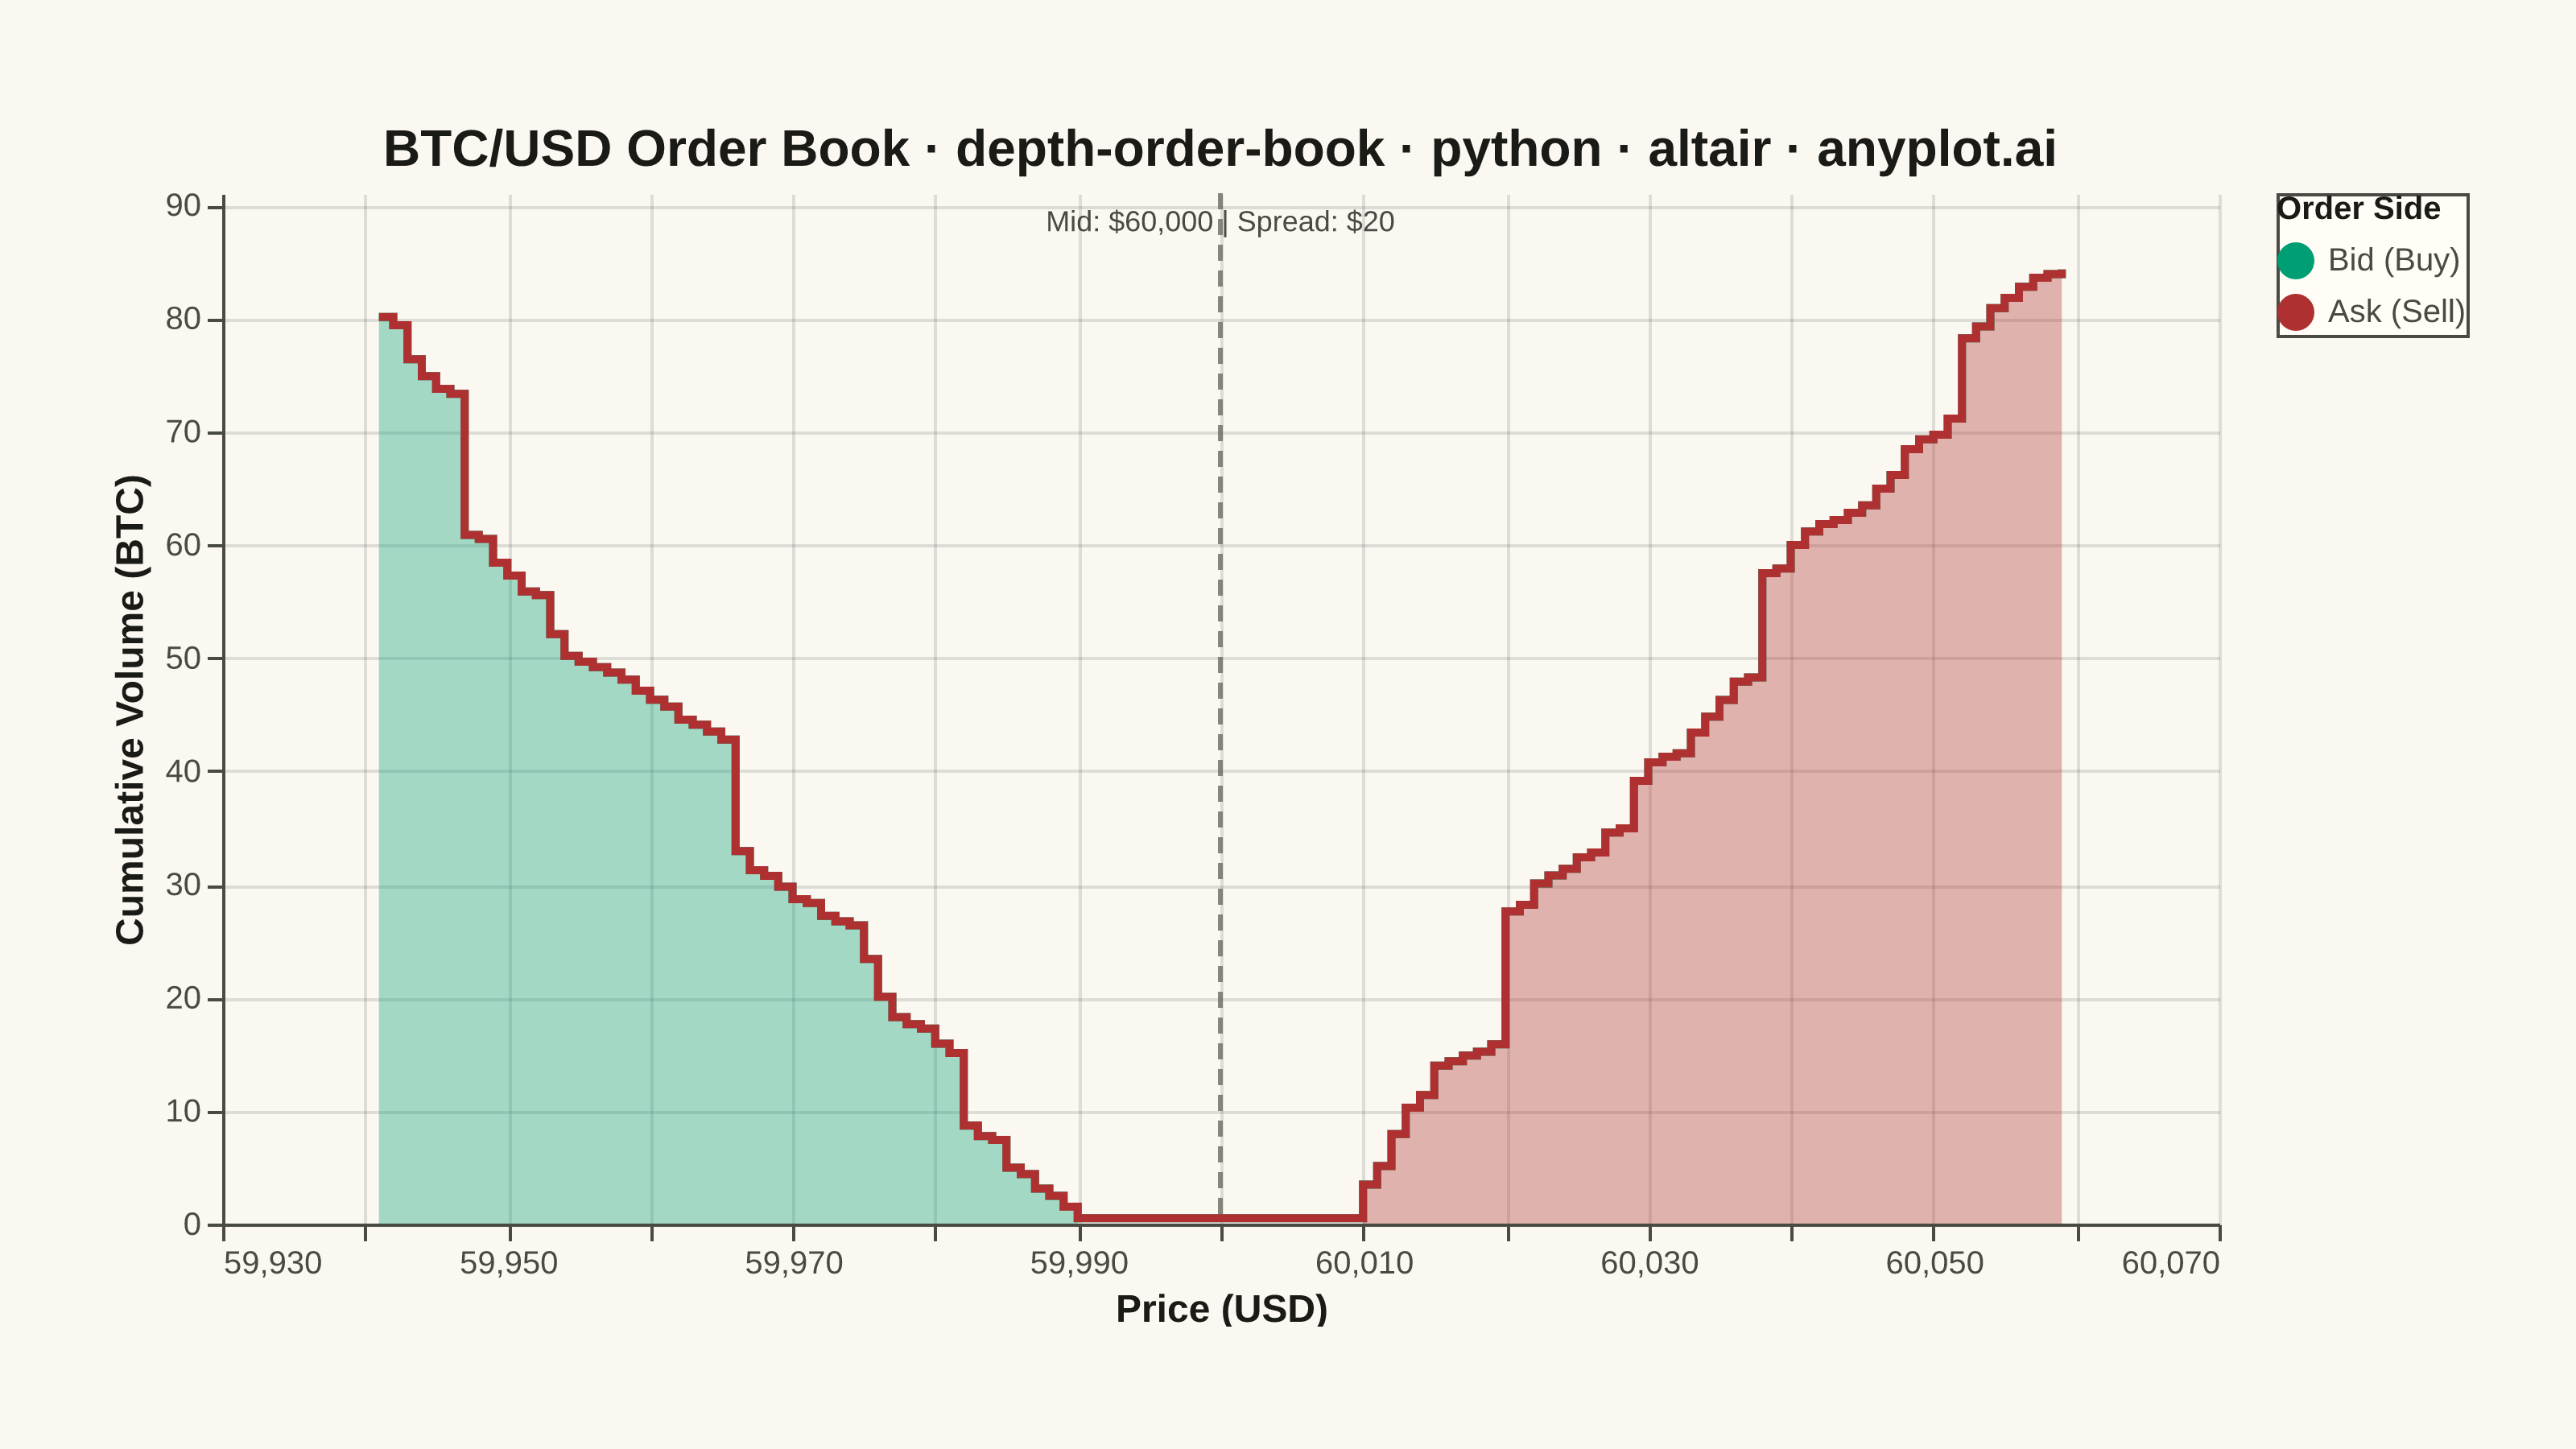
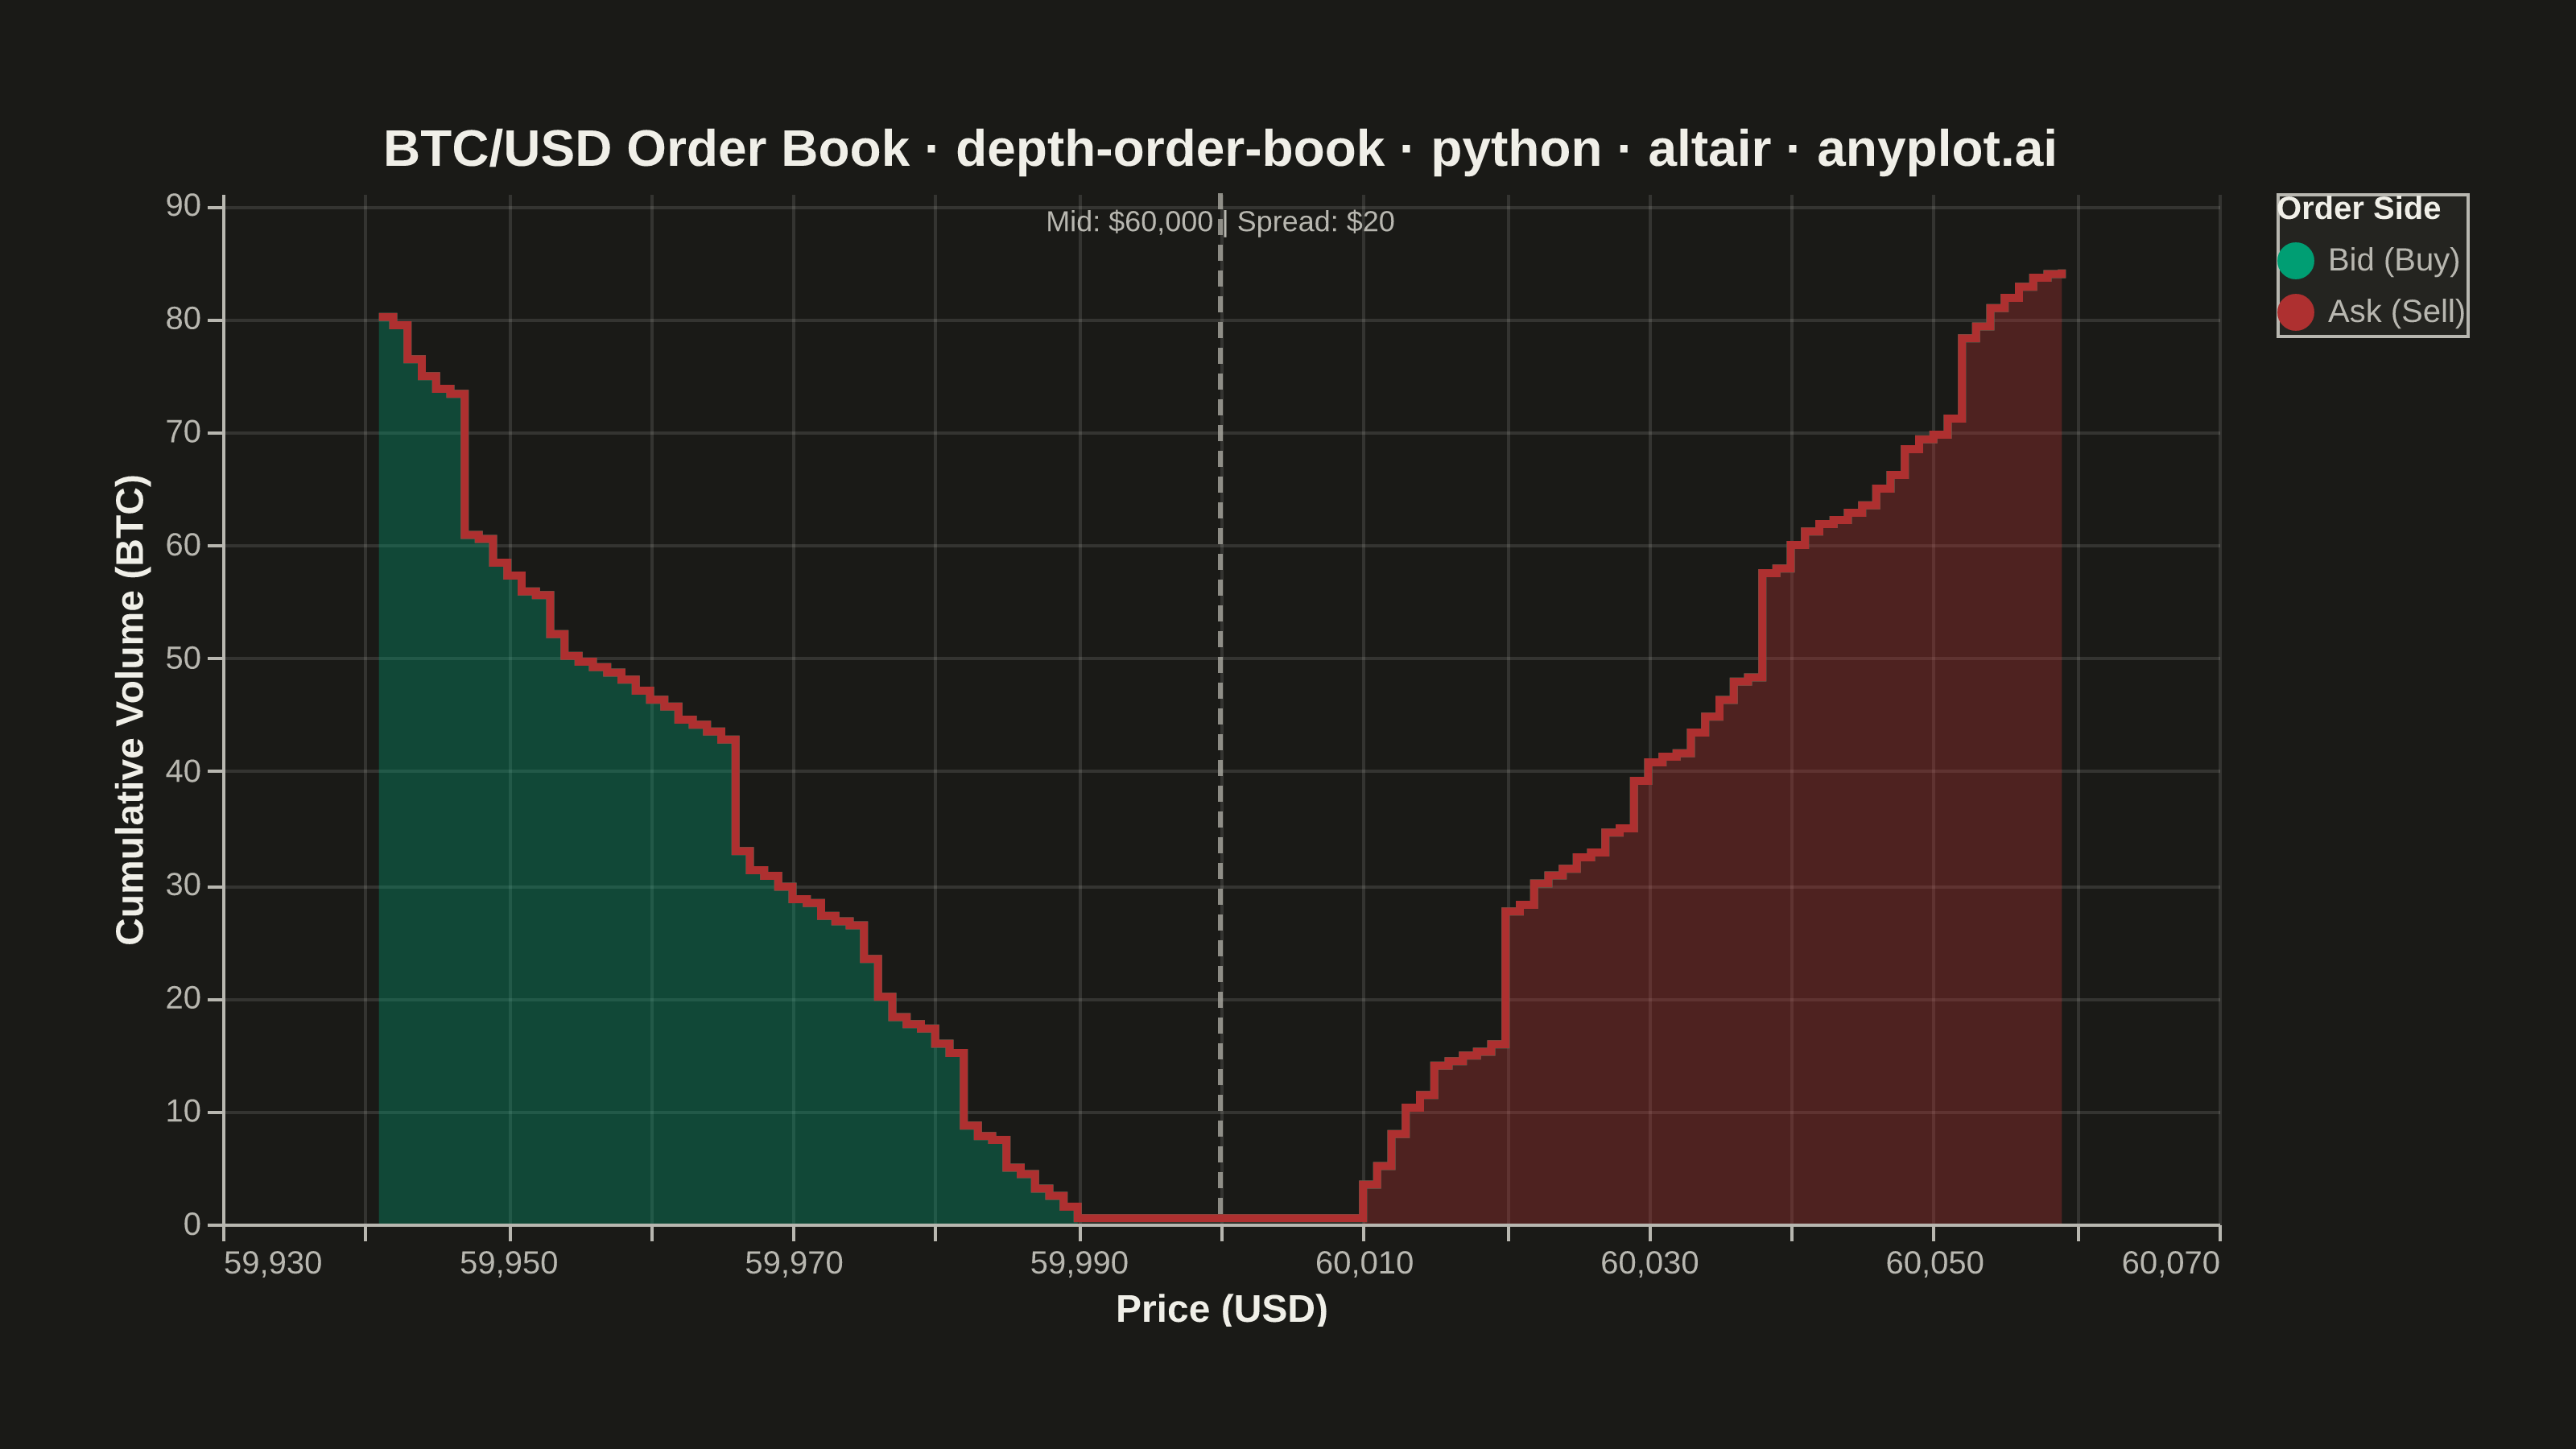
A market depth chart visualizes a snapshot of an exchange order book as two cumulative step areas around the mid price. Cumulative bid volume rises as a green step area to the left of the mid price (summing buy orders from the best bid downward), while cumulative ask volume rises as a red step area to the right (summing sell orders from the best ask upward). The bid-ask spread appears as a gap at the center, with price on the x-axis and cumulative quantity on the y-axis. This is the iconic chart found in nearly every trading and crypto exchange UI, revealing liquidity, support/resistance walls, and the imbalance between buying and selling pressure.
""" anyplot.ai
depth-order-book: Order Book Depth Chart
Library: altair 6.2.1 | Python 3.13.13
Quality: 89/100 | Created: 2026-06-15
"""

import importlib
import os
import sys


# Remove script directory from sys.path so `altair` resolves to the package, not this file
sys.path[:] = [p for p in sys.path if os.path.abspath(p or ".") != os.path.dirname(os.path.abspath(__file__))]
alt = importlib.import_module("altair")
np = importlib.import_module("numpy")
pd = importlib.import_module("pandas")
from PIL import Image


# Theme tokens
THEME = os.getenv("ANYPLOT_THEME", "light")
PAGE_BG = "#FAF8F1" if THEME == "light" else "#1A1A17"
ELEVATED_BG = "#FFFDF6" if THEME == "light" else "#242420"
INK = "#1A1A17" if THEME == "light" else "#F0EFE8"
INK_SOFT = "#4A4A44" if THEME == "light" else "#B8B7B0"
INK_MUTED = "#6B6A63" if THEME == "light" else "#A8A79F"

# Imprint palette — semantic colors for bid/ask sides
BID_COLOR = "#009E73"  # Imprint position 1 (brand green) — buy orders
ASK_COLOR = "#AE3030"  # Imprint position 5 (matte red) — sell orders

# Data — BTC/USD order book snapshot
np.random.seed(42)

MID_PRICE = 60_000
BEST_BID = 59_990
BEST_ASK = 60_010
N_LEVELS = 50

# Bid levels: 59941 → 59990 (50 levels, $1 step)
bid_prices = np.arange(BEST_BID - N_LEVELS + 1, BEST_BID + 1)
bid_raw = 0.3 + np.random.exponential(scale=0.9, size=N_LEVELS)
bid_raw[5] += 12.0  # large support wall near best bid
bid_raw[24] += 9.0  # mid-depth support wall
bid_raw[40] += 6.0  # deeper support level

# Cumulative from best bid outward (index -1 = best bid, index 0 = worst bid)
bid_cumulative = np.cumsum(bid_raw[::-1])[::-1]

bid_df = pd.DataFrame({"price": bid_prices, "cumulative": bid_cumulative, "side": "Bid (Buy)"})

# Ask levels: 60010 → 60059 (50 levels, $1 step)
ask_prices = np.arange(BEST_ASK, BEST_ASK + N_LEVELS)
ask_raw = 0.3 + np.random.exponential(scale=0.9, size=N_LEVELS)
ask_raw[10] += 11.0  # resistance wall near best ask
ask_raw[28] += 8.5  # mid-depth resistance wall
ask_raw[42] += 5.5  # deeper resistance level

ask_cumulative = np.cumsum(ask_raw)

ask_df = pd.DataFrame({"price": ask_prices, "cumulative": ask_cumulative, "side": "Ask (Sell)"})

df = pd.concat([bid_df, ask_df], ignore_index=True)

# Chart parameters
x_min = int(bid_prices.min()) - 5
x_max = int(ask_prices.max()) + 10
y_max = max(float(bid_cumulative.max()), float(ask_cumulative.max())) * 1.08

# Title with fontsize scaling
title = "BTC/USD Order Book · depth-order-book · python · altair · anyplot.ai"
n = len(title)
ratio = 67 / n if n > 67 else 1.0
title_fontsize = max(11, round(16 * ratio))

# Step-area chart (bid and ask grouped by 'side')
area = (
    alt.Chart(df)
    .mark_area(interpolate="step-after", fillOpacity=0.35, line={"strokeWidth": 2.5})
    .encode(
        x=alt.X(
            "price:Q",
            title="Price (USD)",
            axis=alt.Axis(format=",.0f", labelAngle=0, tickCount=10),
            scale=alt.Scale(domain=[x_min, x_max]),
        ),
        y=alt.Y("cumulative:Q", title="Cumulative Volume (BTC)", scale=alt.Scale(domain=[0, y_max])),
        color=alt.Color(
            "side:N",
            scale=alt.Scale(domain=["Bid (Buy)", "Ask (Sell)"], range=[BID_COLOR, ASK_COLOR]),
            legend=alt.Legend(title="Order Side"),
        ),
        tooltip=[
            alt.Tooltip("side:N", title="Side"),
            alt.Tooltip("price:Q", title="Price (USD)", format=",.0f"),
            alt.Tooltip("cumulative:Q", title="Cum. Volume (BTC)", format=".2f"),
        ],
    )
)

# Dashed vertical rule at mid price
mid_rule = (
    alt.Chart(pd.DataFrame({"price": [MID_PRICE]}))
    .mark_rule(strokeDash=[5, 3], strokeWidth=1.5, color=INK_MUTED, opacity=0.8)
    .encode(x="price:Q")
)

# Mid-price / spread annotation label
SPREAD = BEST_ASK - BEST_BID
mid_label = (
    alt.Chart(pd.DataFrame({"price": [MID_PRICE], "y": [y_max * 0.96]}))
    .mark_text(text=f"Mid: ${MID_PRICE:,} | Spread: ${SPREAD}", color=INK_SOFT, fontSize=9, align="center", dy=-4)
    .encode(
        x=alt.X("price:Q", scale=alt.Scale(domain=[x_min, x_max])), y=alt.Y("y:Q", scale=alt.Scale(domain=[0, y_max]))
    )
)

chart = (
    alt.layer(area, mid_rule, mid_label)
    .properties(
        width=620,
        height=320,
        background=PAGE_BG,
        padding={"left": 0, "right": 0, "top": 0, "bottom": 0},
        title=alt.TitleParams(text=title, fontSize=title_fontsize, color=INK),
    )
    .configure_view(fill=PAGE_BG, stroke=None, continuousWidth=620, continuousHeight=320)
    .configure_axis(
        domainColor=INK_SOFT,
        tickColor=INK_SOFT,
        gridColor=INK,
        gridOpacity=0.12,
        labelColor=INK_SOFT,
        titleColor=INK,
        labelFontSize=10,
        titleFontSize=12,
    )
    .configure_title(color=INK, fontSize=title_fontsize)
    .configure_legend(
        fillColor=ELEVATED_BG,
        strokeColor=INK_SOFT,
        labelColor=INK_SOFT,
        titleColor=INK,
        labelFontSize=10,
        titleFontSize=10,
    )
)

# Save PNG
chart.save(f"plot-{THEME}.png", scale_factor=4.0)

# Pad to exact canvas size 3200×1800 — do NOT crop
TW, TH = 3200, 1800
_img = Image.open(f"plot-{THEME}.png").convert("RGB")
_w, _h = _img.size
if _w > TW or _h > TH:
    raise SystemExit(
        f"altair vl-convert produced {_w}×{_h}, exceeds target {TW}×{TH}. "
        f"Shrink chart .properties(width=, height=) values and re-render."
    )
if _w < TW or _h < TH:
    _canvas = Image.new("RGB", (TW, TH), PAGE_BG)
    _canvas.paste(_img, ((TW - _w) // 2, (TH - _h) // 2))
    _canvas.save(f"plot-{THEME}.png")

# Save HTML (interactive)
chart.save(f"plot-{THEME}.html")
Runnable source as JSON, for any HTTP client: https://api.anyplot.ai/specs/depth-order-book/altair/code. Any spec id and library id listed in llms-full.txt fit the same URL shape; every URL below is complete and callable.
{
  "spec_id": "depth-order-book",
  "language": "python",
  "library": "altair",
  "page": "https://anyplot.ai/depth-order-book/python/altair",
  "hub": "https://anyplot.ai/depth-order-book",
  "code_json": "https://api.anyplot.ai/specs/depth-order-book/altair/code",
  "spec_json": "https://api.anyplot.ai/specs/depth-order-book",
  "render_light_png": "https://storage.googleapis.com/anyplot-images/plots/depth-order-book/python/altair/plot-light.png",
  "render_dark_png": "https://storage.googleapis.com/anyplot-images/plots/depth-order-book/python/altair/plot-dark.png",
  "interactive_light_html": "https://storage.googleapis.com/anyplot-images/plots/depth-order-book/python/altair/plot-light.html",
  "interactive_dark_html": "https://storage.googleapis.com/anyplot-images/plots/depth-order-book/python/altair/plot-dark.html",
  "quality_score": 89.0,
  "license": "MIT",
  "guide": "https://anyplot.ai/llms.txt"
}
Part of Order Book Depth Chart on anyplot.ai.