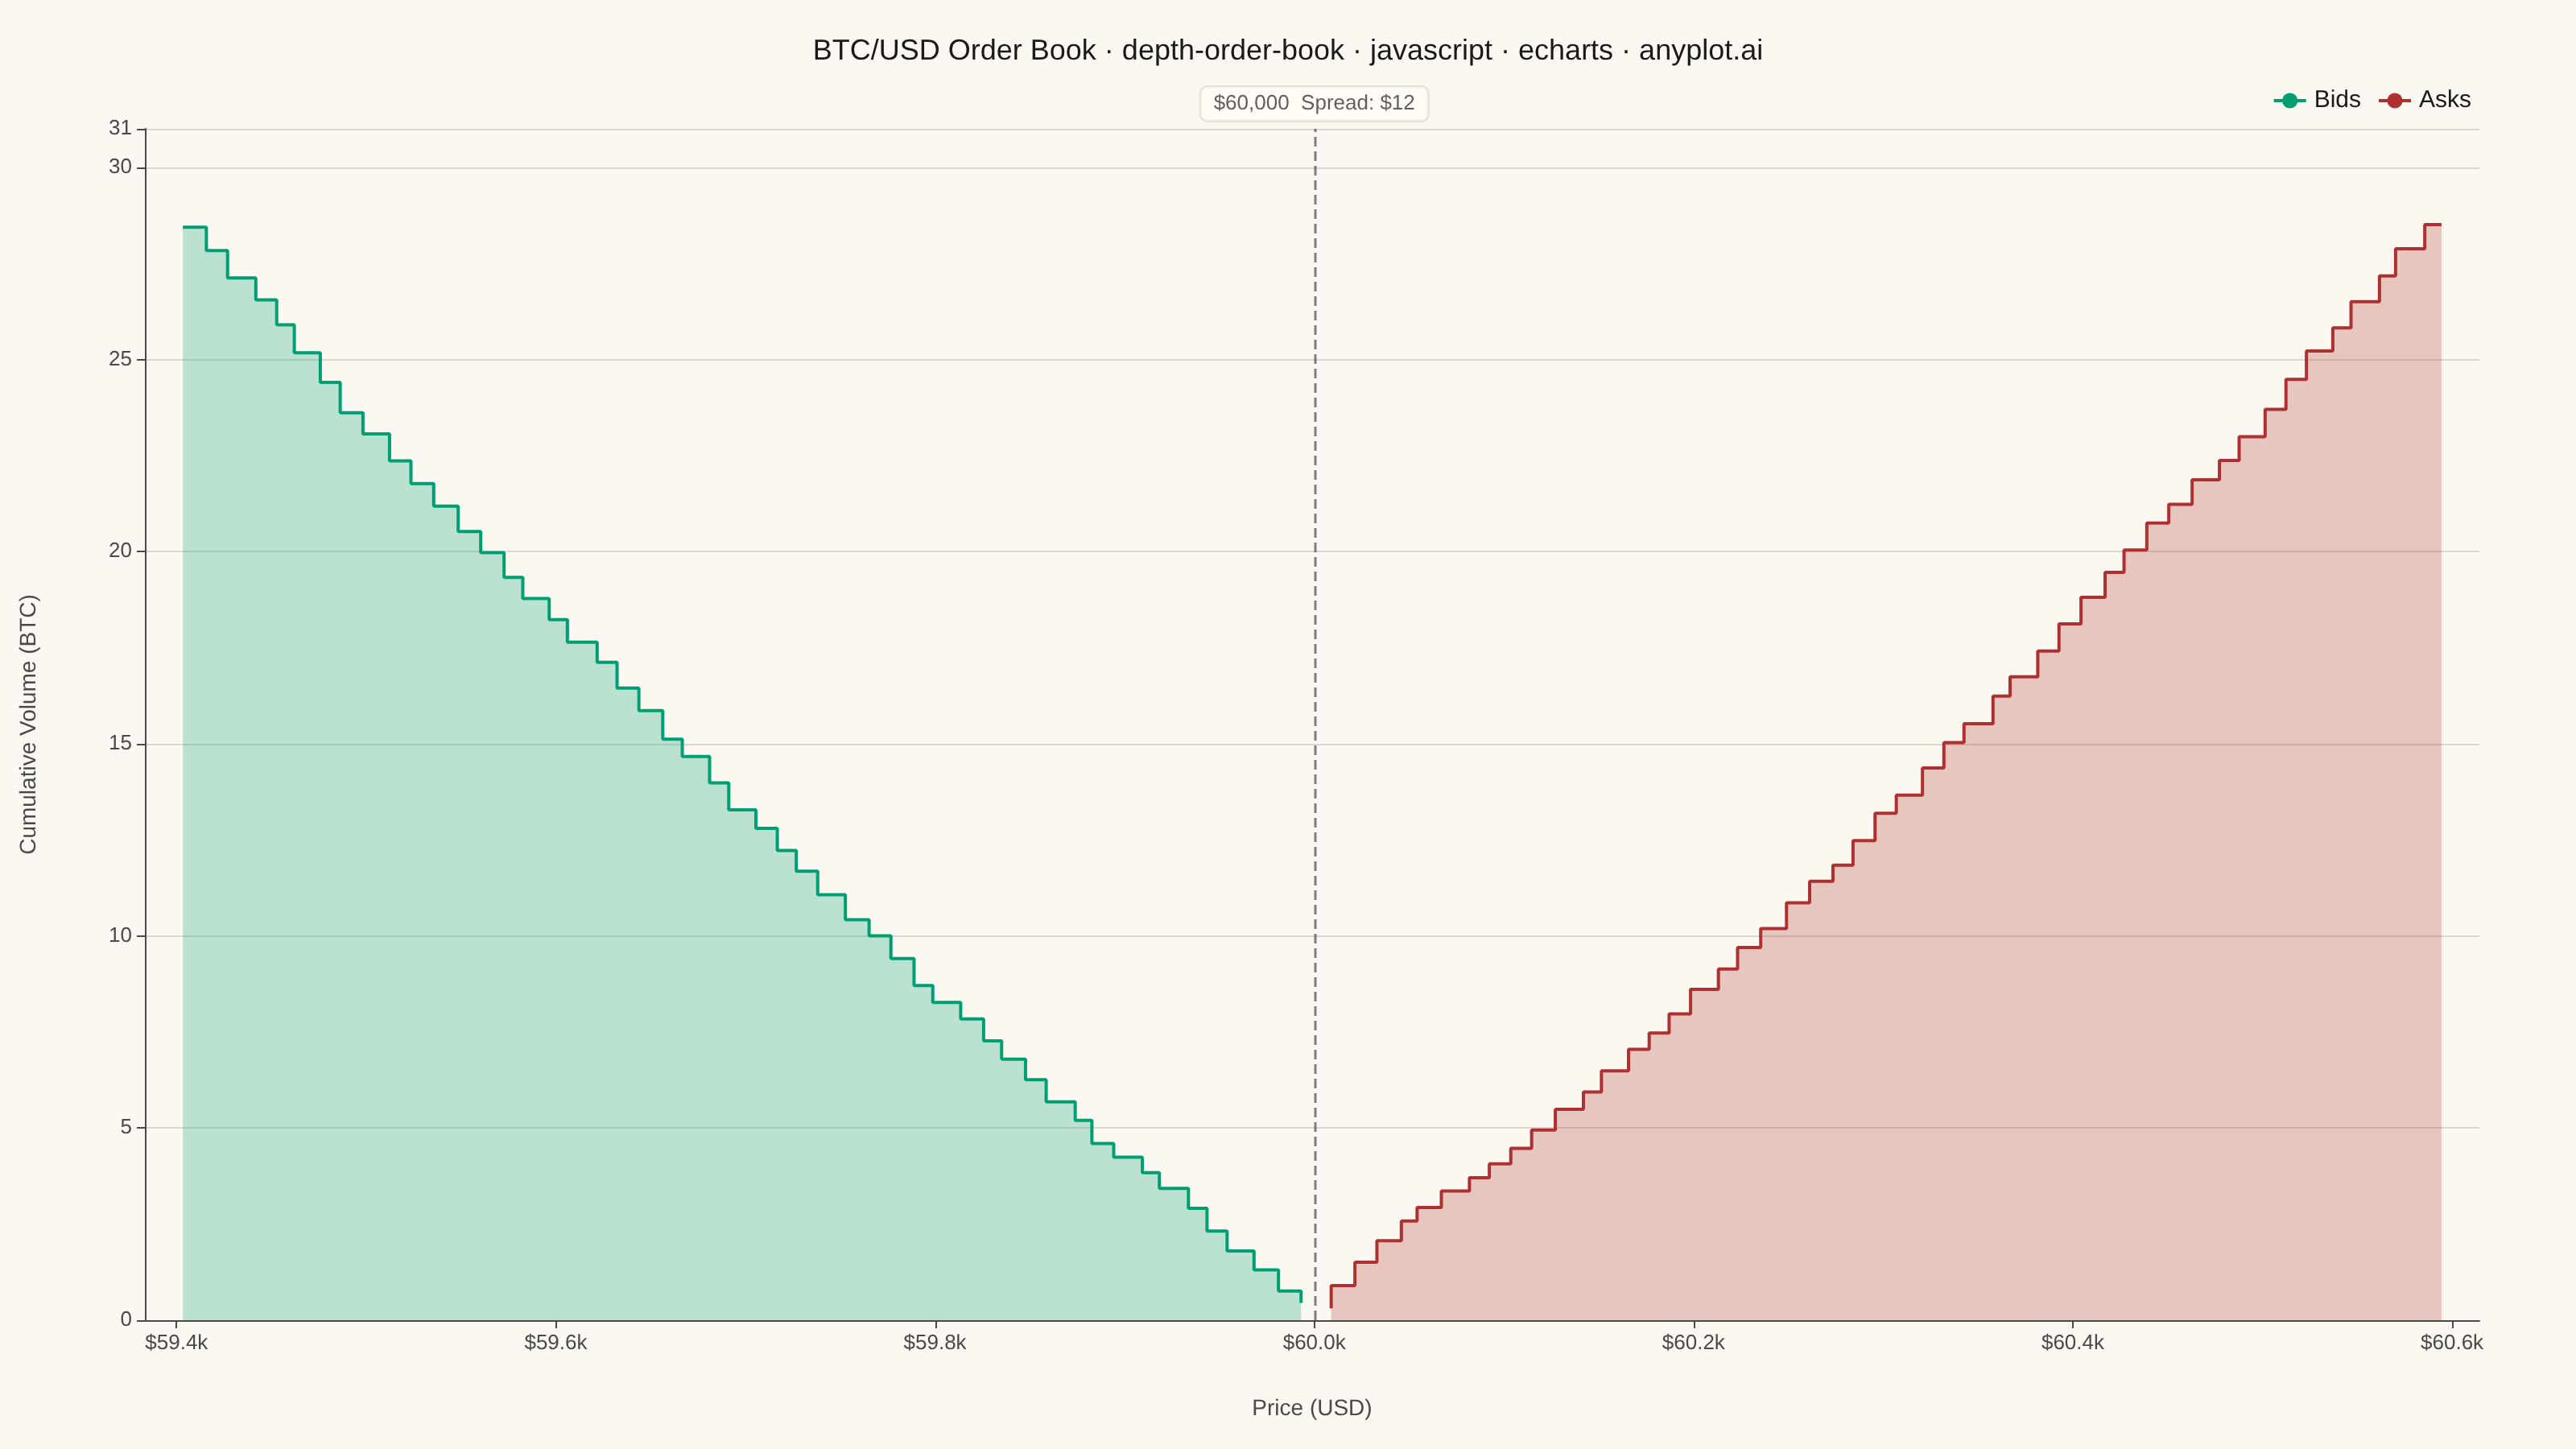
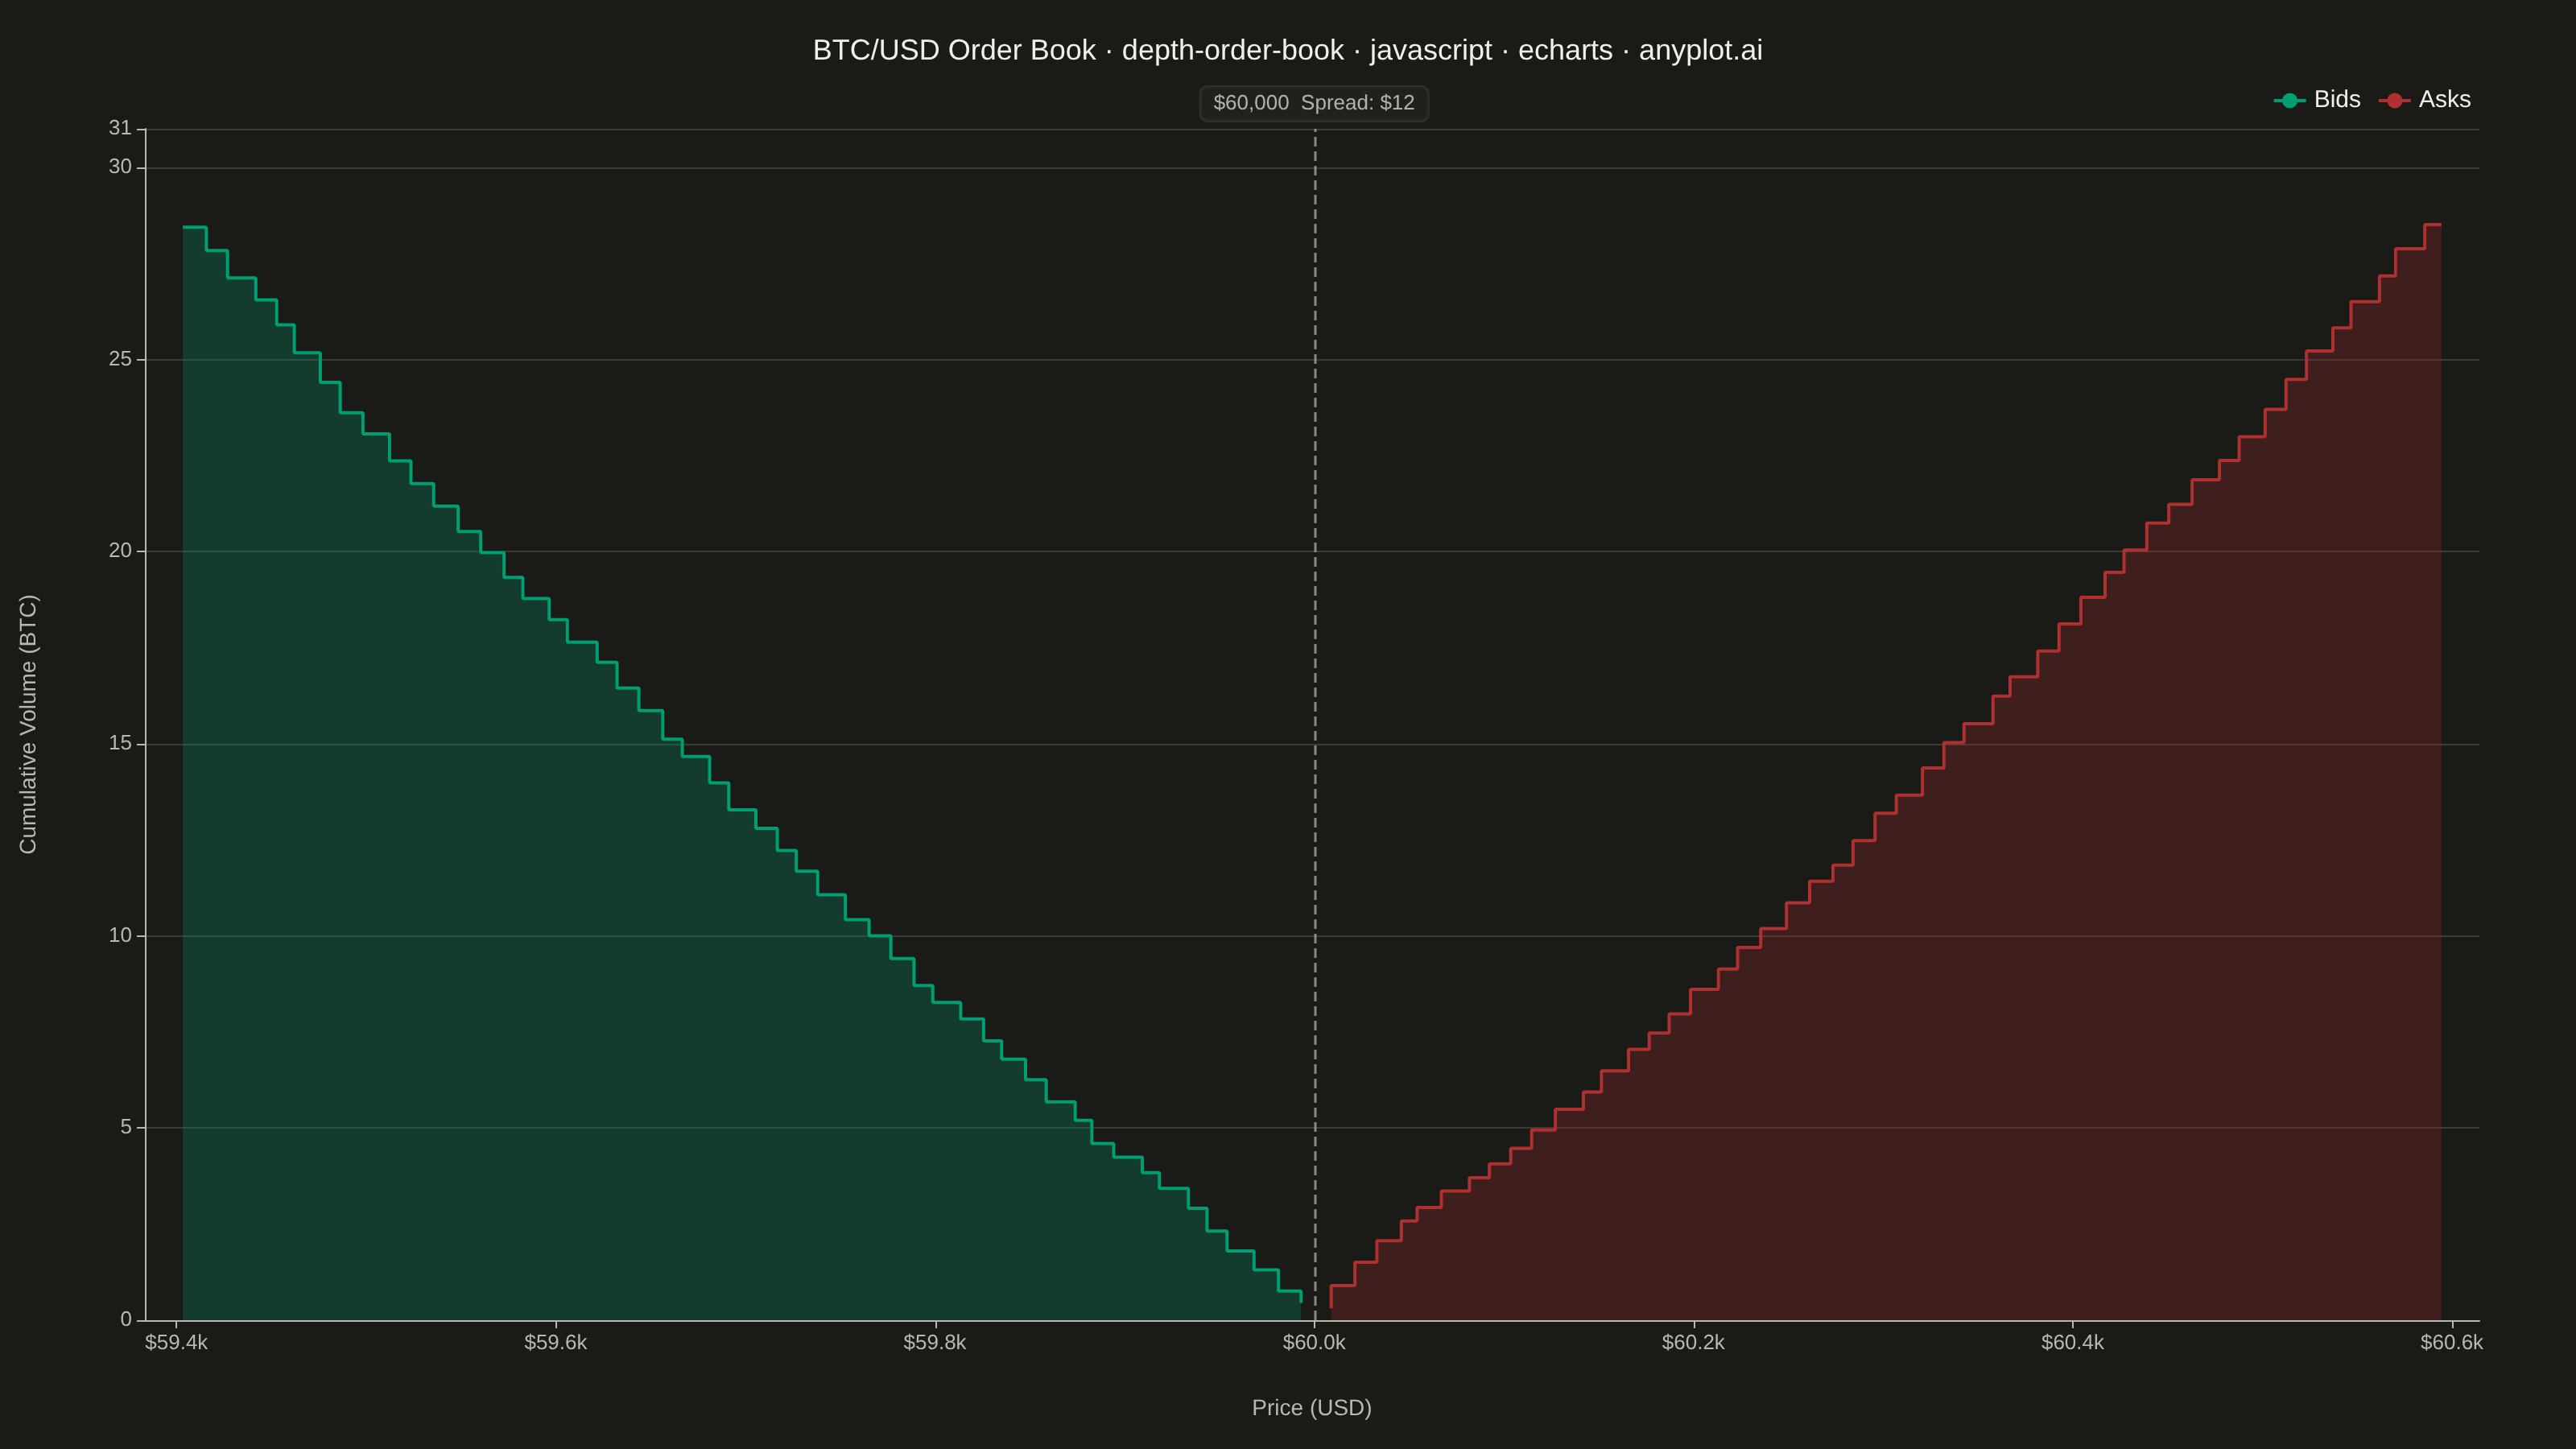
A market depth chart visualizes a snapshot of an exchange order book as two cumulative step areas around the mid price. Cumulative bid volume rises as a green step area to the left of the mid price (summing buy orders from the best bid downward), while cumulative ask volume rises as a red step area to the right (summing sell orders from the best ask upward). The bid-ask spread appears as a gap at the center, with price on the x-axis and cumulative quantity on the y-axis. This is the iconic chart found in nearly every trading and crypto exchange UI, revealing liquidity, support/resistance walls, and the imbalance between buying and selling pressure.
// anyplot.ai
// depth-order-book: Order Book Depth Chart
// Library: echarts 5.5.1 | JavaScript 22.22.3
// Quality: 93/100 | Created: 2026-06-15

//# anyplot-orientation: landscape

const t = window.ANYPLOT_TOKENS;

// --- Data -------------------------------------------------------------------
// BTC/USD order book snapshot, mid price ~60,000
const MID_PRICE = 60000;
const SPREAD = 12; // 12 USD spread

// Fixed-seed LCG for reproducible synthetic data
function lcg(seed) {
  let s = seed;
  return () => { s = (1664525 * s + 1013904223) & 0xffffffff; return (s >>> 0) / 0xffffffff; };
}
const rand = lcg(42);

// Generate 50 bid levels (below mid, best bid = MID_PRICE - SPREAD/2)
const BID_COUNT = 50;
const ASK_COUNT = 50;
const HALF_SPREAD = SPREAD / 2;

// Bids: price levels from best bid down to ~59,400
// Quantities grow away from mid (wall effect)
const bidLevels = [];
for (let i = 0; i < BID_COUNT; i++) {
  const price = Math.round((MID_PRICE - HALF_SPREAD - i * 12 - rand() * 4) * 10) / 10;
  const distFactor = 1 + i * 0.04 + rand() * 0.5;
  const qty = Math.round((0.15 + distFactor * 0.12 + rand() * 0.3) * 100) / 100;
  bidLevels.push({ price, qty });
}

// Asks: price levels from best ask up to ~60,600
const askLevels = [];
for (let i = 0; i < ASK_COUNT; i++) {
  const price = Math.round((MID_PRICE + HALF_SPREAD + i * 12 + rand() * 4) * 10) / 10;
  const distFactor = 1 + i * 0.04 + rand() * 0.5;
  const qty = Math.round((0.15 + distFactor * 0.12 + rand() * 0.3) * 100) / 100;
  askLevels.push({ price, qty });
}

// Cumulative quantities (from mid outward)
let bidCum = 0;
const bidData = bidLevels.map(({ price, qty }) => {
  bidCum += qty;
  return [price, Math.round(bidCum * 100) / 100];
});

let askCum = 0;
const askData = askLevels.map(({ price, qty }) => {
  askCum += qty;
  return [price, Math.round(askCum * 100) / 100];
});

// Bids are stored high→low (best bid first), ECharts needs low→high for xAxis
bidData.reverse();

// Mid price and spread annotation
const midPriceLabel = `$${MID_PRICE.toLocaleString()}`;
const spreadLabel = `Spread: $${SPREAD}`;

// X-axis range
const xMin = bidData[0][0] - 20;
const xMax = askData[askData.length - 1][0] + 20;

// Y-axis max (rounded to avoid float overflow tick)
const yMax = Math.ceil(Math.max(bidCum, askCum) * 1.08);

// --- Init -------------------------------------------------------------------
const chart = echarts.init(document.getElementById("container"));

// --- Option -----------------------------------------------------------------
chart.setOption({
  animation: false,
  color: t.palette,
  backgroundColor: "transparent",

  title: {
    text: "BTC/USD Order Book · depth-order-book · javascript · echarts · anyplot.ai",
    left: "center",
    top: 18,
    textStyle: { color: t.ink, fontSize: 18, fontWeight: "500" },
  },

  grid: { left: 90, right: 60, top: 80, bottom: 80 },

  tooltip: {
    trigger: "axis",
    axisPointer: { type: "line", lineStyle: { color: t.inkSoft, width: 1, type: "dashed" } },
    backgroundColor: t.elevatedBg,
    borderColor: t.grid,
    textStyle: { color: t.ink, fontSize: 13 },
    formatter: (params) => {
      if (!params || params.length === 0) return "";
      const p = params[0].data[0];
      const rows = params.map(
        (s) => `<span style="display:inline-block;width:10px;height:10px;border-radius:50%;background:${s.color};margin-right:6px;"></span>${s.seriesName}: <b>${s.data[1].toFixed(2)} BTC</b>`
      );
      return `<div style="padding:4px 8px"><b>$${p.toLocaleString()}</b><br/>${rows.join("<br/>")}</div>`;
    },
  },

  xAxis: {
    type: "value",
    min: xMin,
    max: xMax,
    name: "Price (USD)",
    nameLocation: "middle",
    nameGap: 48,
    nameTextStyle: { color: t.inkSoft, fontSize: 14 },
    axisLabel: {
      color: t.inkSoft,
      fontSize: 13,
      formatter: (v) => `$${(v / 1000).toFixed(1)}k`,
    },
    axisLine: { lineStyle: { color: t.inkSoft } },
    splitLine: { show: false },
  },

  yAxis: {
    type: "value",
    name: "Cumulative Volume (BTC)",
    nameLocation: "middle",
    nameGap: 65,
    nameTextStyle: { color: t.inkSoft, fontSize: 14 },
    min: 0,
    max: yMax,
    axisLabel: { color: t.inkSoft, fontSize: 13, formatter: (v) => v.toFixed(0) },
    axisLine: { lineStyle: { color: t.inkSoft } },
    splitLine: { lineStyle: { color: t.grid, width: 1 } },
  },

  // Mid price vertical line + spread annotation
  markLine: {},

  series: [
    {
      name: "Bids",
      type: "line",
      step: "end",
      data: bidData,
      symbol: "none",
      lineStyle: { color: "#009E73", width: 2 },
      areaStyle: { color: "#009E73", opacity: 0.25 },
      markLine: {
        symbol: "none",
        silent: true,
        lineStyle: { type: "dashed", color: t.inkSoft, width: 1.5, opacity: 0.7 },
        label: {
          show: true,
          position: "end",
          rotate: 0,
          formatter: `${midPriceLabel}  ${spreadLabel}`,
          color: t.ink,
          fontSize: 13,
          fontWeight: "500",
          backgroundColor: t.elevatedBg,
          padding: [4, 8],
          borderRadius: 4,
          borderColor: t.grid,
          borderWidth: 1,
        },
        data: [{ xAxis: MID_PRICE }],
      },
    },
    {
      name: "Asks",
      type: "line",
      step: "start",
      data: askData,
      symbol: "none",
      lineStyle: { color: "#AE3030", width: 2 },
      areaStyle: { color: "#AE3030", opacity: 0.25 },
    },
  ],

  legend: {
    top: 50,
    right: 60,
    textStyle: { color: t.ink, fontSize: 15 },
    itemWidth: 20,
    itemHeight: 12,
    data: [
      { name: "Bids", itemStyle: { color: "#009E73" } },
      { name: "Asks", itemStyle: { color: "#AE3030" } },
    ],
  },
});
Runnable source as JSON, for any HTTP client: https://api.anyplot.ai/specs/depth-order-book/echarts/code. Any spec id and library id listed in llms-full.txt fit the same URL shape; every URL below is complete and callable.
{
  "spec_id": "depth-order-book",
  "language": "javascript",
  "library": "echarts",
  "page": "https://anyplot.ai/depth-order-book/javascript/echarts",
  "hub": "https://anyplot.ai/depth-order-book",
  "code_json": "https://api.anyplot.ai/specs/depth-order-book/echarts/code",
  "spec_json": "https://api.anyplot.ai/specs/depth-order-book",
  "render_light_png": "https://storage.googleapis.com/anyplot-images/plots/depth-order-book/javascript/echarts/plot-light.png",
  "render_dark_png": "https://storage.googleapis.com/anyplot-images/plots/depth-order-book/javascript/echarts/plot-dark.png",
  "interactive_light_html": "https://storage.googleapis.com/anyplot-images/plots/depth-order-book/javascript/echarts/plot-light.html",
  "interactive_dark_html": "https://storage.googleapis.com/anyplot-images/plots/depth-order-book/javascript/echarts/plot-dark.html",
  "quality_score": 93.0,
  "license": "MIT",
  "guide": "https://anyplot.ai/llms.txt"
}
Part of Order Book Depth Chart on anyplot.ai.