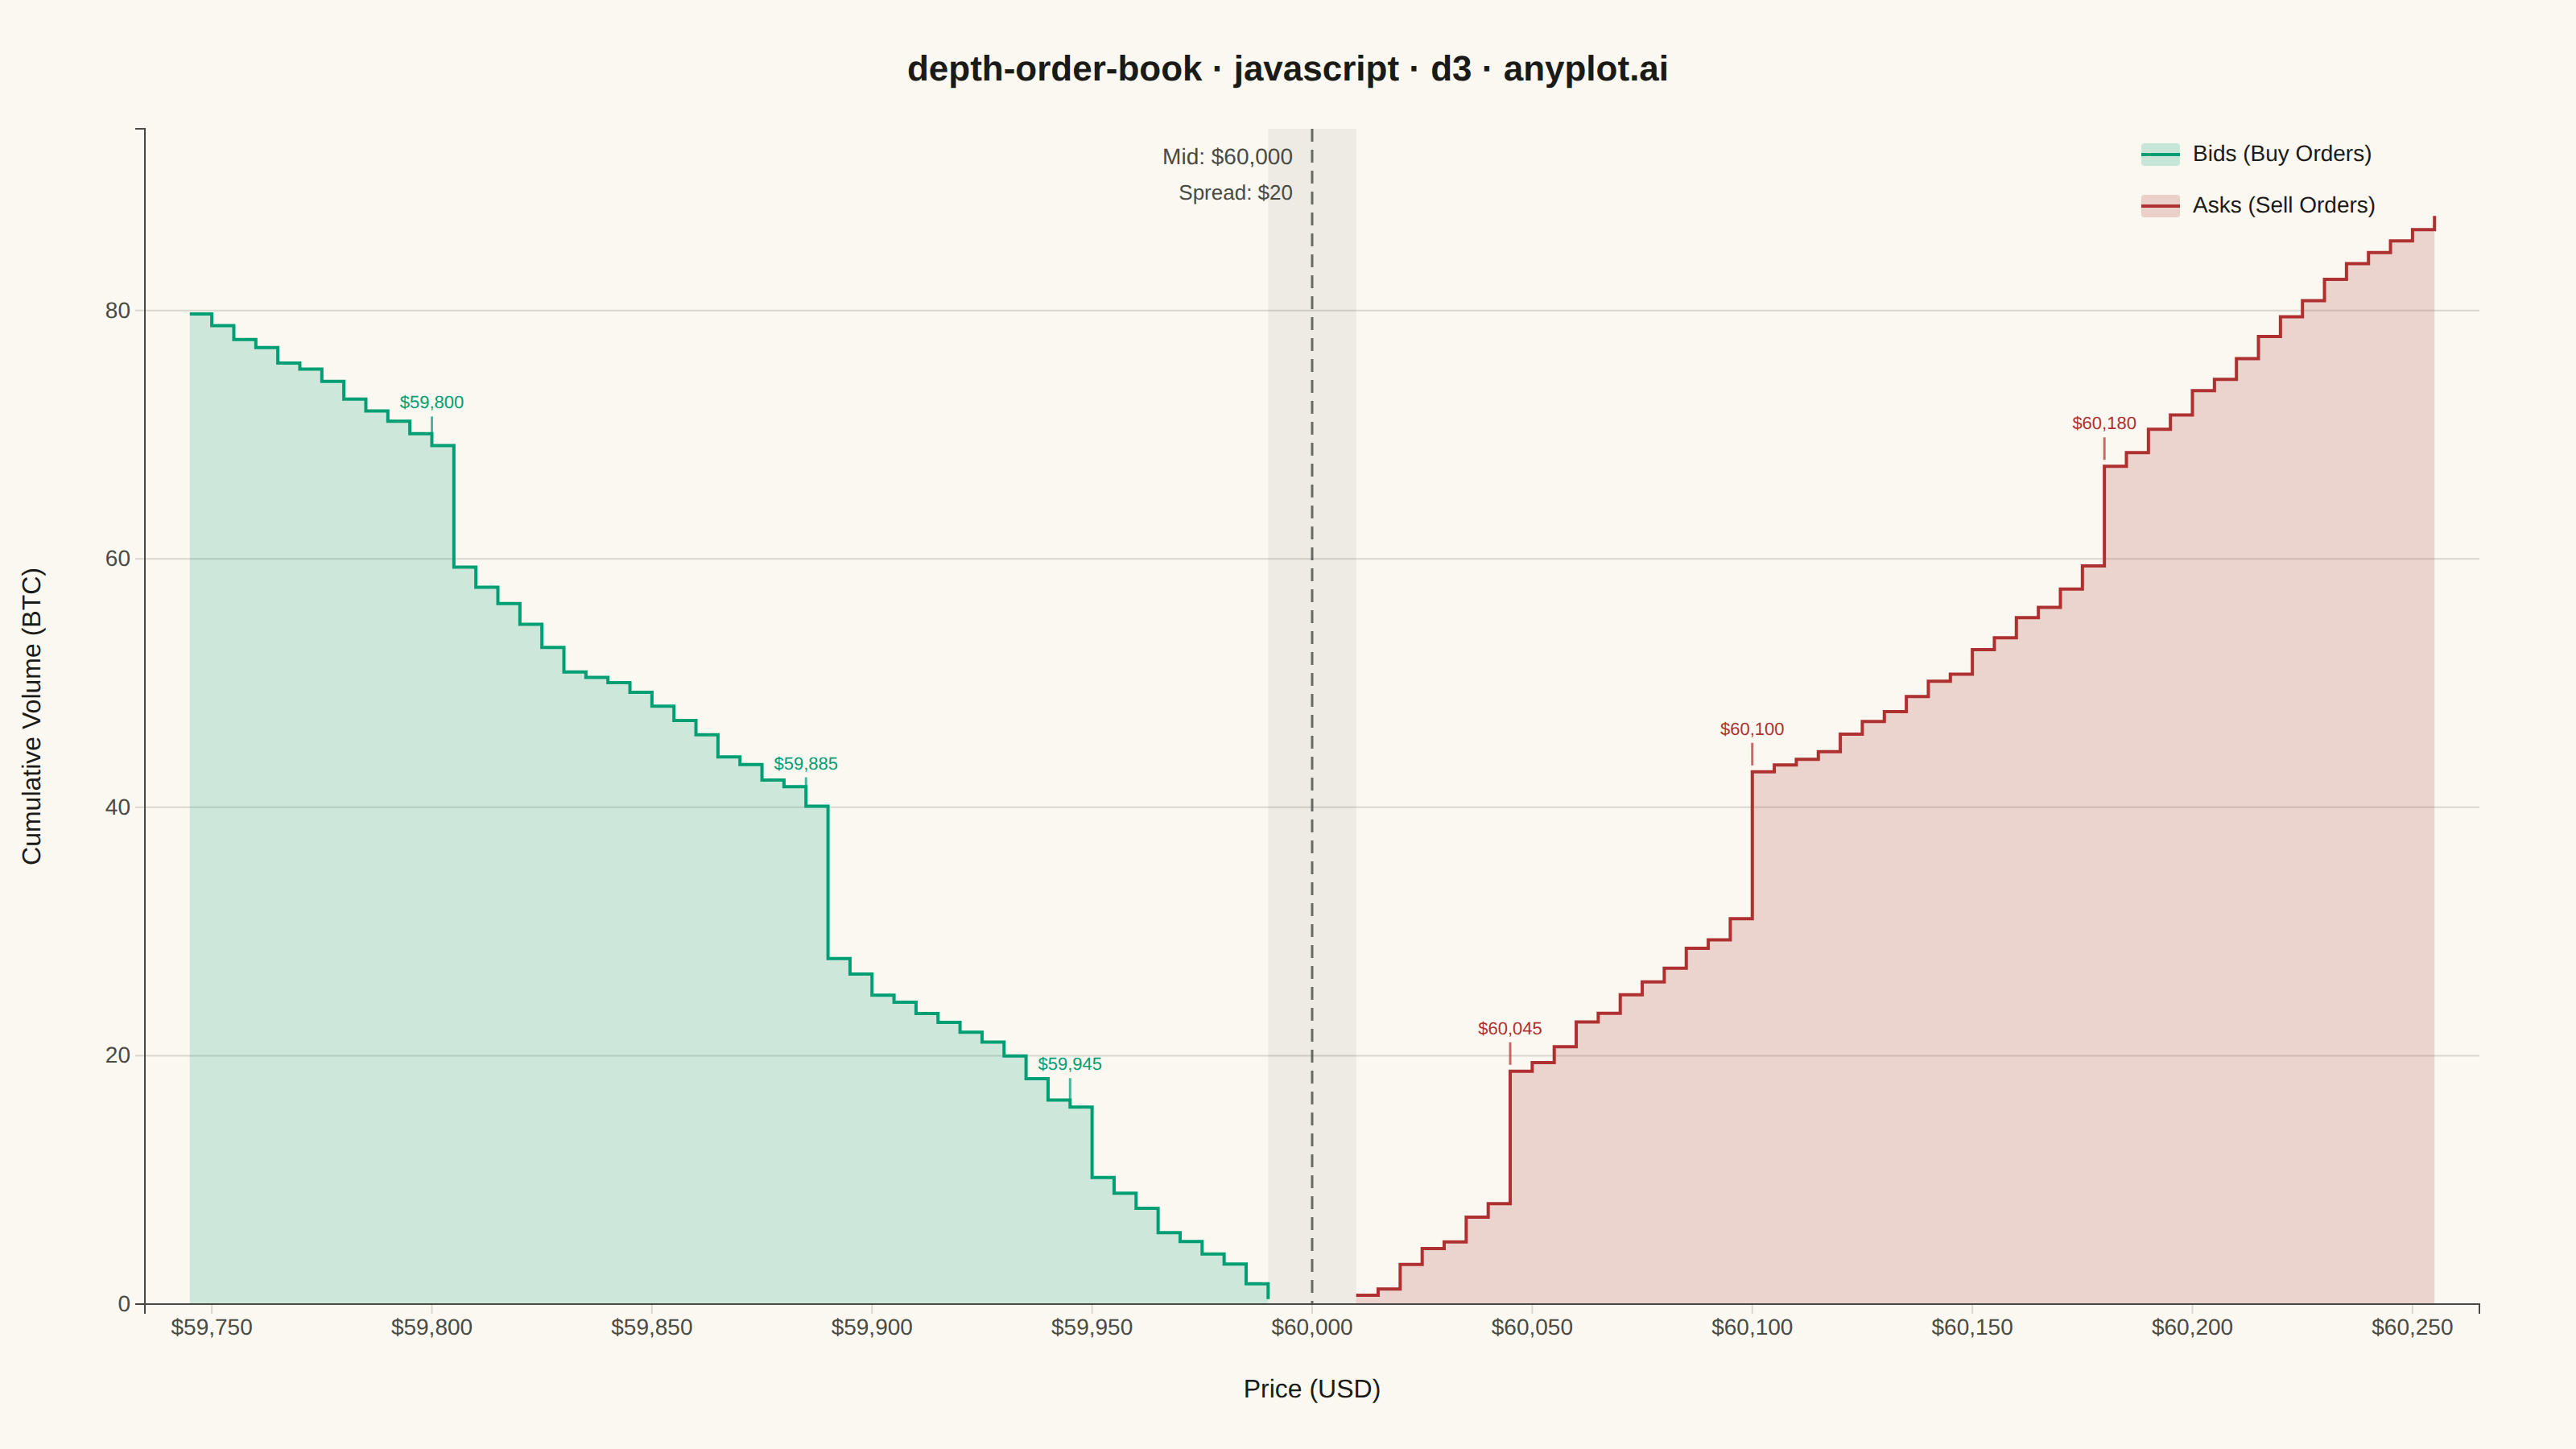
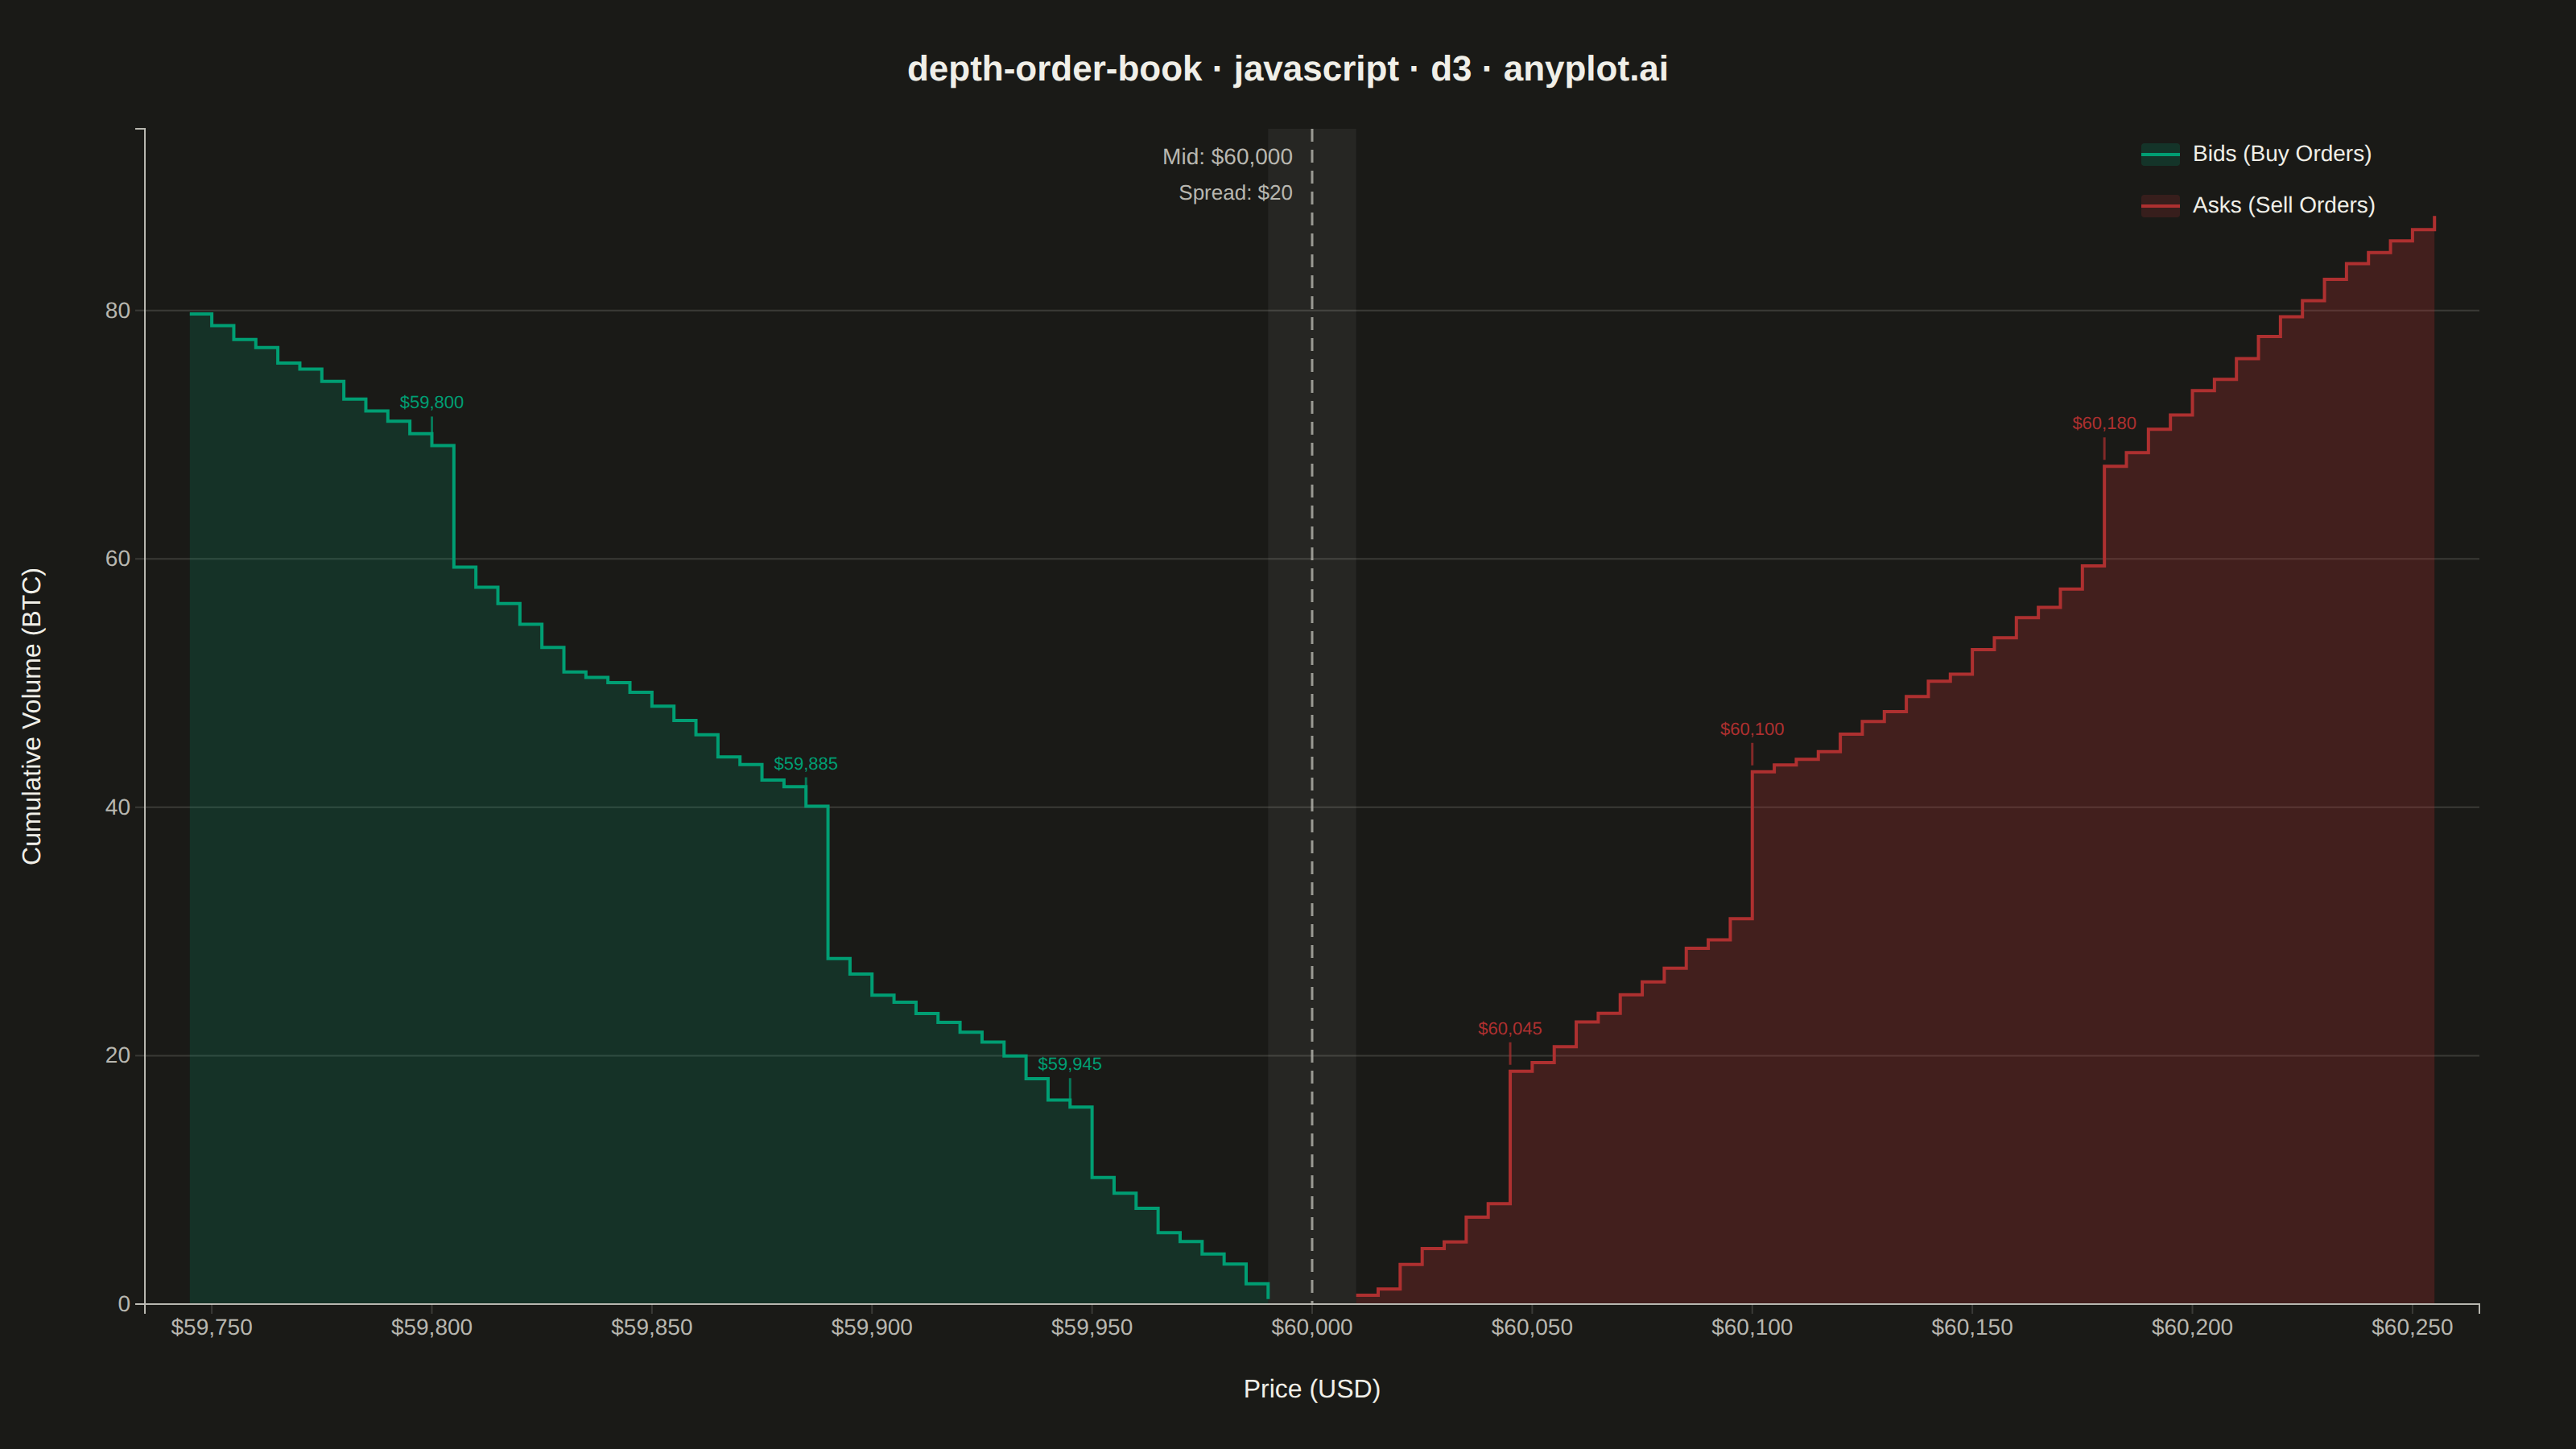
A market depth chart visualizes a snapshot of an exchange order book as two cumulative step areas around the mid price. Cumulative bid volume rises as a green step area to the left of the mid price (summing buy orders from the best bid downward), while cumulative ask volume rises as a red step area to the right (summing sell orders from the best ask upward). The bid-ask spread appears as a gap at the center, with price on the x-axis and cumulative quantity on the y-axis. This is the iconic chart found in nearly every trading and crypto exchange UI, revealing liquidity, support/resistance walls, and the imbalance between buying and selling pressure.
// anyplot.ai
// depth-order-book: Order Book Depth Chart
// Library: d3 7.9.0 | JavaScript 22.22.3
// Quality: 92/100 | Created: 2026-06-15

const t = window.ANYPLOT_TOKENS;
const theme = window.ANYPLOT_THEME;
const { width, height } = window.ANYPLOT_SIZE;
const margin = { top: 80, right: 60, bottom: 90, left: 90 };
const iw = width - margin.left - margin.right;
const ih = height - margin.top - margin.bottom;

// Imprint palette: bid = green (palette[0]), ask = red (palette[4], semantic sell/loss)
const BID_COLOR = t.palette[0];
const ASK_COLOR = t.palette[4];
// Ask fill-opacity raised in dark mode: #AE3030 at 18% on #1A1A17 is nearly invisible
const ASK_FILL_OPACITY = theme === "dark" ? 0.28 : 0.18;

// Park-Miller LCG — deterministic, no Date or Math.random
let _lcg = 42;
const rnd = () => { _lcg = (_lcg * 16807) % 2147483647; return _lcg / 2147483647; };

// BTC/USD order book snapshot parameters
const MID_PRICE = 60000;
const BEST_BID  = 59990;
const BEST_ASK  = 60010;
const N         = 50;
const TICK      = 5;

// Bid levels: best bid outward (price descends, cumulative quantity grows)
const bidLevels = [];
const bidWalls  = [];
let cumBid = 0;
for (let i = 0; i < N; i++) {
  const price = BEST_BID - i * TICK;
  let qty = 0.4 + rnd() * 1.6;
  const isWall = i === 9 || i === 21 || i === 38;
  if (isWall) qty *= 7;  // support walls
  cumBid += qty;
  bidLevels.push({ price, cumQty: cumBid });
  if (isWall) bidWalls.push({ price, cumQty: cumBid });
}

// Ask levels: best ask outward (price rises, cumulative quantity grows)
const askLevels = [];
const askWalls  = [];
let cumAsk = 0;
for (let i = 0; i < N; i++) {
  const price = BEST_ASK + i * TICK;
  let qty = 0.4 + rnd() * 1.6;
  const isWall = i === 7 || i === 18 || i === 34;
  if (isWall) qty *= 7;  // resistance walls
  cumAsk += qty;
  askLevels.push({ price, cumQty: cumAsk });
  if (isWall) askWalls.push({ price, cumQty: cumAsk });
}

const maxCumQty = d3.max([cumBid, cumAsk]);

// Area data: bids sorted ascending price (worst→best), asks ascending (best→worst)
// No sentinel at mid price — gap between best_bid and best_ask is naturally visible
const bidAreaData = bidLevels.slice().reverse();
const askAreaData = askLevels;

// Scales — symmetric around mid price for balanced visual
const halfRange = d3.max([
  MID_PRICE - bidLevels[N - 1].price,
  askLevels[N - 1].price - MID_PRICE
]) * 1.04;
const x = d3.scaleLinear()
  .domain([MID_PRICE - halfRange, MID_PRICE + halfRange])
  .range([0, iw]);
const y = d3.scaleLinear()
  .domain([0, maxCumQty * 1.08])
  .range([ih, 0]);

// SVG root
const svg = d3.select("#container").append("svg").attr("width", width).attr("height", height);
const g = svg.append("g").attr("transform", `translate(${margin.left},${margin.top})`);

// Y-axis grid lines (rendered first so they sit behind data)
g.append("g")
  .call(d3.axisLeft(y).ticks(6).tickSize(-iw).tickFormat(""))
  .call(gg => gg.select(".domain").remove())
  .call(gg => gg.selectAll(".tick line").attr("stroke", t.grid));

// Bid-ask spread gap highlight — narrow shaded rect between best bid and best ask
g.append("rect")
  .attr("x", x(BEST_BID))
  .attr("y", 0)
  .attr("width", x(BEST_ASK) - x(BEST_BID))
  .attr("height", ih)
  .attr("fill", t.grid)
  .attr("fill-opacity", 0.4);

// Step-area and step-line generators (curveStepAfter gives left-continuous staircase)
const areaGen = d3.area().curve(d3.curveStepAfter)
  .x(d => x(d.price)).y0(ih).y1(d => y(d.cumQty));
const lineGen = d3.line().curve(d3.curveStepAfter)
  .x(d => x(d.price)).y(d => y(d.cumQty));

// Bid semi-transparent fill
g.append("path").datum(bidAreaData)
  .attr("fill", BID_COLOR).attr("fill-opacity", 0.18)
  .attr("d", areaGen);
// Bid outline stroke
g.append("path").datum(bidAreaData)
  .attr("fill", "none").attr("stroke", BID_COLOR).attr("stroke-width", 2)
  .attr("d", lineGen);

// Ask semi-transparent fill (raised opacity in dark mode for visibility on #1A1A17)
g.append("path").datum(askAreaData)
  .attr("fill", ASK_COLOR).attr("fill-opacity", ASK_FILL_OPACITY)
  .attr("d", areaGen);
// Ask outline stroke
g.append("path").datum(askAreaData)
  .attr("fill", "none").attr("stroke", ASK_COLOR).attr("stroke-width", 2)
  .attr("d", lineGen);

// Wall annotations — D3 data join renders callout lines + price labels at support/resistance
const priceLabel = d3.format("$,");
const WALL_TICK_LEN = 18;

g.selectAll(".bid-wall").data(bidWalls).join("g")
  .attr("class", "bid-wall")
  .call(sel => sel.append("line")
    .attr("x1", d => x(d.price)).attr("y1", d => y(d.cumQty) - 4)
    .attr("x2", d => x(d.price)).attr("y2", d => y(d.cumQty) - WALL_TICK_LEN)
    .attr("stroke", BID_COLOR).attr("stroke-width", 1.5).attr("opacity", 0.7))
  .call(sel => sel.append("text")
    .attr("x", d => x(d.price)).attr("y", d => y(d.cumQty) - WALL_TICK_LEN - 5)
    .attr("text-anchor", "middle").attr("fill", BID_COLOR)
    .style("font-size", "11px").style("font-weight", "500")
    .text(d => priceLabel(d.price)));

g.selectAll(".ask-wall").data(askWalls).join("g")
  .attr("class", "ask-wall")
  .call(sel => sel.append("line")
    .attr("x1", d => x(d.price)).attr("y1", d => y(d.cumQty) - 4)
    .attr("x2", d => x(d.price)).attr("y2", d => y(d.cumQty) - WALL_TICK_LEN)
    .attr("stroke", ASK_COLOR).attr("stroke-width", 1.5).attr("opacity", 0.7))
  .call(sel => sel.append("text")
    .attr("x", d => x(d.price)).attr("y", d => y(d.cumQty) - WALL_TICK_LEN - 5)
    .attr("text-anchor", "middle").attr("fill", ASK_COLOR)
    .style("font-size", "11px").style("font-weight", "500")
    .text(d => priceLabel(d.price)));

// Mid-price dashed vertical line
const midX = x(MID_PRICE);
g.append("line")
  .attr("x1", midX).attr("y1", 0)
  .attr("x2", midX).attr("y2", ih)
  .attr("stroke", t.inkSoft).attr("stroke-width", 1.5)
  .attr("stroke-dasharray", "8,5").attr("opacity", 0.8);

// Mid-price and spread annotation (left of the dashed line, near top)
g.append("text")
  .attr("x", midX - 12).attr("y", 22)
  .attr("text-anchor", "end").attr("fill", t.inkSoft)
  .style("font-size", "14px")
  .text(`Mid: $${d3.format(",")(MID_PRICE)}`);
g.append("text")
  .attr("x", midX - 12).attr("y", 44)
  .attr("text-anchor", "end").attr("fill", t.inkSoft)
  .style("font-size", "13px")
  .text(`Spread: $${BEST_ASK - BEST_BID}`);

// X-axis
const xAxis = g.append("g")
  .attr("transform", `translate(0,${ih})`)
  .call(d3.axisBottom(x).ticks(8).tickFormat(d3.format("$,")));

// Y-axis
const yAxis = g.append("g")
  .call(d3.axisLeft(y).ticks(6).tickFormat(d => d.toFixed(0)));

for (const ax of [xAxis, yAxis]) {
  ax.selectAll("text").attr("fill", t.inkSoft).style("font-size", "14px");
  ax.selectAll(".tick line").attr("stroke", t.grid);
  ax.select(".domain").attr("stroke", t.inkSoft);
}

// Axis labels
g.append("text")
  .attr("x", iw / 2).attr("y", ih + 58)
  .attr("text-anchor", "middle").attr("fill", t.ink)
  .style("font-size", "16px")
  .text("Price (USD)");

g.append("text")
  .attr("transform", `translate(-65,${ih / 2}) rotate(-90)`)
  .attr("text-anchor", "middle").attr("fill", t.ink)
  .style("font-size", "16px")
  .text("Cumulative Volume (BTC)");

// Legend (top-right of plot area)
const legendX = iw - 210;
const legendY = 20;
[
  { color: BID_COLOR, label: "Bids (Buy Orders)" },
  { color: ASK_COLOR, label: "Asks (Sell Orders)" },
].forEach(({ color, label }, i) => {
  const ly = legendY + i * 32;
  g.append("rect")
    .attr("x", legendX).attr("y", ly - 11)
    .attr("width", 24).attr("height", 14).attr("rx", 2)
    .attr("fill", color).attr("fill-opacity", 0.2);
  g.append("line")
    .attr("x1", legendX).attr("y1", ly - 4)
    .attr("x2", legendX + 24).attr("y2", ly - 4)
    .attr("stroke", color).attr("stroke-width", 2);
  g.append("text")
    .attr("x", legendX + 32).attr("y", ly)
    .attr("fill", t.ink).style("font-size", "14px")
    .text(label);
});

// Title
svg.append("text")
  .attr("x", width / 2).attr("y", 50)
  .attr("text-anchor", "middle").attr("fill", t.ink)
  .style("font-size", "22px").style("font-weight", "600")
  .text("depth-order-book · javascript · d3 · anyplot.ai");
Runnable source as JSON, for any HTTP client: https://api.anyplot.ai/specs/depth-order-book/d3/code. Any spec id and library id listed in llms-full.txt fit the same URL shape; every URL below is complete and callable.
{
  "spec_id": "depth-order-book",
  "language": "javascript",
  "library": "d3",
  "page": "https://anyplot.ai/depth-order-book/javascript/d3",
  "hub": "https://anyplot.ai/depth-order-book",
  "code_json": "https://api.anyplot.ai/specs/depth-order-book/d3/code",
  "spec_json": "https://api.anyplot.ai/specs/depth-order-book",
  "render_light_png": "https://storage.googleapis.com/anyplot-images/plots/depth-order-book/javascript/d3/plot-light.png",
  "render_dark_png": "https://storage.googleapis.com/anyplot-images/plots/depth-order-book/javascript/d3/plot-dark.png",
  "interactive_light_html": "https://storage.googleapis.com/anyplot-images/plots/depth-order-book/javascript/d3/plot-light.html",
  "interactive_dark_html": "https://storage.googleapis.com/anyplot-images/plots/depth-order-book/javascript/d3/plot-dark.html",
  "quality_score": 92.0,
  "license": "MIT",
  "guide": "https://anyplot.ai/llms.txt"
}
Part of Order Book Depth Chart on anyplot.ai.