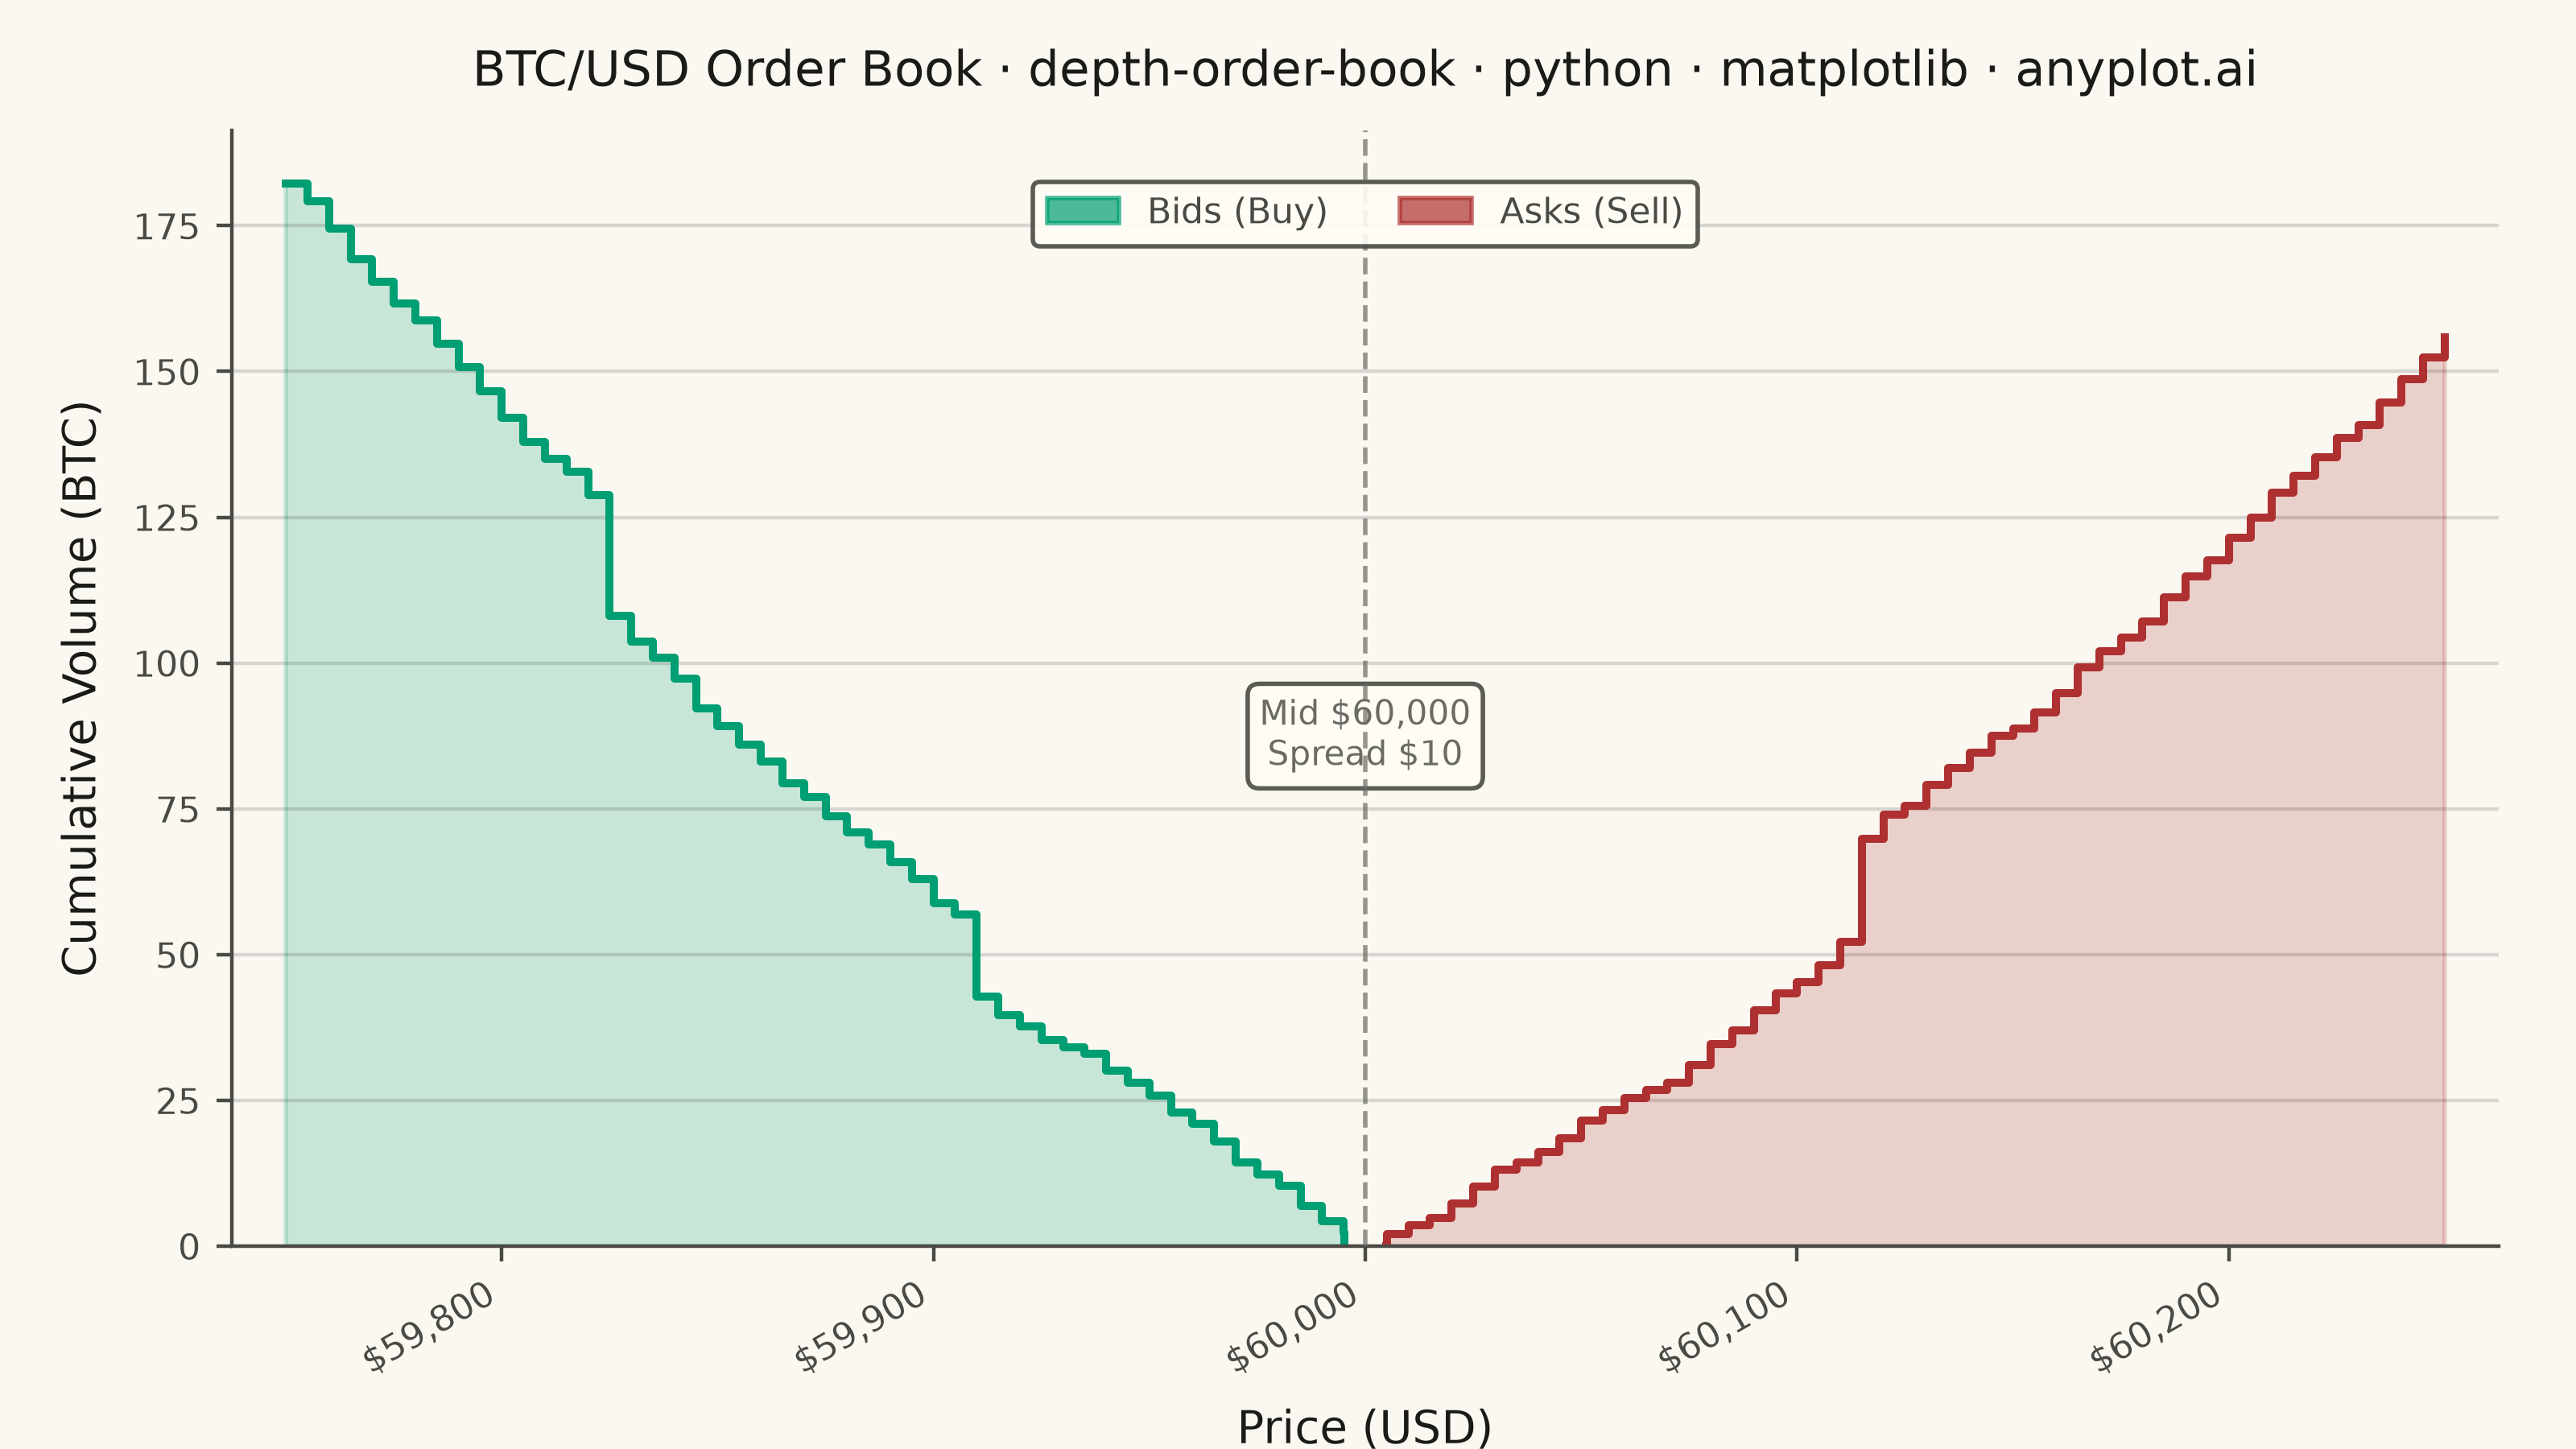
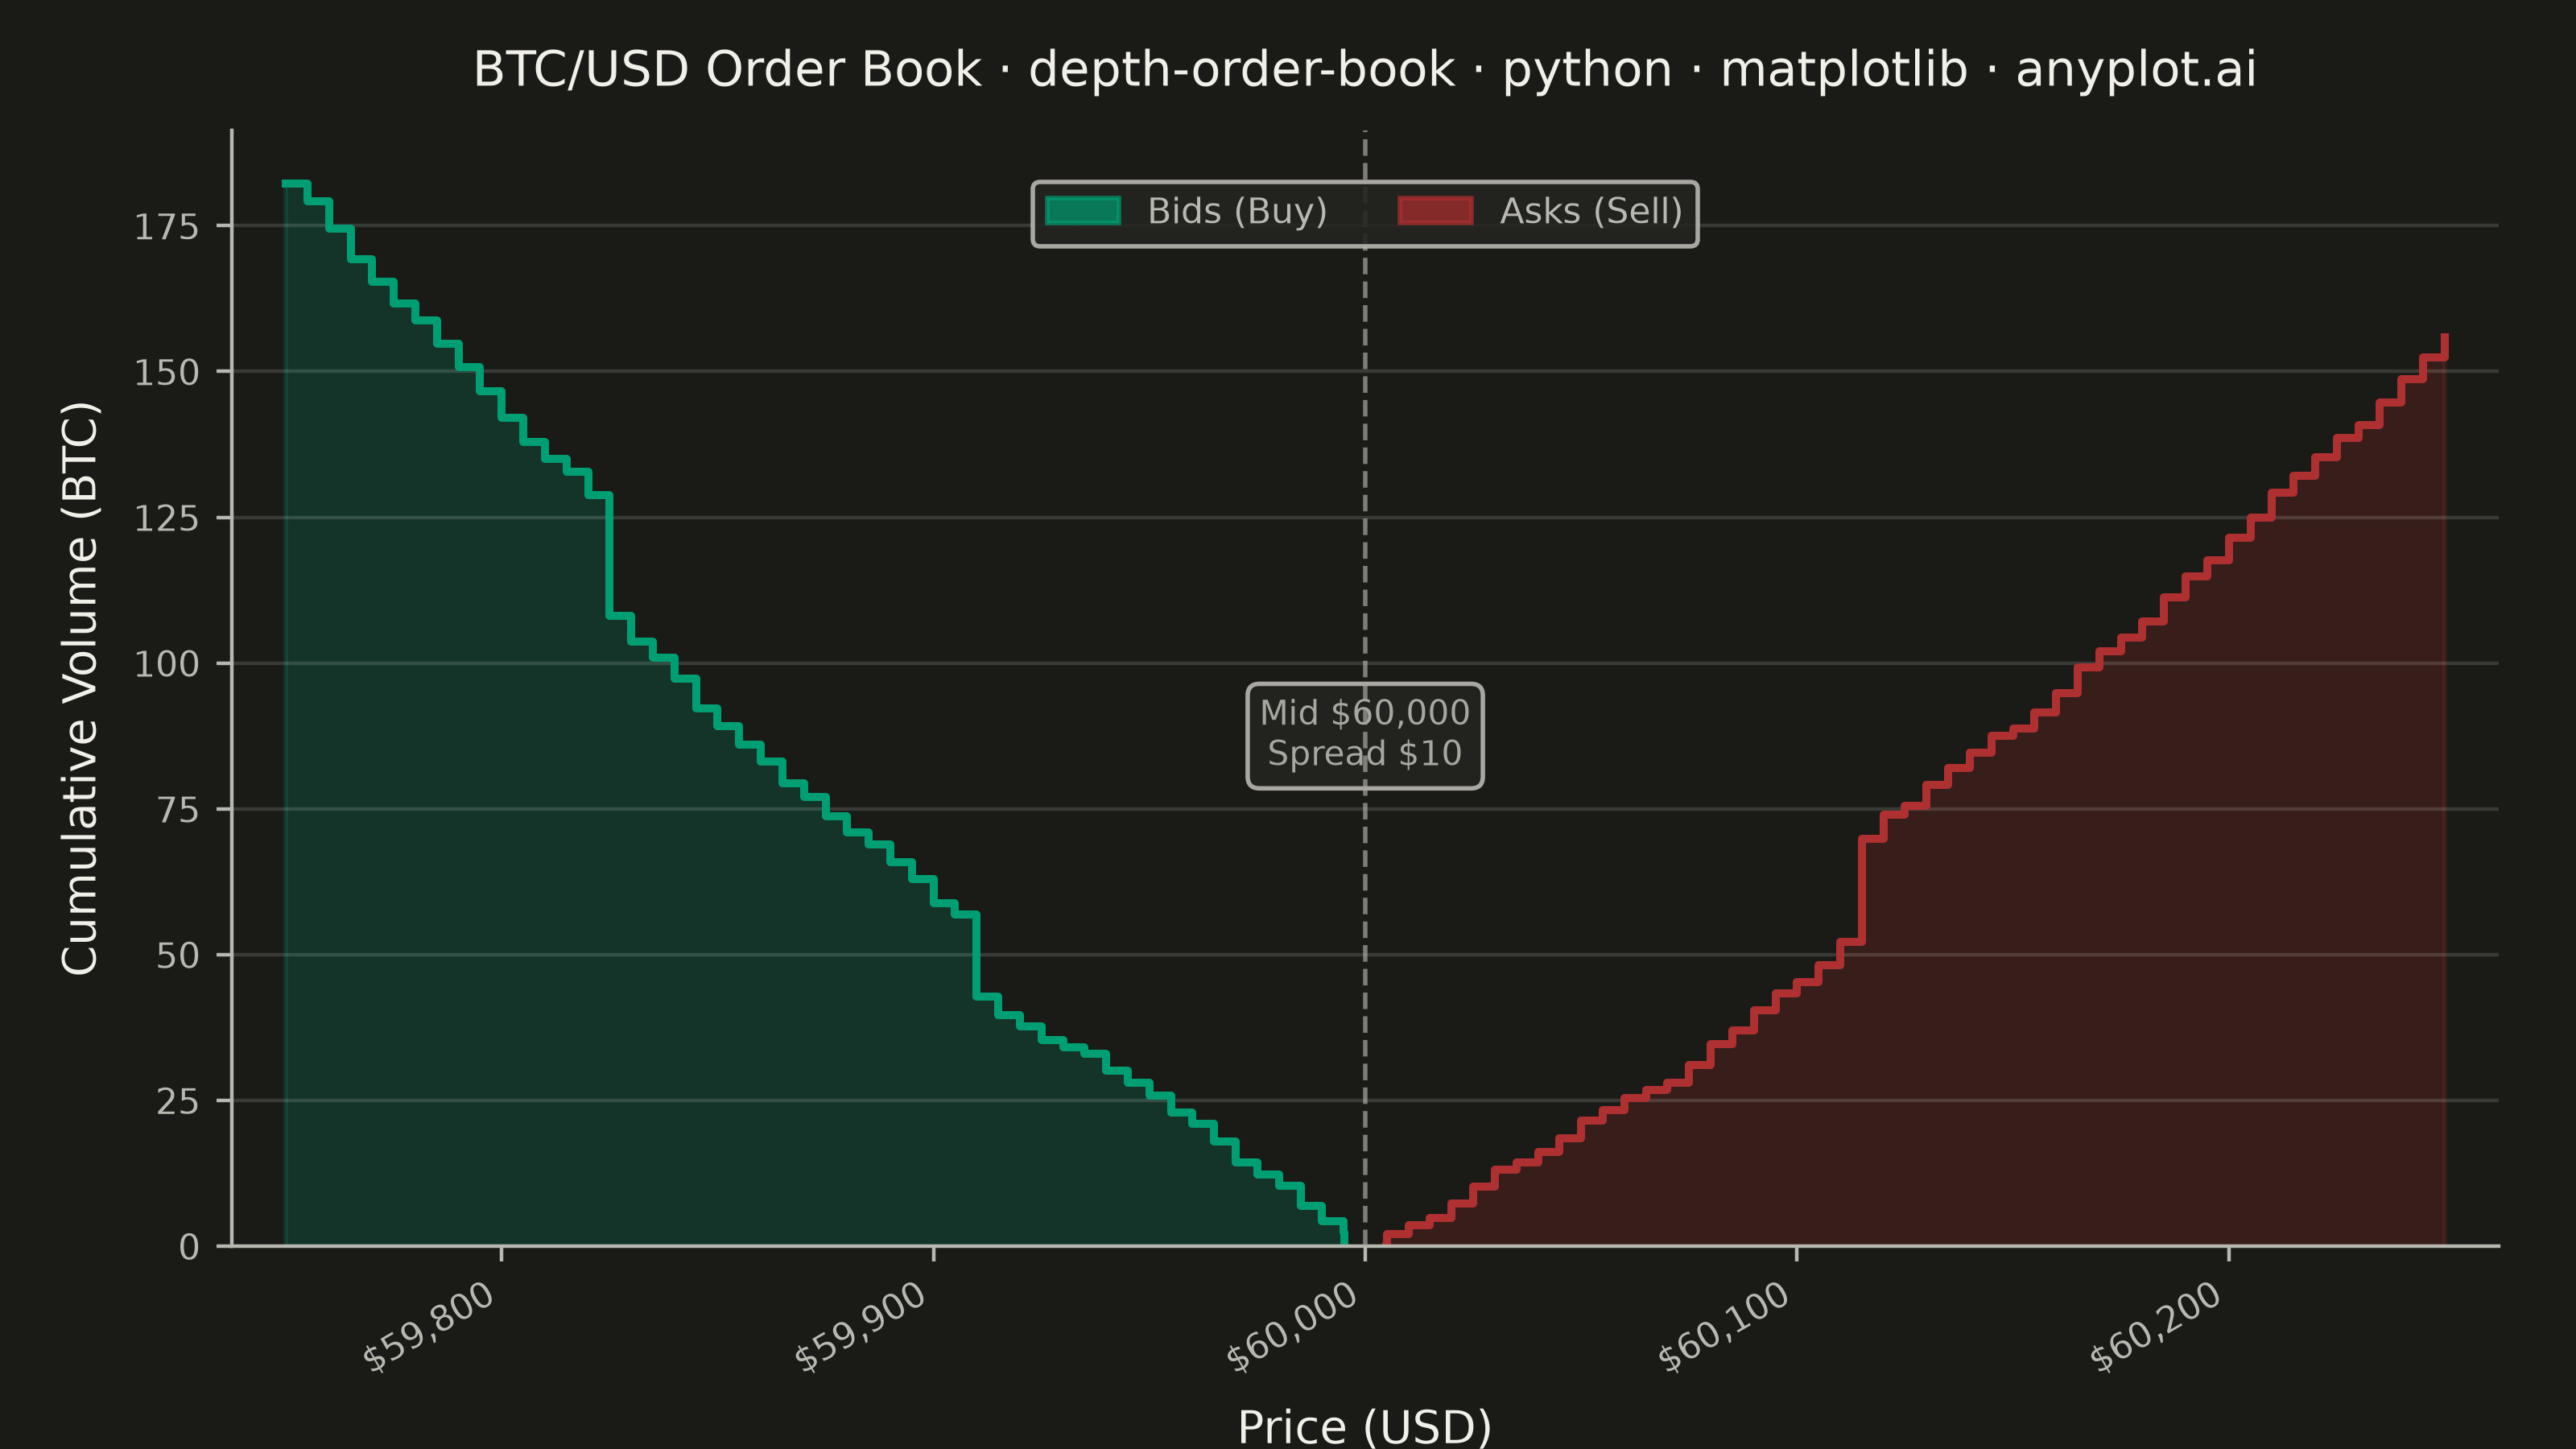
A market depth chart visualizes a snapshot of an exchange order book as two cumulative step areas around the mid price. Cumulative bid volume rises as a green step area to the left of the mid price (summing buy orders from the best bid downward), while cumulative ask volume rises as a red step area to the right (summing sell orders from the best ask upward). The bid-ask spread appears as a gap at the center, with price on the x-axis and cumulative quantity on the y-axis. This is the iconic chart found in nearly every trading and crypto exchange UI, revealing liquidity, support/resistance walls, and the imbalance between buying and selling pressure.
""" anyplot.ai
depth-order-book: Order Book Depth Chart
Library: matplotlib 3.11.0 | Python 3.13.13
Quality: 89/100 | Created: 2026-06-15
"""

import os

import matplotlib.patches as mpatches
import matplotlib.pyplot as plt
import matplotlib.ticker as mticker
import numpy as np


# Theme tokens
THEME = os.getenv("ANYPLOT_THEME", "light")
PAGE_BG = "#FAF8F1" if THEME == "light" else "#1A1A17"
ELEVATED_BG = "#FFFDF6" if THEME == "light" else "#242420"
INK = "#1A1A17" if THEME == "light" else "#F0EFE8"
INK_SOFT = "#4A4A44" if THEME == "light" else "#B8B7B0"
INK_MUTED = "#6B6A63" if THEME == "light" else "#A8A79F"

# Imprint palette — semantic mapping: buy=green (pos 1), sell=red (pos 5)
BID_COLOR = "#009E73"  # Imprint position 1 — bids / buy side
ASK_COLOR = "#AE3030"  # Imprint position 5 — asks / sell side (semantic: loss/sell)

# Data — synthetic BTC/USD order book snapshot
np.random.seed(42)
MID_PRICE = 60_000.0
SPREAD = 10.0  # $10 bid-ask spread
BEST_BID = MID_PRICE - SPREAD / 2  # 59995
BEST_ASK = MID_PRICE + SPREAD / 2  # 60005
N_LEVELS = 50
TICK = 5.0  # $5 price tick spacing

# Bid side: prices descend from BEST_BID outward (index 0 = best bid)
bid_prices = BEST_BID - np.arange(N_LEVELS) * TICK
bid_qty = np.abs(np.random.normal(2.0, 0.8, N_LEVELS))
bid_qty += 0.05 * np.arange(N_LEVELS)  # modest growth toward worse prices
bid_qty[18] += 12.0  # support wall at ~$59,905
bid_qty[35] += 18.0  # major support wall at ~$59,820
bid_cum = np.cumsum(bid_qty)

# Ask side: prices ascend from BEST_ASK outward (index 0 = best ask)
ask_prices = BEST_ASK + np.arange(N_LEVELS) * TICK
ask_qty = np.abs(np.random.normal(1.8, 0.9, N_LEVELS))
ask_qty += 0.04 * np.arange(N_LEVELS)
ask_qty[22] += 15.0  # resistance wall at ~$60,115
ask_cum = np.cumsum(ask_qty)

# Step chart data — both sides in ascending price order (left to right)
# A 0.1 USD epsilon point inside the spread creates a clean vertical wall
# at the best bid/ask without being visible at chart scale (~$250 range).
BID_WALL = BEST_BID + 0.1
ASK_WALL = BEST_ASK - 0.1

bid_x = np.append(bid_prices[::-1], BID_WALL)
bid_y = np.append(bid_cum[::-1], 0.0)

ask_x = np.concatenate([[ASK_WALL], ask_prices])
ask_y = np.concatenate([[0.0], ask_cum])

# Plot
fig, ax = plt.subplots(figsize=(8, 4.5), dpi=400, facecolor=PAGE_BG)
ax.set_facecolor(PAGE_BG)

# Bid area — descending staircase from left toward mid price
ax.fill_between(bid_x, bid_y, step="post", color=BID_COLOR, alpha=0.2)
ax.fill_between(bid_x, bid_y, step="post", facecolor="none", edgecolor=BID_COLOR, linewidth=0.5, hatch="\\\\")
ax.step(bid_x, bid_y, where="post", color=BID_COLOR, linewidth=2.0)

# Ask area — ascending staircase from mid price toward right
ax.fill_between(ask_x, ask_y, step="post", color=ASK_COLOR, alpha=0.2)
ax.fill_between(ask_x, ask_y, step="post", facecolor="none", edgecolor=ASK_COLOR, linewidth=0.5, hatch="////")
ax.step(ask_x, ask_y, where="post", color=ASK_COLOR, linewidth=2.0)

# Mid price dashed vertical line
ax.axvline(MID_PRICE, color=INK_MUTED, linewidth=1.0, linestyle="--", alpha=0.7, zorder=5)

# Mid price annotation
y_top = max(bid_cum[-1], ask_cum[-1])
ax.annotate(
    f"Mid ${MID_PRICE:,.0f}\nSpread ${SPREAD:.0f}",
    xy=(MID_PRICE + 25, y_top * 0.45),
    fontsize=7.5,
    color=INK_MUTED,
    ha="left",
    va="center",
    bbox={"facecolor": ELEVATED_BG, "edgecolor": INK_SOFT, "alpha": 0.9, "boxstyle": "round,pad=0.35"},
)

# Style
title = "BTC/USD Order Book · depth-order-book · python · matplotlib · anyplot.ai"
n = len(title)
title_fontsize = max(8, round(12 * 67 / n)) if n > 67 else 12

ax.set_title(title, fontsize=title_fontsize, fontweight="medium", color=INK, pad=10)
ax.set_xlabel("Price (USD)", fontsize=10, color=INK, labelpad=6)
ax.set_ylabel("Cumulative Volume (BTC)", fontsize=10, color=INK, labelpad=6)
ax.tick_params(axis="both", labelsize=8, colors=INK_SOFT, labelcolor=INK_SOFT)
ax.spines["top"].set_visible(False)
ax.spines["right"].set_visible(False)
for spine in ("left", "bottom"):
    ax.spines[spine].set_color(INK_SOFT)

ax.yaxis.grid(True, alpha=0.15, linewidth=0.8, color=INK)
ax.set_ylim(bottom=0)

# Center the x-axis on mid price with balanced wings
wing = N_LEVELS * TICK * 1.05
ax.set_xlim(MID_PRICE - wing, MID_PRICE + wing)
ax.xaxis.set_major_formatter(mticker.FuncFormatter(lambda x, _: f"${x:,.0f}"))
plt.setp(ax.get_xticklabels(), rotation=30, ha="right")

# Legend
bid_patch = mpatches.Patch(facecolor=BID_COLOR, edgecolor=BID_COLOR, alpha=0.7, hatch="\\\\", label="Bids (Buy)")
ask_patch = mpatches.Patch(facecolor=ASK_COLOR, edgecolor=ASK_COLOR, alpha=0.7, hatch="////", label="Asks (Sell)")
leg = ax.legend(
    handles=[bid_patch, ask_patch], fontsize=8, loc="upper center", ncol=2, framealpha=0.9, bbox_to_anchor=(0.5, 0.97)
)
leg.get_frame().set_facecolor(ELEVATED_BG)
leg.get_frame().set_edgecolor(INK_SOFT)
plt.setp(leg.get_texts(), color=INK_SOFT)

fig.subplots_adjust(left=0.09, right=0.97, top=0.91, bottom=0.14)

# Save
plt.savefig(f"plot-{THEME}.png", dpi=400, facecolor=PAGE_BG)
plt.close()
Runnable source as JSON, for any HTTP client: https://api.anyplot.ai/specs/depth-order-book/matplotlib/code. Any spec id and library id listed in llms-full.txt fit the same URL shape; every URL below is complete and callable.
{
  "spec_id": "depth-order-book",
  "language": "python",
  "library": "matplotlib",
  "page": "https://anyplot.ai/depth-order-book/python/matplotlib",
  "hub": "https://anyplot.ai/depth-order-book",
  "code_json": "https://api.anyplot.ai/specs/depth-order-book/matplotlib/code",
  "spec_json": "https://api.anyplot.ai/specs/depth-order-book",
  "render_light_png": "https://storage.googleapis.com/anyplot-images/plots/depth-order-book/python/matplotlib/plot-light.png",
  "render_dark_png": "https://storage.googleapis.com/anyplot-images/plots/depth-order-book/python/matplotlib/plot-dark.png",
  "quality_score": 89.0,
  "license": "MIT",
  "guide": "https://anyplot.ai/llms.txt"
}
Part of Order Book Depth Chart on anyplot.ai.