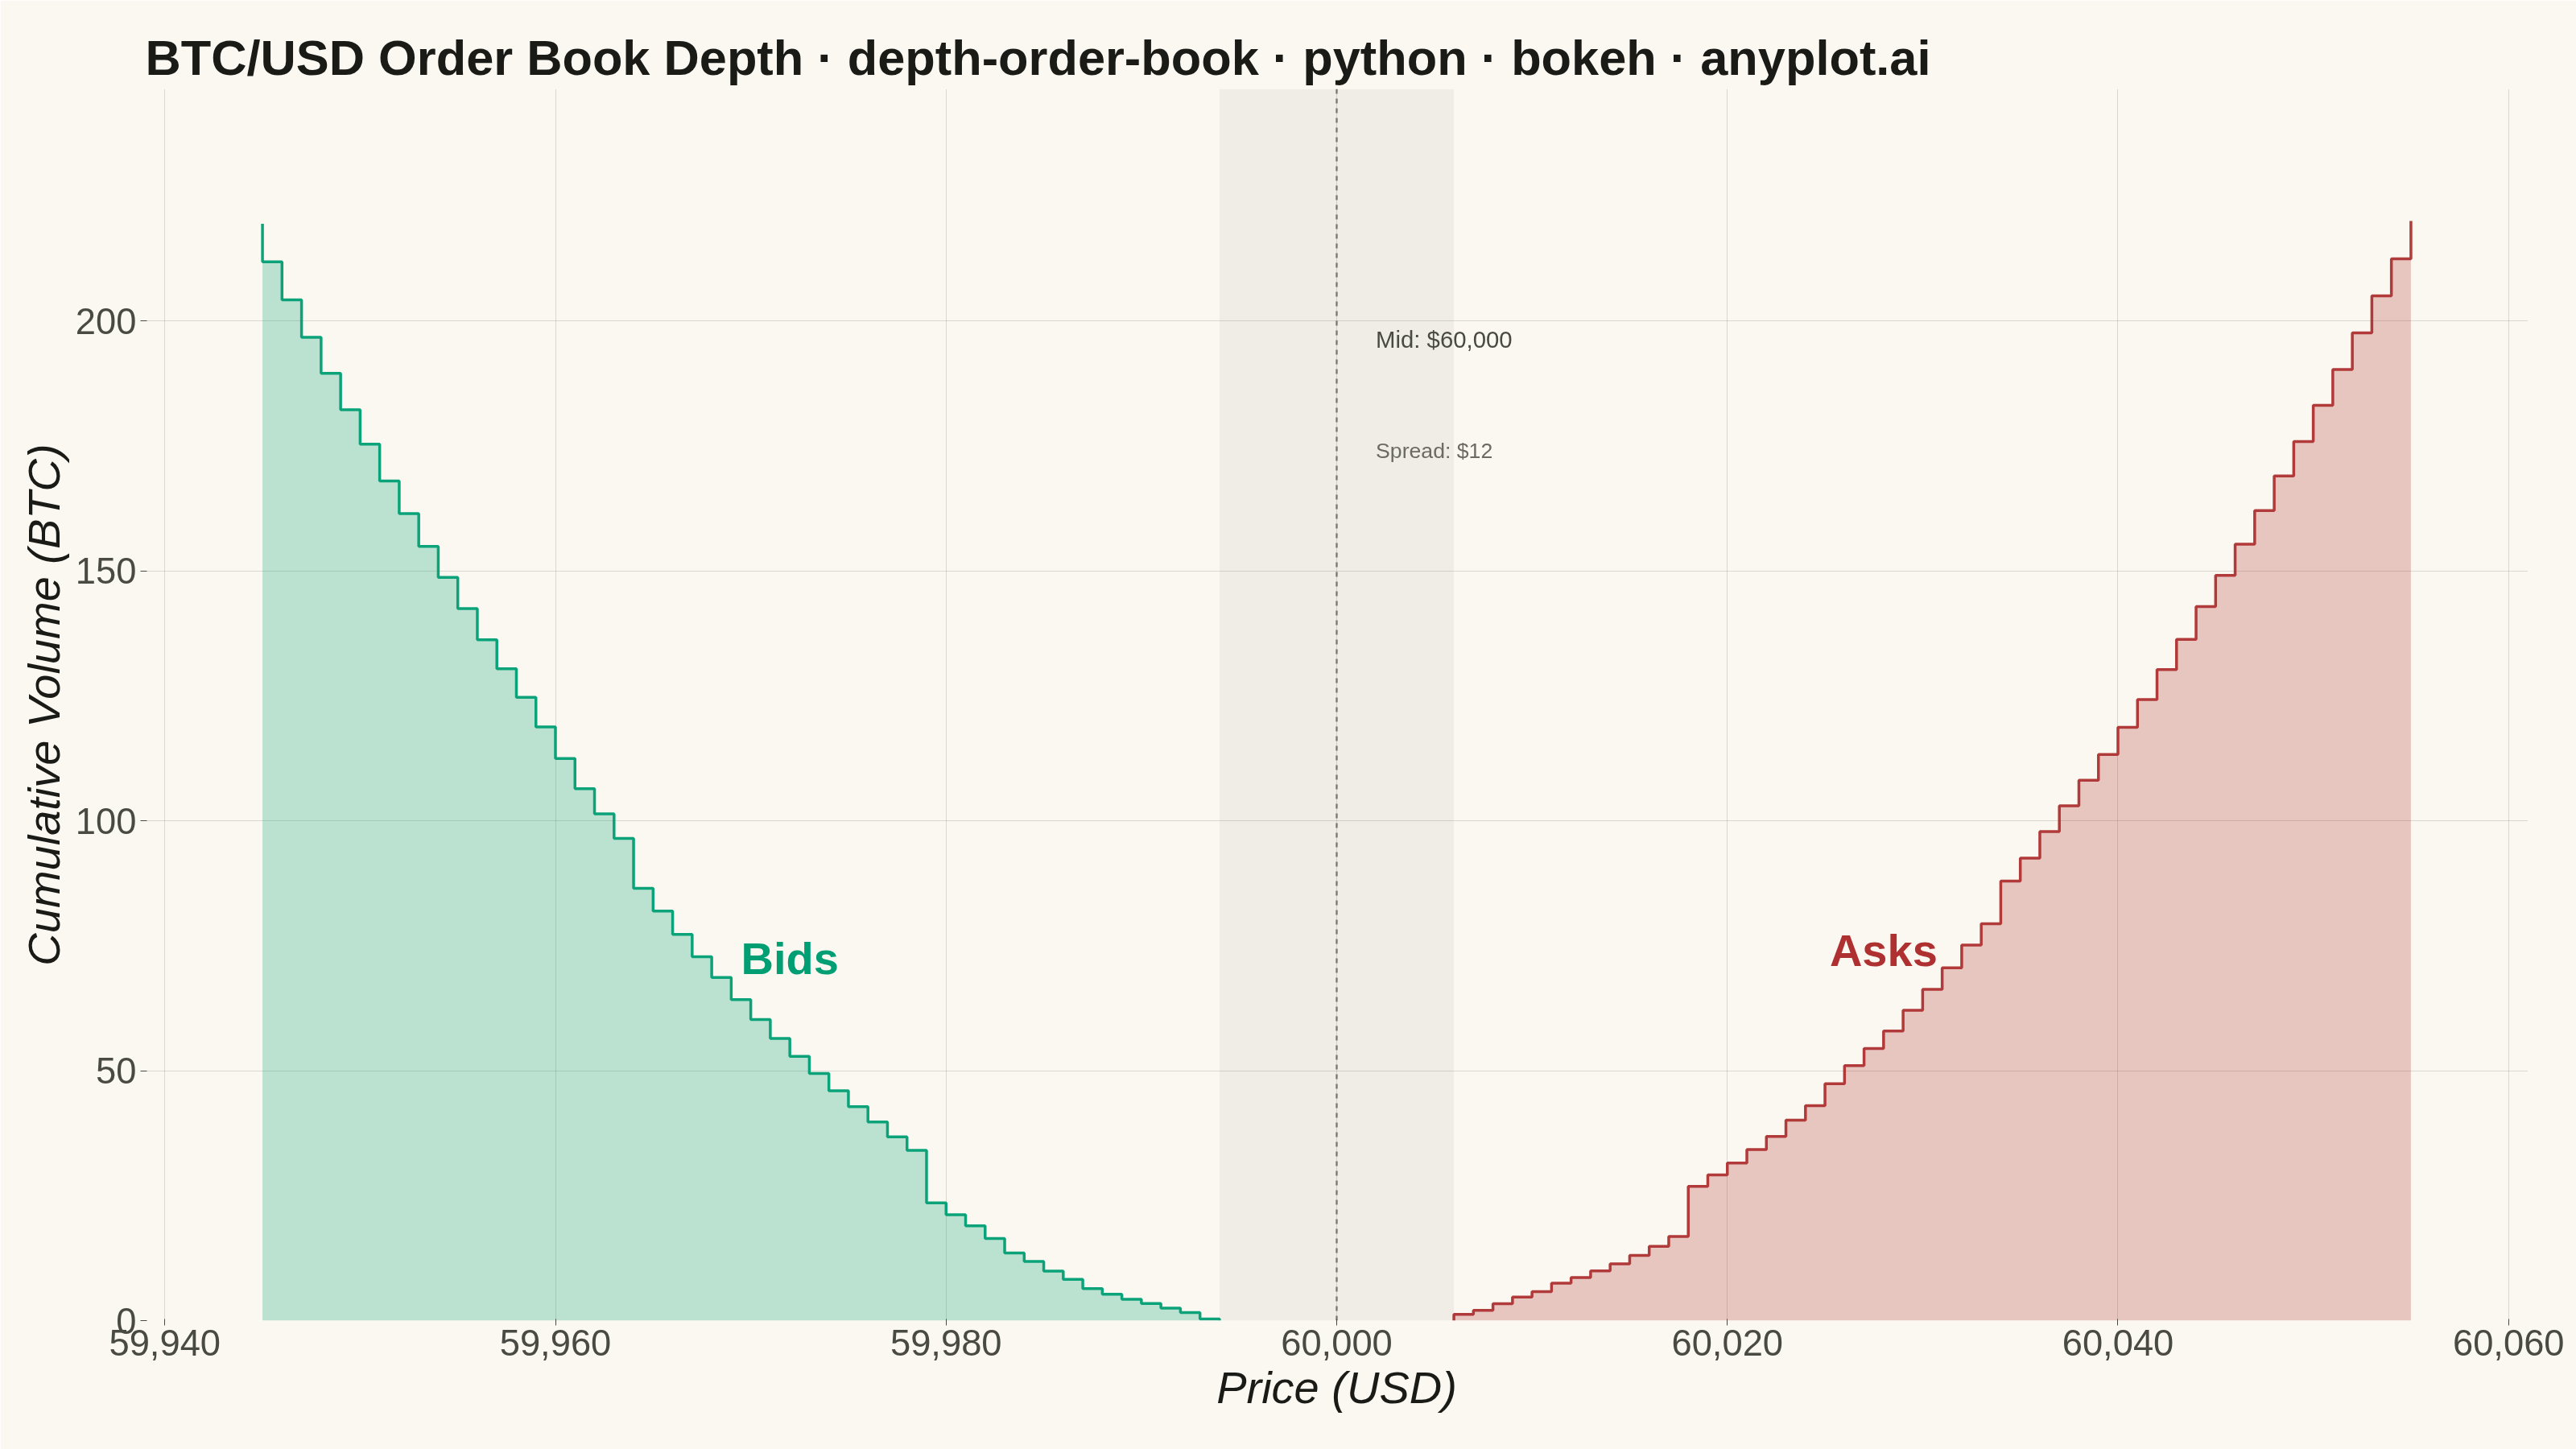
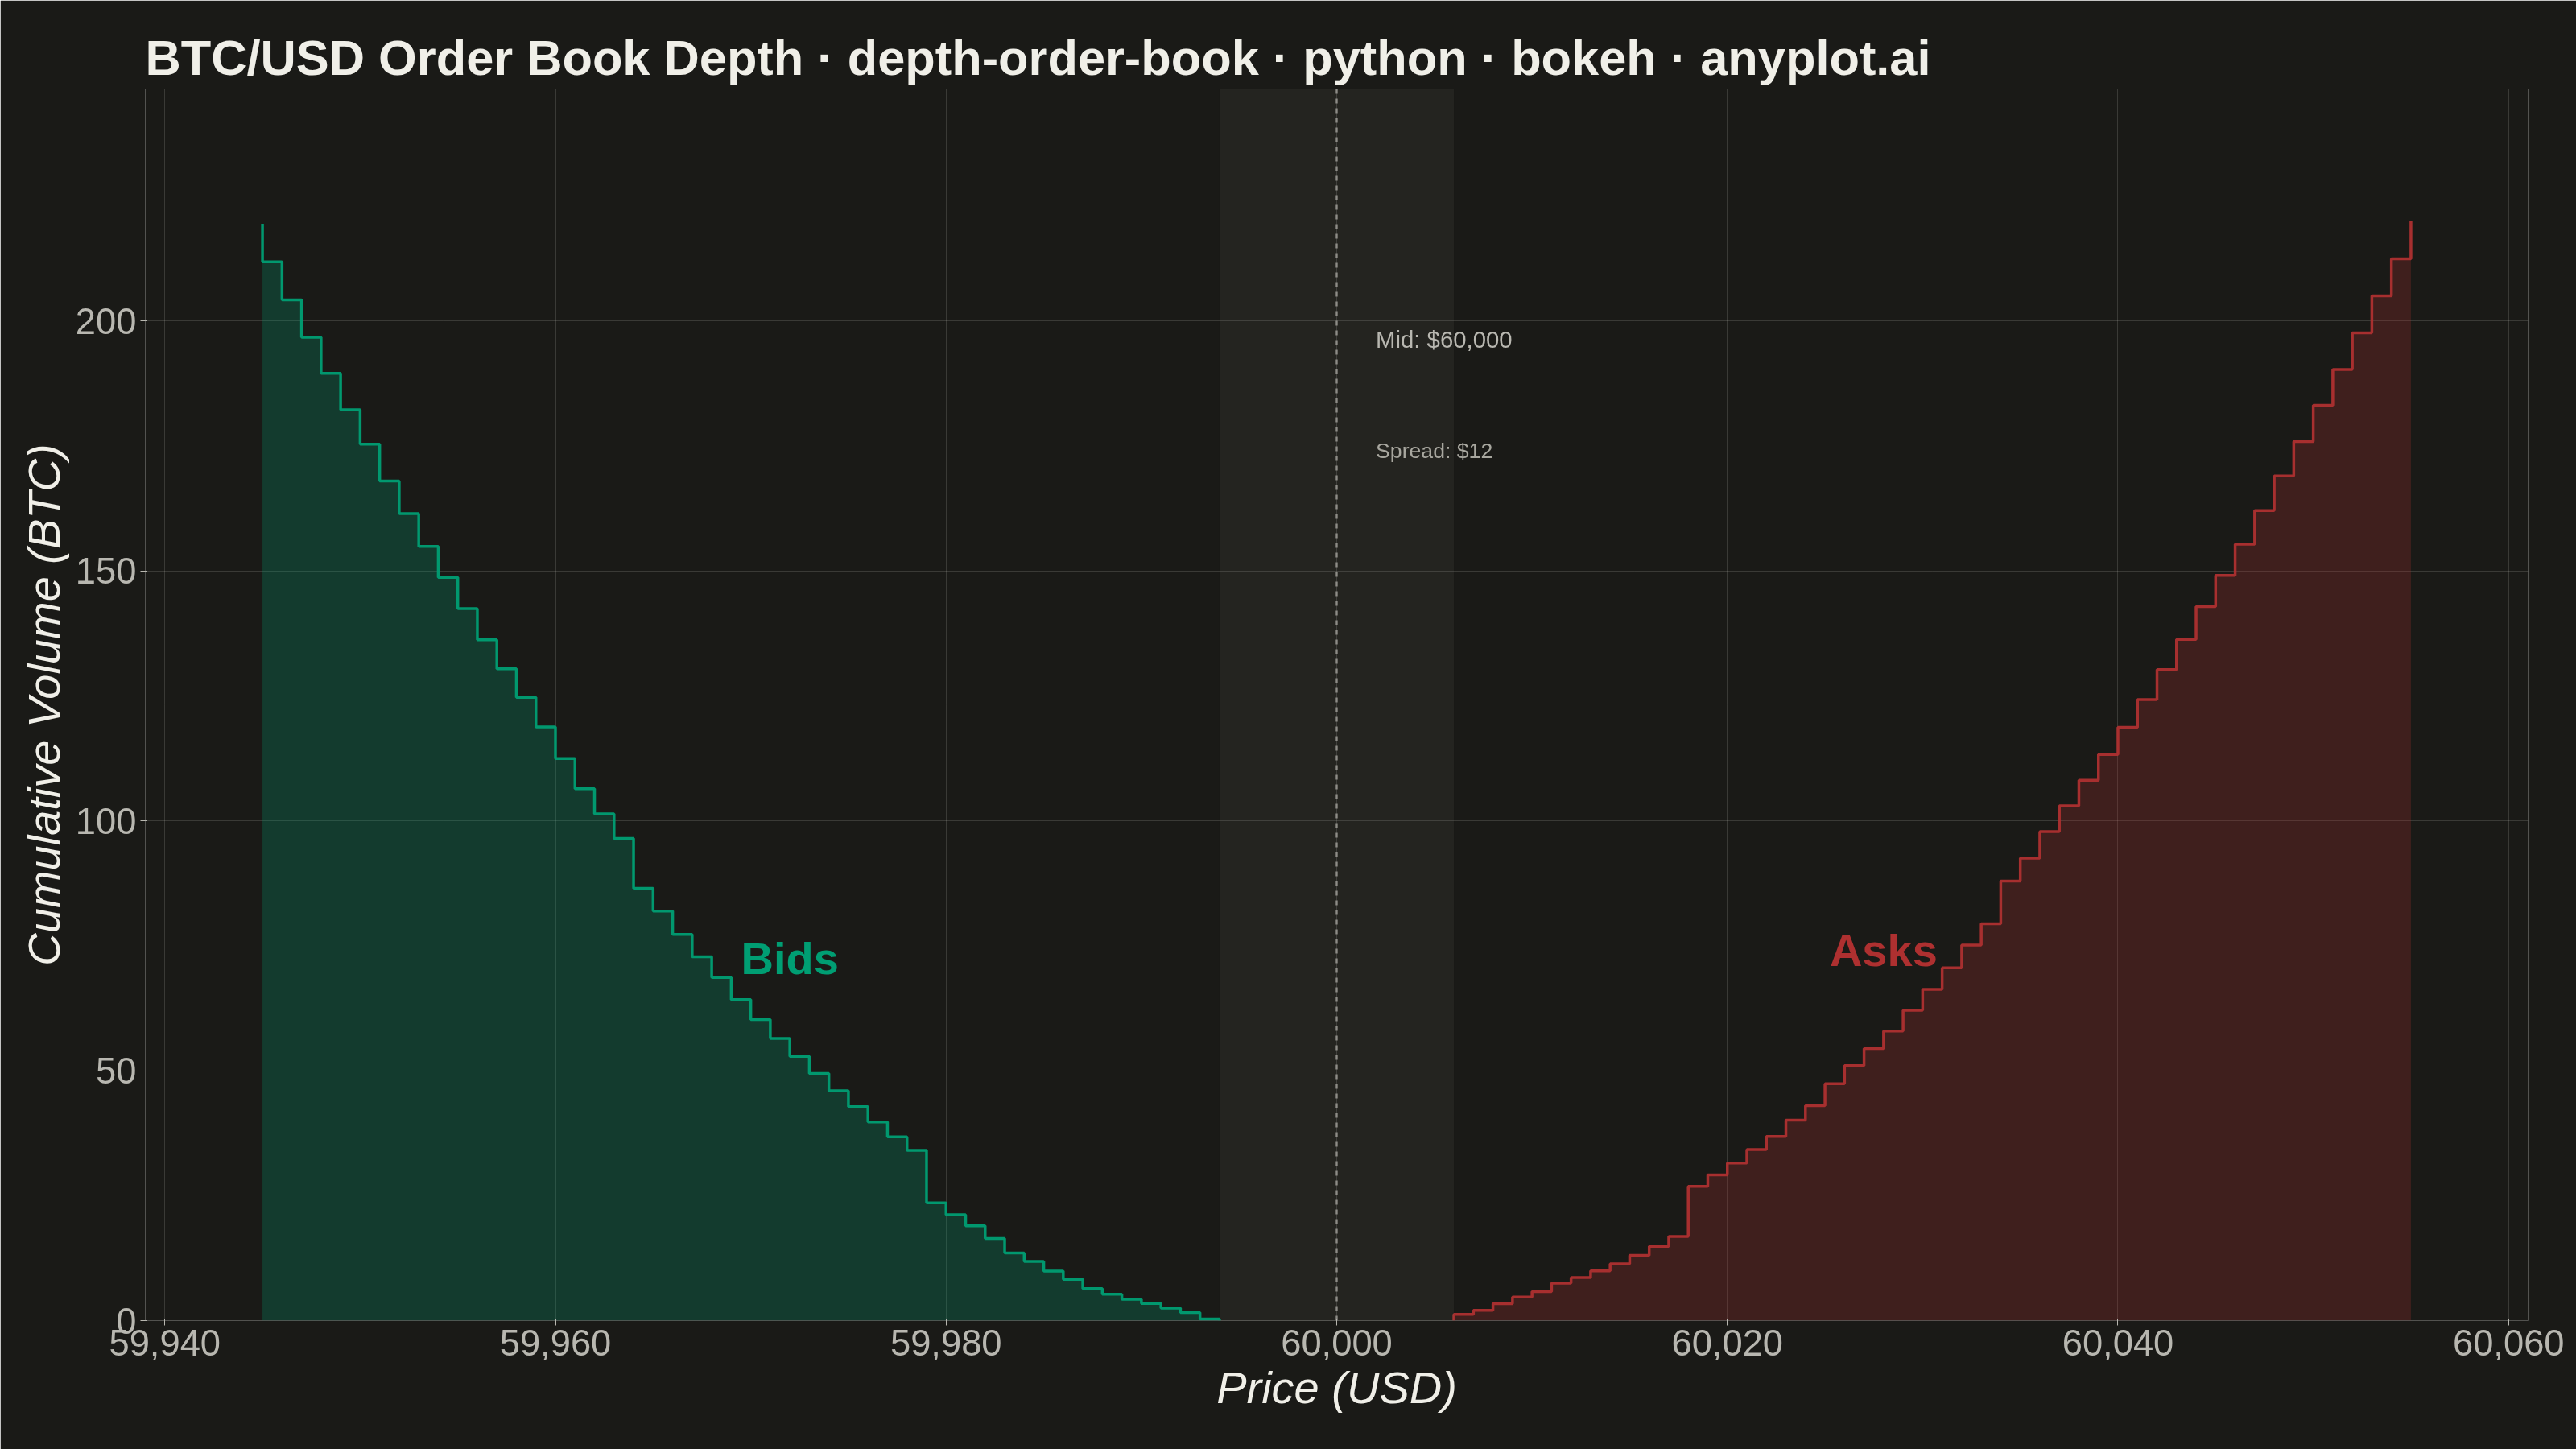
A market depth chart visualizes a snapshot of an exchange order book as two cumulative step areas around the mid price. Cumulative bid volume rises as a green step area to the left of the mid price (summing buy orders from the best bid downward), while cumulative ask volume rises as a red step area to the right (summing sell orders from the best ask upward). The bid-ask spread appears as a gap at the center, with price on the x-axis and cumulative quantity on the y-axis. This is the iconic chart found in nearly every trading and crypto exchange UI, revealing liquidity, support/resistance walls, and the imbalance between buying and selling pressure.
""" anyplot.ai
depth-order-book: Order Book Depth Chart
Library: bokeh 3.9.1 | Python 3.13.13
Quality: 90/100 | Created: 2026-06-15
"""

import os
import sys


# Prevent self-import: this file is named bokeh.py, which shadows the installed
# bokeh package when its directory sits at the front of sys.path.
_this_dir = os.path.dirname(os.path.abspath(__file__))
sys.path = [p for p in sys.path if os.path.abspath(p or ".") != _this_dir]

import time
from pathlib import Path

import numpy as np
from bokeh.io import output_file, save
from bokeh.models import BoxAnnotation, Label, NumeralTickFormatter, Range1d, Span
from bokeh.plotting import figure
from selenium import webdriver
from selenium.webdriver.chrome.options import Options


# Theme
THEME = os.getenv("ANYPLOT_THEME", "light")
PAGE_BG = "#FAF8F1" if THEME == "light" else "#1A1A17"
ELEVATED_BG = "#FFFDF6" if THEME == "light" else "#242420"
INK = "#1A1A17" if THEME == "light" else "#F0EFE8"
INK_SOFT = "#4A4A44" if THEME == "light" else "#B8B7B0"
INK_MUTED = "#6B6A63" if THEME == "light" else "#A8A79F"

# Semantic colors — bid=green (buy/support), ask=red (sell/resistance)
BID_COLOR = "#009E73"  # Imprint position 1
ASK_COLOR = "#AE3030"  # Imprint position 5, semantic anchor for sell/loss

# Data — BTC/USD snapshot, 50 levels per side, $1 tick increments
np.random.seed(42)
mid_price = 60_000.0
spread = 12.0
n_levels = 50

bid_prices = mid_price - spread / 2 - np.arange(n_levels)
ask_prices = mid_price + spread / 2 + np.arange(n_levels)

# Volume grows away from mid price (deeper liquidity at worse prices)
bid_qty = 0.05 + np.arange(1, n_levels + 1) * 0.15 + np.random.exponential(0.3, n_levels)
ask_qty = 0.05 + np.arange(1, n_levels + 1) * 0.15 + np.random.exponential(0.3, n_levels)

# Liquidity walls at specific levels
bid_qty[15] += 8.0
bid_qty[30] += 5.0
ask_qty[12] += 7.5
ask_qty[28] += 4.0

cum_bid = np.cumsum(bid_qty)
cum_ask = np.cumsum(ask_qty)
max_cum = max(cum_bid[-1], cum_ask[-1])

# Build bid step polygon (prices decrease from best bid outward)
x_bid_poly = [bid_prices[0]]
y_bid_poly = [0.0]
for i in range(n_levels):
    x_bid_poly.append(bid_prices[i])
    y_bid_poly.append(cum_bid[i])
    if i < n_levels - 1:
        x_bid_poly.append(bid_prices[i + 1])
        y_bid_poly.append(cum_bid[i])
x_bid_poly.append(bid_prices[-1])
y_bid_poly.append(0.0)

# Build ask step polygon (prices increase from best ask outward)
x_ask_poly = [ask_prices[0]]
y_ask_poly = [0.0]
for i in range(n_levels):
    x_ask_poly.append(ask_prices[i])
    y_ask_poly.append(cum_ask[i])
    if i < n_levels - 1:
        x_ask_poly.append(ask_prices[i + 1])
        y_ask_poly.append(cum_ask[i])
x_ask_poly.append(ask_prices[-1])
y_ask_poly.append(0.0)

# Title — scaled for length
title = "BTC/USD Order Book Depth · depth-order-book · python · bokeh · anyplot.ai"
n_chars = len(title)
title_fontsize = f"{max(34, round(50 * 67 / n_chars))}pt"

# Figure
p = figure(
    width=3200,
    height=1800,
    title=title,
    x_axis_label="Price (USD)",
    y_axis_label="Cumulative Volume (BTC)",
    toolbar_location=None,
    x_range=Range1d(bid_prices[-1] - 6, ask_prices[-1] + 6),
    y_range=Range1d(0, max_cum * 1.12),
    min_border_bottom=160,
    min_border_left=180,
    min_border_top=110,
    min_border_right=60,
)

# Bid fill + staircase outline
p.patch(x=x_bid_poly, y=y_bid_poly, fill_color=BID_COLOR, fill_alpha=0.25, line_color=None)
p.line(x=x_bid_poly[:-1], y=y_bid_poly[:-1], line_color=BID_COLOR, line_width=3.5, line_alpha=0.95)

# Ask fill + staircase outline
p.patch(x=x_ask_poly, y=y_ask_poly, fill_color=ASK_COLOR, fill_alpha=0.25, line_color=None)
p.line(x=x_ask_poly[:-1], y=y_ask_poly[:-1], line_color=ASK_COLOR, line_width=3.5, line_alpha=0.95)

# Spread gap highlight — BoxAnnotation covers the bid-ask spread region
p.add_layout(
    BoxAnnotation(left=bid_prices[0], right=ask_prices[0], fill_color=INK_MUTED, fill_alpha=0.07, line_color=None)
)

# Mid price dashed vertical line
p.add_layout(
    Span(
        location=mid_price, dimension="height", line_color=INK_SOFT, line_dash="dashed", line_width=2.5, line_alpha=0.65
    )
)

# Mid price and spread annotations — secondary info uses smaller text for hierarchy
p.add_layout(
    Label(
        x=mid_price + 2.0,
        y=max_cum * 0.88,
        text=f"Mid: ${mid_price:,.0f}",
        text_font_size="22pt",
        text_color=INK_SOFT,
        text_align="left",
        background_fill_color=None,
    )
)
p.add_layout(
    Label(
        x=mid_price + 2.0,
        y=max_cum * 0.78,
        text=f"Spread: ${spread:.0f}",
        text_font_size="20pt",
        text_color=INK_MUTED,
        text_align="left",
        background_fill_color=None,
    )
)

# Side labels — direct labeling on each curve at the midpoint
p.add_layout(
    Label(
        x=bid_prices[22],
        y=cum_bid[22] + max_cum * 0.05,
        text="Bids",
        text_font_size="42pt",
        text_color=BID_COLOR,
        text_align="center",
        text_font_style="bold",
        background_fill_color=None,
    )
)
p.add_layout(
    Label(
        x=ask_prices[22],
        y=cum_ask[22] + max_cum * 0.05,
        text="Asks",
        text_font_size="42pt",
        text_color=ASK_COLOR,
        text_align="center",
        text_font_style="bold",
        background_fill_color=None,
    )
)

# Theme chrome
p.background_fill_color = PAGE_BG
p.border_fill_color = PAGE_BG
p.outline_line_color = None

p.title.text_color = INK
p.title.text_font_size = title_fontsize
p.title.text_font_style = "bold"

p.xaxis.axis_label_text_color = INK
p.yaxis.axis_label_text_color = INK
p.xaxis.axis_label_text_font_size = "42pt"
p.yaxis.axis_label_text_font_size = "42pt"
p.xaxis.major_label_text_color = INK_SOFT
p.yaxis.major_label_text_color = INK_SOFT
p.xaxis.major_label_text_font_size = "34pt"
p.yaxis.major_label_text_font_size = "34pt"
# Remove all axis spine lines for a clean open look — data and tick labels provide structure
p.xaxis.axis_line_color = None
p.yaxis.axis_line_color = None
p.xaxis.major_tick_line_color = INK_SOFT
p.yaxis.major_tick_line_color = INK_SOFT
p.xaxis.minor_tick_line_color = None
p.yaxis.minor_tick_line_color = None

p.xgrid.grid_line_color = INK
p.ygrid.grid_line_color = INK
p.xgrid.grid_line_alpha = 0.15
p.ygrid.grid_line_alpha = 0.15

p.xaxis.formatter = NumeralTickFormatter(format="0,0")

# Save HTML artifact
output_file(f"plot-{THEME}.html")
save(p)

# Screenshot via headless Chrome (Selenium)
W, H = 3200, 1800
opts = Options()
for arg in (
    "--headless=new",
    "--no-sandbox",
    "--disable-dev-shm-usage",
    "--disable-gpu",
    f"--window-size={W},{H}",
    "--hide-scrollbars",
):
    opts.add_argument(arg)
driver = webdriver.Chrome(options=opts)
# CDP override forces an exact W×H viewport regardless of outer window chrome
driver.execute_cdp_cmd(
    "Emulation.setDeviceMetricsOverride", {"width": W, "height": H, "deviceScaleFactor": 1, "mobile": False}
)
driver.get(f"file://{Path(f'plot-{THEME}.html').resolve()}")
time.sleep(3)
driver.save_screenshot(f"plot-{THEME}.png")
driver.quit()
Runnable source as JSON, for any HTTP client: https://api.anyplot.ai/specs/depth-order-book/bokeh/code. Any spec id and library id listed in llms-full.txt fit the same URL shape; every URL below is complete and callable.
{
  "spec_id": "depth-order-book",
  "language": "python",
  "library": "bokeh",
  "page": "https://anyplot.ai/depth-order-book/python/bokeh",
  "hub": "https://anyplot.ai/depth-order-book",
  "code_json": "https://api.anyplot.ai/specs/depth-order-book/bokeh/code",
  "spec_json": "https://api.anyplot.ai/specs/depth-order-book",
  "render_light_png": "https://storage.googleapis.com/anyplot-images/plots/depth-order-book/python/bokeh/plot-light.png",
  "render_dark_png": "https://storage.googleapis.com/anyplot-images/plots/depth-order-book/python/bokeh/plot-dark.png",
  "interactive_light_html": "https://storage.googleapis.com/anyplot-images/plots/depth-order-book/python/bokeh/plot-light.html",
  "interactive_dark_html": "https://storage.googleapis.com/anyplot-images/plots/depth-order-book/python/bokeh/plot-dark.html",
  "quality_score": 90.0,
  "license": "MIT",
  "guide": "https://anyplot.ai/llms.txt"
}
Part of Order Book Depth Chart on anyplot.ai.