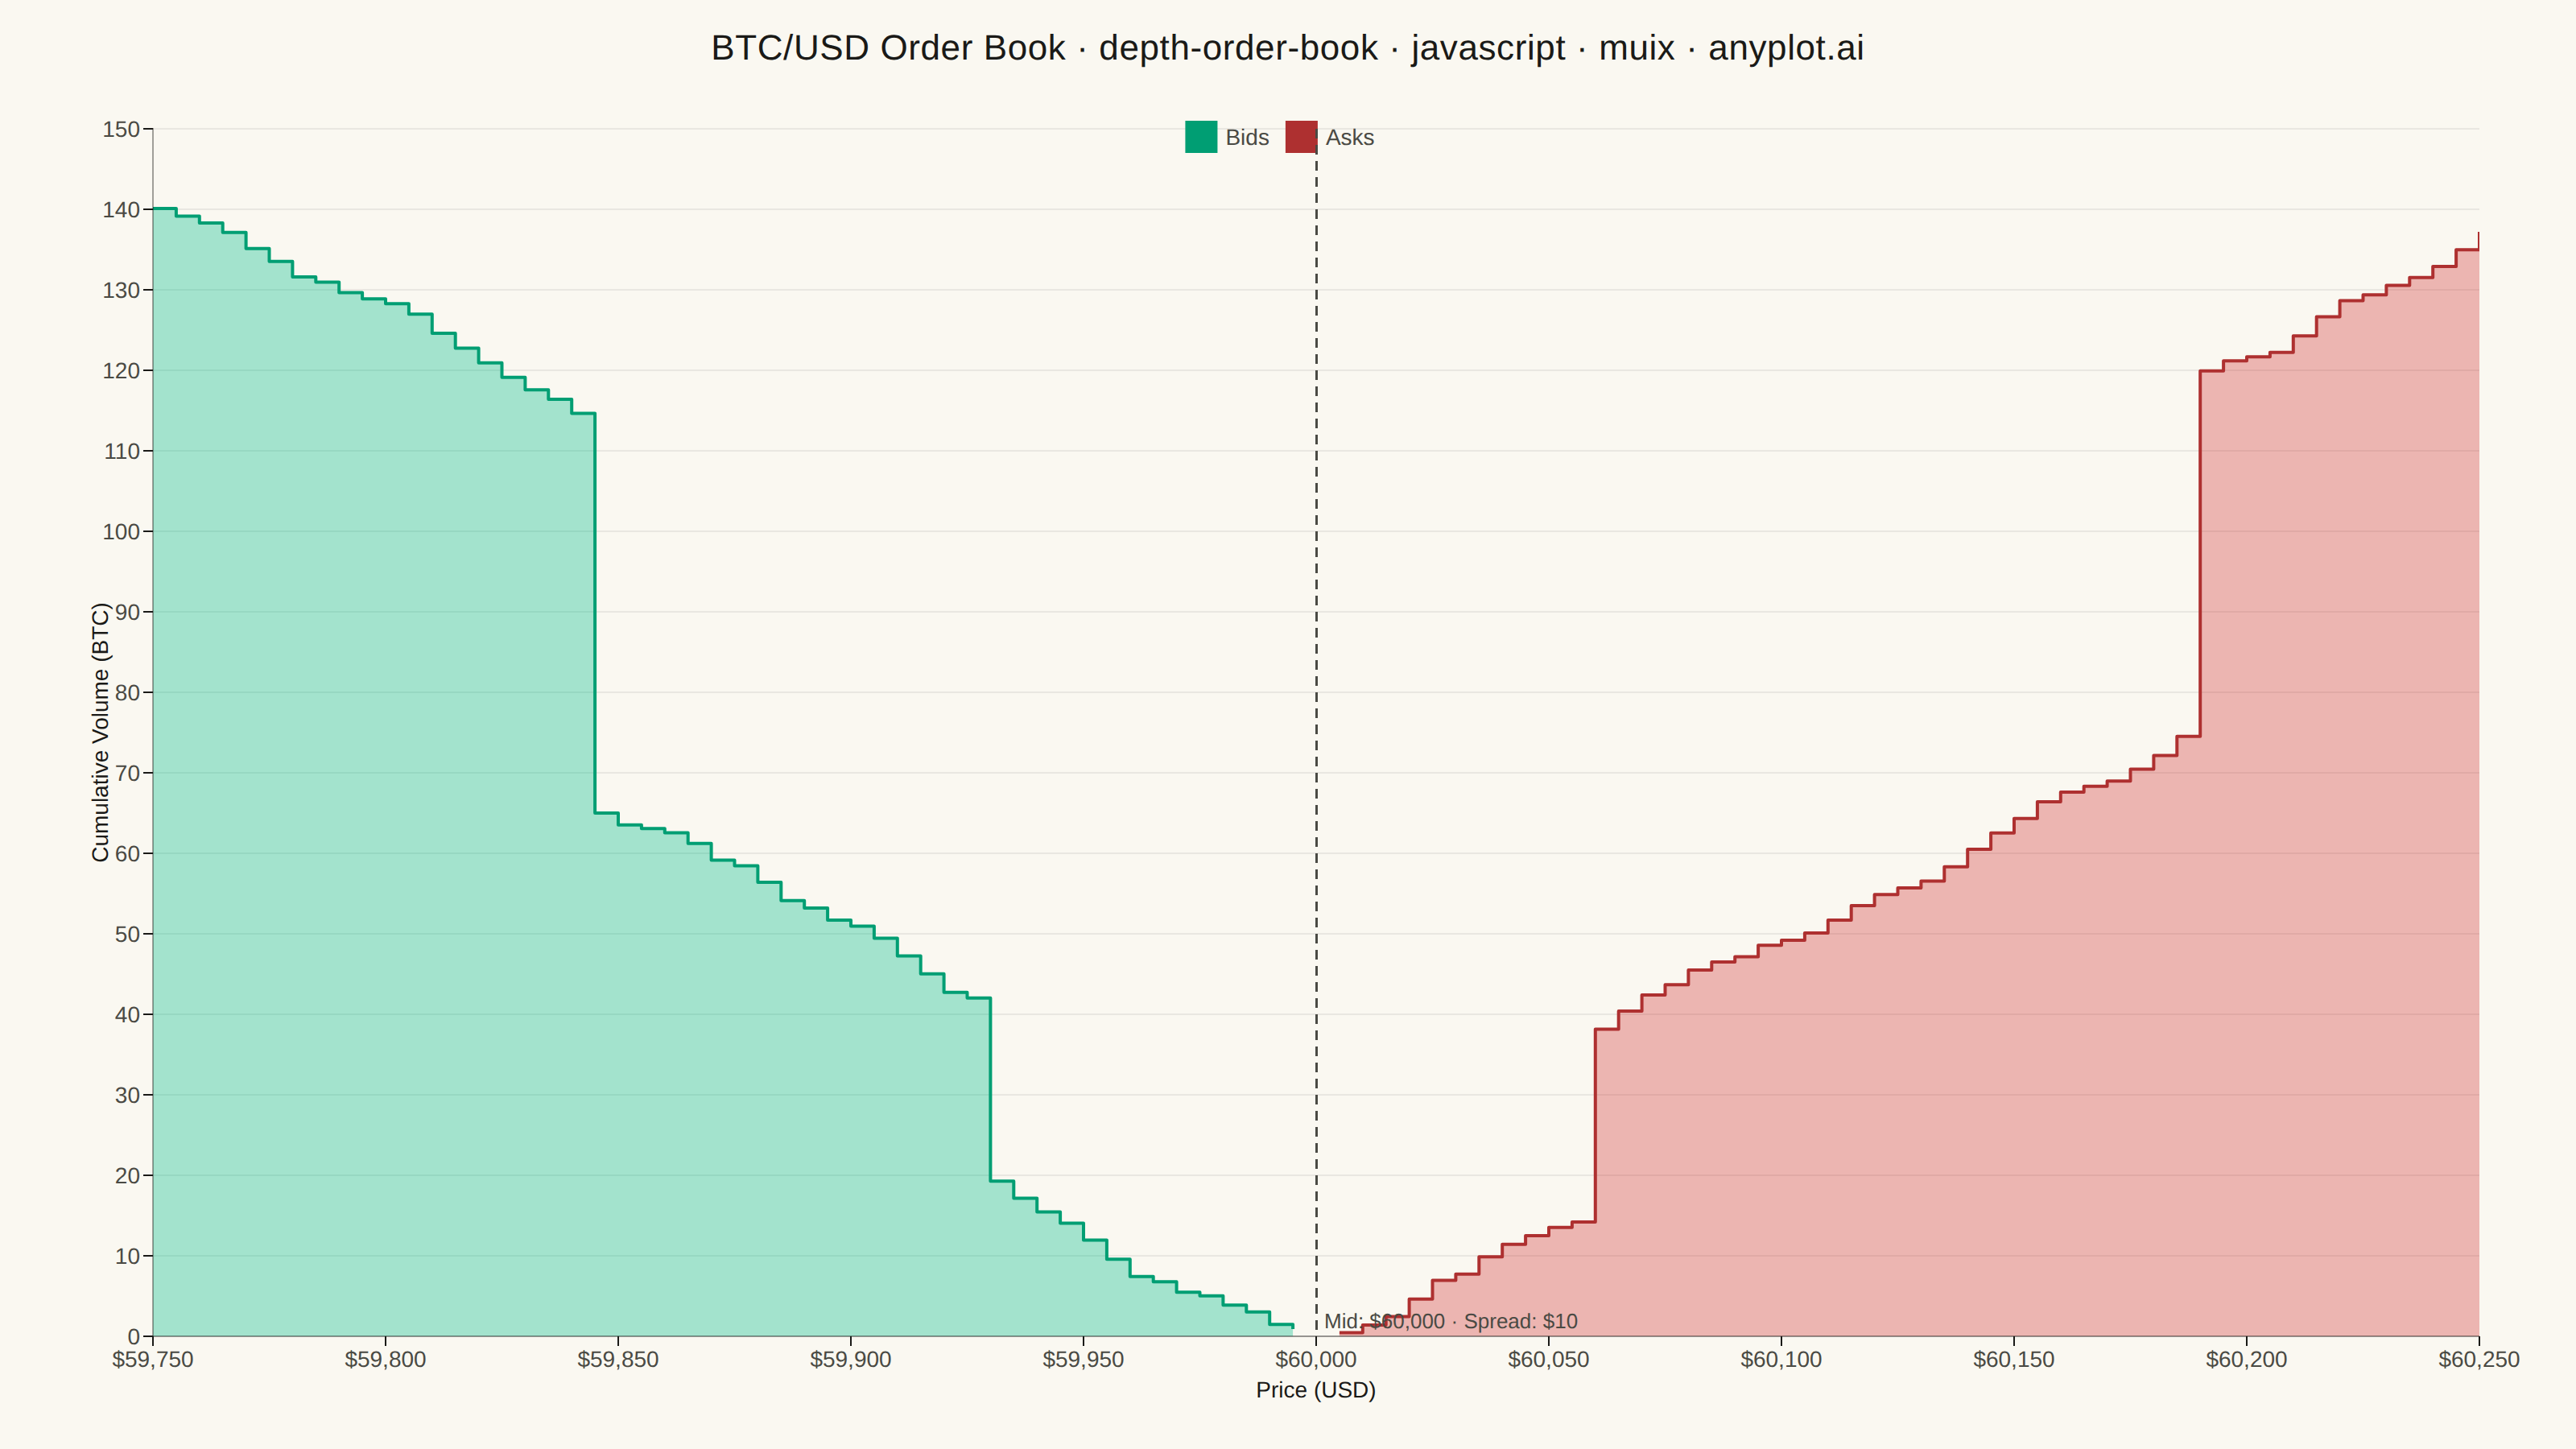
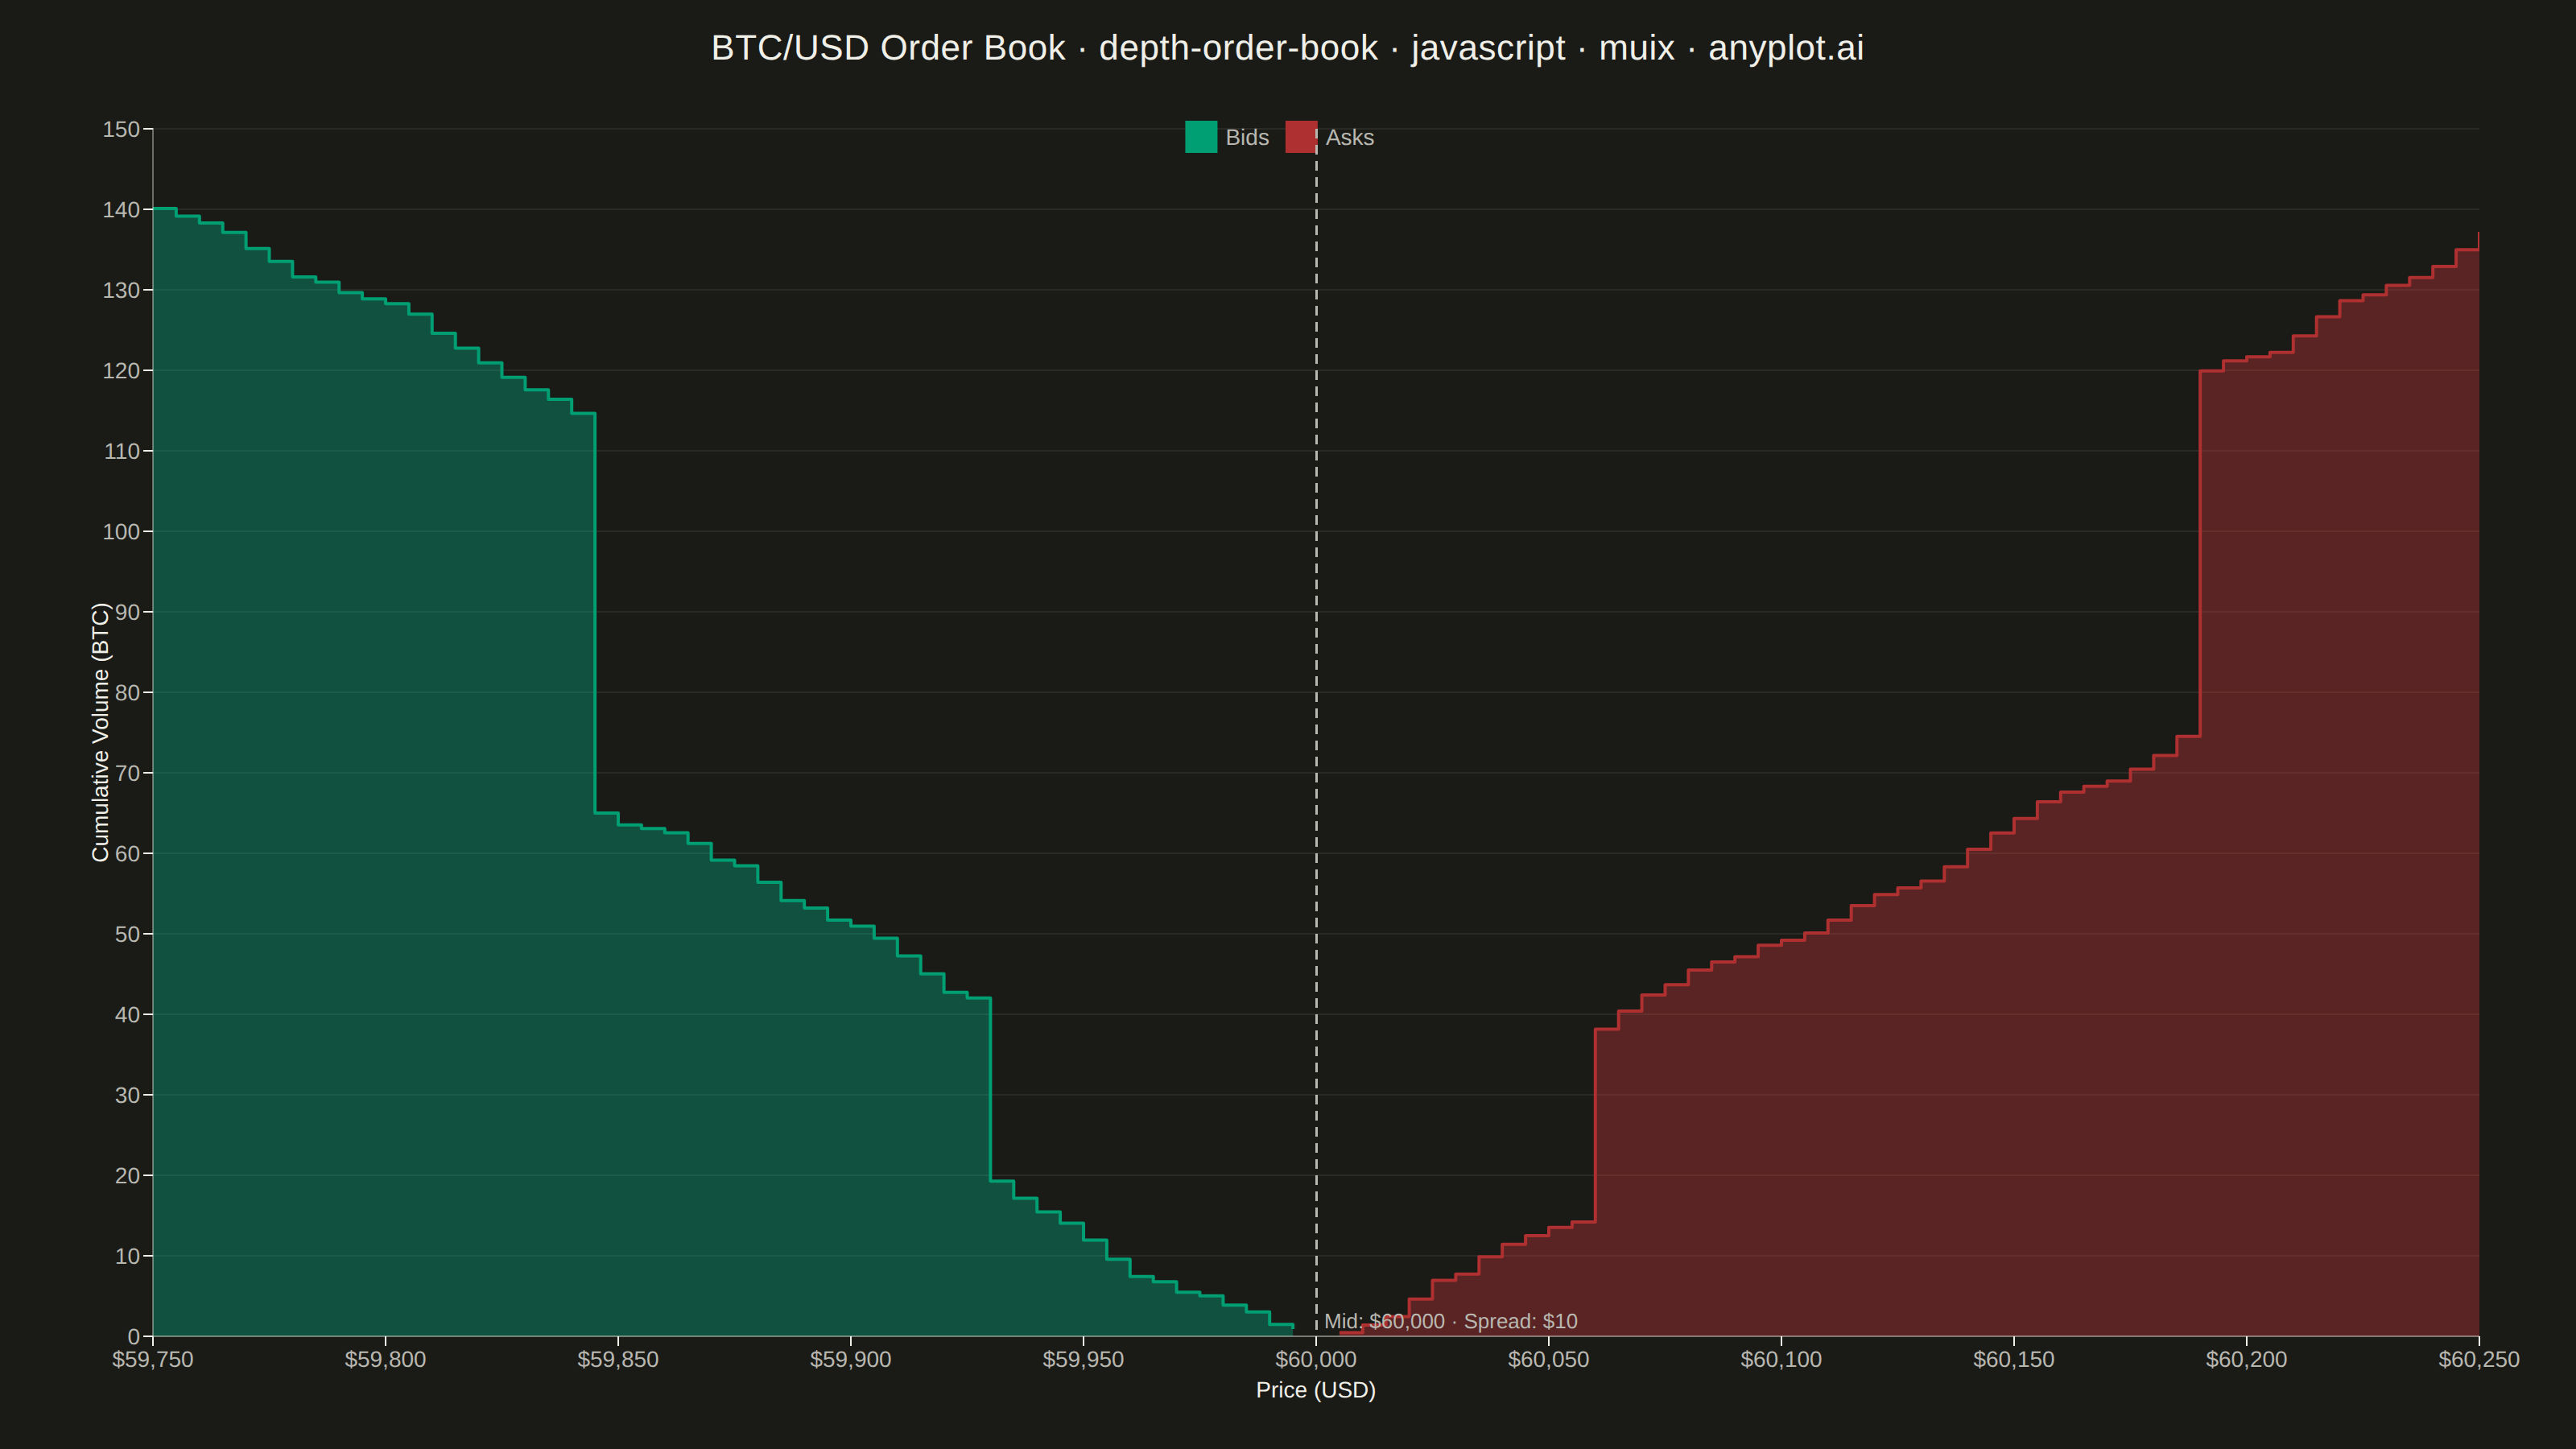
A market depth chart visualizes a snapshot of an exchange order book as two cumulative step areas around the mid price. Cumulative bid volume rises as a green step area to the left of the mid price (summing buy orders from the best bid downward), while cumulative ask volume rises as a red step area to the right (summing sell orders from the best ask upward). The bid-ask spread appears as a gap at the center, with price on the x-axis and cumulative quantity on the y-axis. This is the iconic chart found in nearly every trading and crypto exchange UI, revealing liquidity, support/resistance walls, and the imbalance between buying and selling pressure.
// anyplot.ai
// depth-order-book: Order Book Depth Chart
// Library: muix 7.29.1 | JavaScript 22.22.3
// Quality: 87/100 | Created: 2026-06-15
//# anyplot-orientation: landscape
// anyplot.ai
// depth-order-book: Order Book Depth Chart
// Library: MUI X Charts | React | Node 22
// License: @mui/x-charts — MIT (community). Pro/Premium are out of scope.
// Quality: pending | Created: 2026-06-15

import { LineChart } from "@mui/x-charts/LineChart";
import { ChartsReferenceLine } from "@mui/x-charts";

const t = window.ANYPLOT_TOKENS;

// --- Data (in-memory, deterministic) -----------------------------------------
const MID_PRICE = 60000;
const BEST_BID = 59995;
const BEST_ASK = 60005;
const N = 50;
const TICK = 5;

// Minimal LCG for reproducible pseudo-random data (seed = 42)
let _s = 42;
const rng = () => {
  _s = (Math.imul(1664525, _s) + 1013904223) >>> 0;
  return _s / 4294967296;
};

// Bid quantities: index 0 = best bid (nearest mid), index N-1 = worst bid
const bidQtys = Array.from({ length: N }, (_, i) => {
  const base = 0.4 + rng() * 2.0;
  const wall = i === 14 || i === 31 ? rng() * 35 + 18 : 0;
  return +(base + wall).toFixed(3);
});

// Ask quantities: index 0 = best ask (nearest mid), index N-1 = worst ask
const askQtys = Array.from({ length: N }, (_, i) => {
  const base = 0.4 + rng() * 2.0;
  const wall = i === 11 || i === 37 ? rng() * 35 + 18 : 0;
  return +(base + wall).toFixed(3);
});

// Cumulative sums from best price outward
const accumulate = (arr) =>
  arr.map((_, i) =>
    +arr
      .slice(0, i + 1)
      .reduce((a, b) => a + b, 0)
      .toFixed(3)
  );

const bidCum = accumulate(bidQtys); // [cum_at_best_bid, ..., cum_at_worst_bid]
const askCum = accumulate(askQtys); // [cum_at_best_ask, ..., cum_at_worst_ask]

// Bid prices sorted ascending: worst bid (leftmost) → best bid (rightmost)
const bidPricesAsc = Array.from(
  { length: N },
  (_, i) => BEST_BID - (N - 1 - i) * TICK
);
// Reverse cumulative so max cum is at left (worst bid), min cum at right (best bid)
const bidCumAsc = [...bidCum].reverse();

// Ask prices sorted ascending: best ask (leftmost) → worst ask (rightmost)
const askPricesAsc = Array.from({ length: N }, (_, i) => BEST_ASK + i * TICK);

// Combined x-axis (all prices, ascending); bid and ask regions separated by spread gap
const xData = [...bidPricesAsc, ...askPricesAsc];
const bidData = [...bidCumAsc, ...Array(N).fill(null)]; // null at ask positions → gap
const askData = [...Array(N).fill(null), ...askCum]; // null at bid positions → gap

const SPREAD = BEST_ASK - BEST_BID;

const W = window.ANYPLOT_SIZE.width;
const H = window.ANYPLOT_SIZE.height;
const TITLE_H = 60;

// --- Chart -------------------------------------------------------------------
export default function Chart() {
  return (
    <div style={{ width: W, height: H, display: "flex", flexDirection: "column" }}>
      <div
        style={{
          height: TITLE_H,
          display: "flex",
          alignItems: "center",
          justifyContent: "center",
          color: t.ink,
          fontSize: 22,
          fontWeight: 500,
          letterSpacing: 0.3,
        }}
      >
        BTC/USD Order Book · depth-order-book · javascript · muix · anyplot.ai
      </div>
      <LineChart
        width={W}
        height={H - TITLE_H}
        skipAnimation
        xAxis={[
          {
            data: xData,
            scaleType: "linear",
            label: "Price (USD)",
            valueFormatter: (v) => `$${v.toLocaleString("en-US")}`,
            labelStyle: { fill: t.ink, fontSize: 14 },
            tickLabelStyle: { fill: t.inkSoft, fontSize: 14 },
            tickNumber: 10,
          },
        ]}
        yAxis={[
          {
            label: "Cumulative Volume (BTC)",
            labelStyle: { fill: t.ink, fontSize: 14 },
            tickLabelStyle: { fill: t.inkSoft, fontSize: 14 },
            min: 0,
          },
        ]}
        series={[
          {
            id: "bids",
            data: bidData,
            label: "Bids",
            color: t.palette[0],
            area: true,
            curve: "stepAfter",
            connectNulls: false,
            showMark: false,
          },
          {
            id: "asks",
            data: askData,
            label: "Asks",
            color: t.palette[4],
            area: true,
            curve: "stepAfter",
            connectNulls: false,
            showMark: false,
          },
        ]}
        grid={{ horizontal: true }}
        sx={{
          "& .MuiAreaElement-series-bids": { fillOpacity: 0.35 },
          "& .MuiAreaElement-series-asks": { fillOpacity: 0.35 },
          "& .MuiLineElement-series-bids": { strokeWidth: 2 },
          "& .MuiLineElement-series-asks": { strokeWidth: 2 },
          "& .MuiChartsAxis-directionX .MuiChartsAxis-line": { strokeOpacity: 0.4 },
          "& .MuiChartsAxis-directionY .MuiChartsAxis-line": { strokeOpacity: 0.4 },
          "& .MuiChartsGrid-line": { strokeOpacity: 0.5 },
        }}
        slotProps={{
          legend: {
            labelStyle: { fill: t.inkSoft, fontSize: 14 },
          },
        }}
        margin={{ top: 20, right: 60, bottom: 70, left: 95 }}
      >
        <ChartsReferenceLine
          x={MID_PRICE}
          label={`Mid: $${MID_PRICE.toLocaleString("en-US")} · Spread: $${SPREAD}`}
          labelStyle={{ fill: t.inkSoft, fontSize: 13 }}
          lineStyle={{
            stroke: t.inkSoft,
            strokeDasharray: "6 4",
            strokeWidth: 1.5,
          }}
          labelAlign="end"
        />
      </LineChart>
    </div>
  );
}
Runnable source as JSON, for any HTTP client: https://api.anyplot.ai/specs/depth-order-book/muix/code. Any spec id and library id listed in llms-full.txt fit the same URL shape; every URL below is complete and callable.
{
  "spec_id": "depth-order-book",
  "language": "javascript",
  "library": "muix",
  "page": "https://anyplot.ai/depth-order-book/javascript/muix",
  "hub": "https://anyplot.ai/depth-order-book",
  "code_json": "https://api.anyplot.ai/specs/depth-order-book/muix/code",
  "spec_json": "https://api.anyplot.ai/specs/depth-order-book",
  "render_light_png": "https://storage.googleapis.com/anyplot-images/plots/depth-order-book/javascript/muix/plot-light.png",
  "render_dark_png": "https://storage.googleapis.com/anyplot-images/plots/depth-order-book/javascript/muix/plot-dark.png",
  "interactive_light_html": "https://storage.googleapis.com/anyplot-images/plots/depth-order-book/javascript/muix/plot-light.html",
  "interactive_dark_html": "https://storage.googleapis.com/anyplot-images/plots/depth-order-book/javascript/muix/plot-dark.html",
  "quality_score": 87.0,
  "license": "MIT",
  "guide": "https://anyplot.ai/llms.txt"
}
Part of Order Book Depth Chart on anyplot.ai.