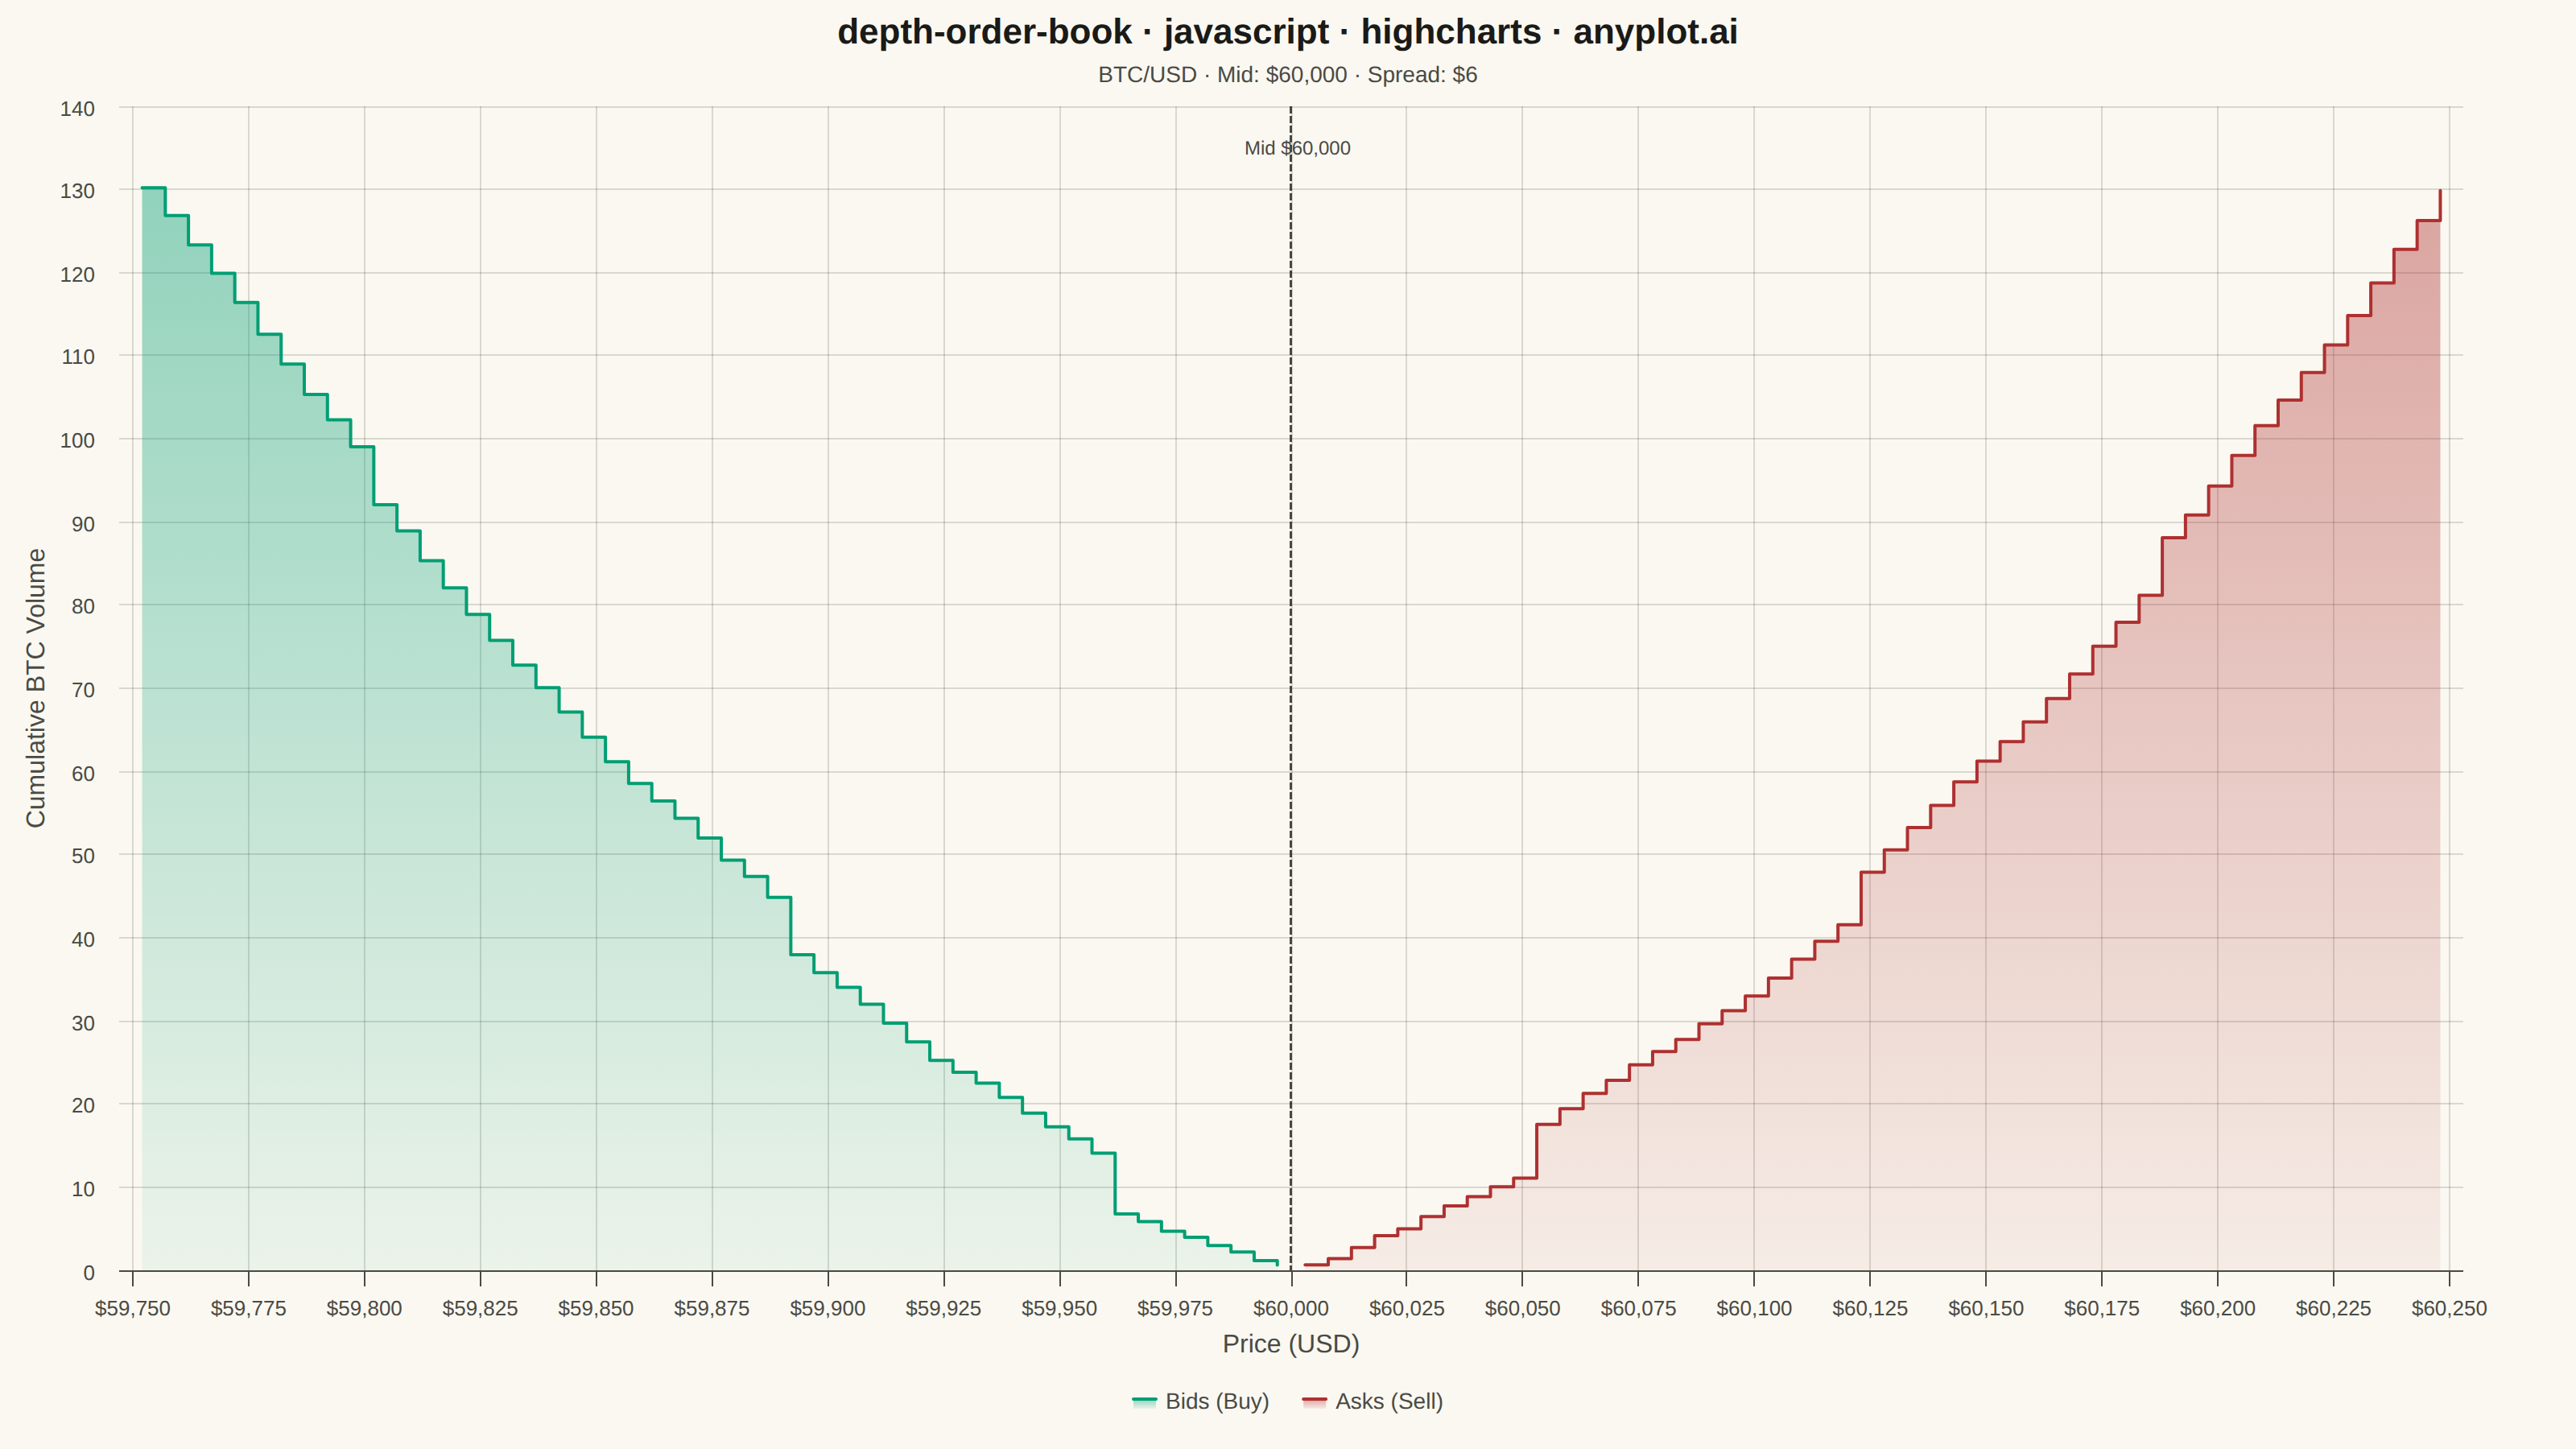
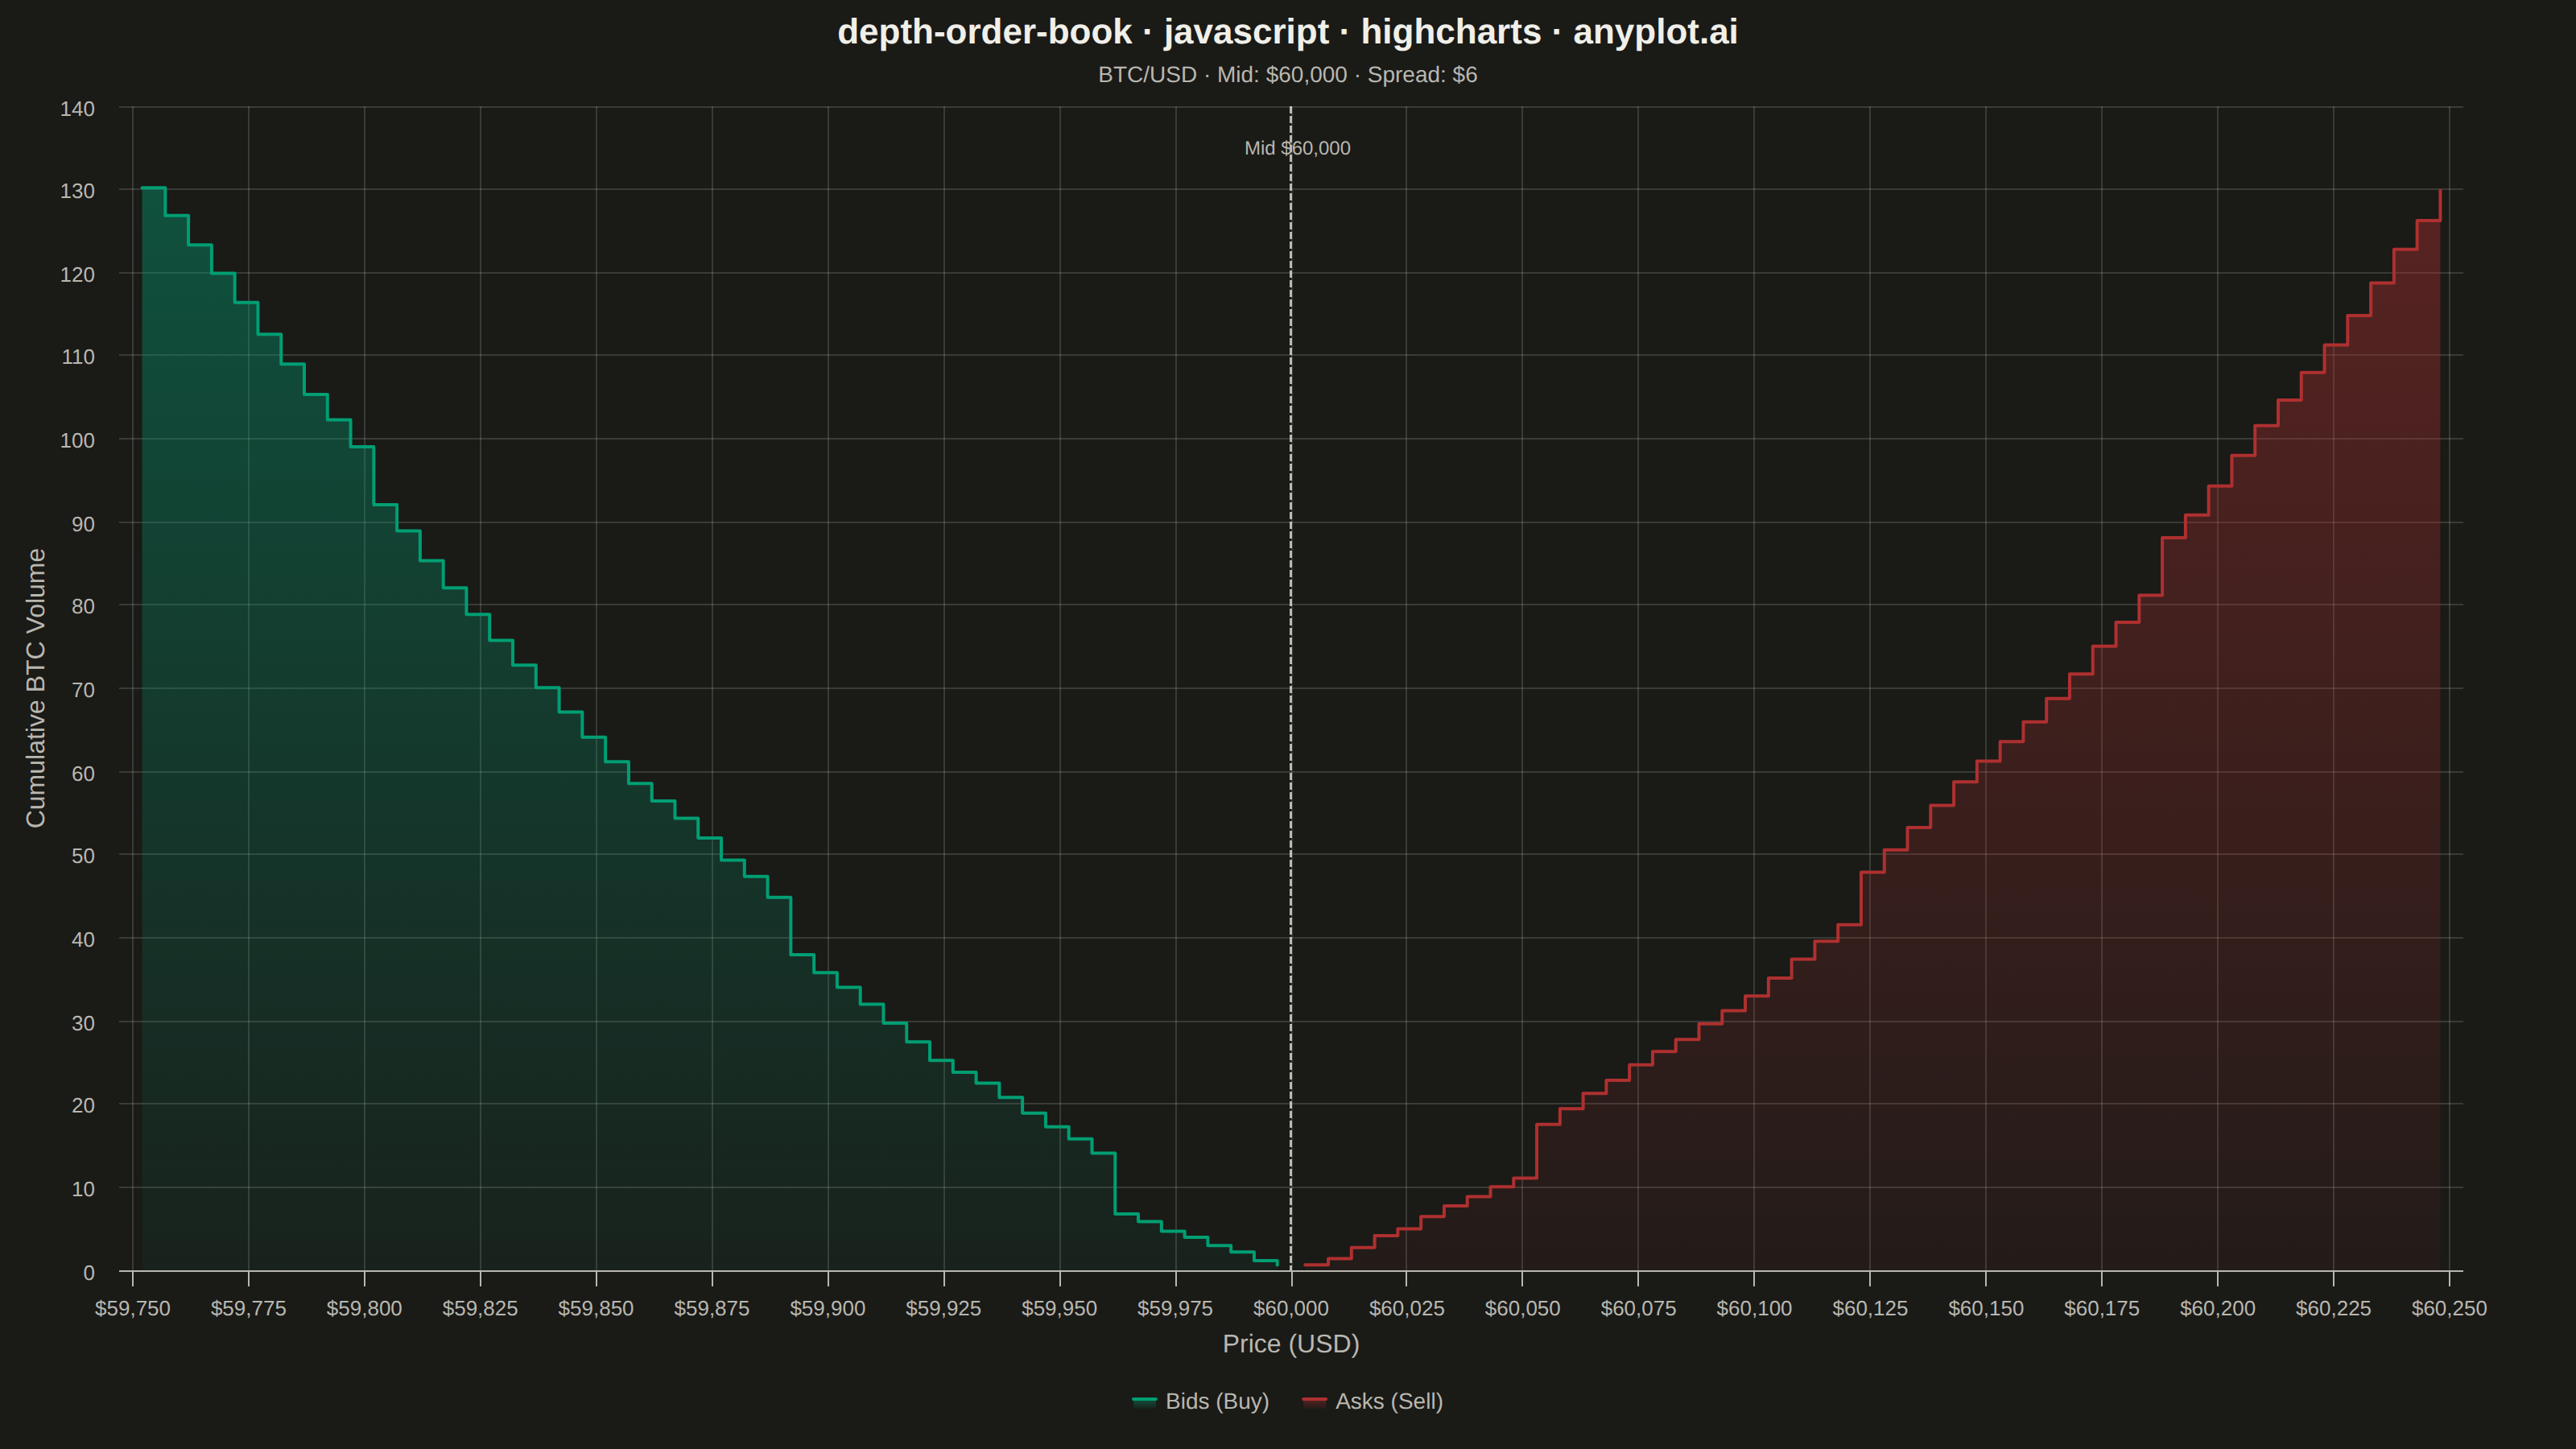
A market depth chart visualizes a snapshot of an exchange order book as two cumulative step areas around the mid price. Cumulative bid volume rises as a green step area to the left of the mid price (summing buy orders from the best bid downward), while cumulative ask volume rises as a red step area to the right (summing sell orders from the best ask upward). The bid-ask spread appears as a gap at the center, with price on the x-axis and cumulative quantity on the y-axis. This is the iconic chart found in nearly every trading and crypto exchange UI, revealing liquidity, support/resistance walls, and the imbalance between buying and selling pressure.
// anyplot.ai
// depth-order-book: Order Book Depth Chart
// Library: highcharts 12.6.0 | JavaScript 22.22.3
// Quality: 86/100 | Created: 2026-06-15

const t = window.ANYPLOT_TOKENS;

// BTC/USD order book snapshot near $60,000
const MID_PRICE = 60000;
const BEST_BID = 59997;
const BEST_ASK = 60003;
const SPREAD = BEST_ASK - BEST_BID;
const PRICE_STEP = 5;
const LEVELS = 50;

// Seeded LCG for deterministic in-browser randomness
let _lcgSeed = 42;
function lcgRand() {
    _lcgSeed = (_lcgSeed * 1664525 + 1013904223) & 0xffffffff;
    return (_lcgSeed >>> 0) / 0x100000000;
}

// Build bid side — accumulate cumulative qty from best bid outward (toward worse prices)
const bidLevels = [];
let cumBid = 0;
for (let i = 0; i < LEVELS; i++) {
    const price = BEST_BID - i * PRICE_STEP;
    const baseQty = 0.4 + i * 0.06;
    const wall = (i === 8 || i === 22 || i === 40) ? 3.8 + lcgRand() * 2.0 : 0;
    cumBid += baseQty + lcgRand() * 0.9 + wall;
    bidLevels.push([price, parseFloat(cumBid.toFixed(3))]);
}
// Reverse so data is sorted price-ascending (worst bid first → best bid last)
const bidData = bidLevels.slice().reverse();

// Build ask side — accumulate from best ask outward (toward worse prices)
const askData = [];
let cumAsk = 0;
for (let i = 0; i < LEVELS; i++) {
    const price = BEST_ASK + i * PRICE_STEP;
    const baseQty = 0.4 + i * 0.06;
    const wall = (i === 10 || i === 24 || i === 37) ? 3.4 + lcgRand() * 2.0 : 0;
    cumAsk += baseQty + lcgRand() * 0.9 + wall;
    askData.push([price, parseFloat(cumAsk.toFixed(3))]);
}

// Title length is 56 chars — under 67 baseline, so default 22px applies
const titleText = "depth-order-book · javascript · highcharts · anyplot.ai";

Highcharts.chart("container", {
    chart: {
        type: "area",
        backgroundColor: "transparent",
        animation: false,
        style: { fontFamily: "inherit" },
        marginRight: 70
    },
    credits: { enabled: false },
    colors: t.palette,
    title: {
        text: titleText,
        style: { color: t.ink, fontSize: "22px", fontWeight: "600" }
    },
    subtitle: {
        text: "BTC/USD · Mid: $" + MID_PRICE.toLocaleString() + " · Spread: $" + SPREAD,
        style: { color: t.inkSoft, fontSize: "14px" }
    },
    xAxis: {
        title: {
            text: "Price (USD)",
            style: { color: t.inkSoft, fontSize: "16px" }
        },
        lineColor: t.inkSoft,
        tickColor: t.inkSoft,
        gridLineColor: t.grid,
        gridLineWidth: 1,
        labels: {
            style: { color: t.inkSoft, fontSize: "13px" },
            formatter: function() {
                return "$" + this.value.toLocaleString();
            }
        },
        plotLines: [{
            value: MID_PRICE,
            color: t.inkSoft,
            dashStyle: "ShortDash",
            width: 1.5,
            label: {
                text: "Mid $60,000",
                style: { color: t.inkSoft, fontSize: "12px" },
                rotation: 0,
                align: "center",
                y: 30
            }
        }]
    },
    yAxis: {
        title: {
            text: "Cumulative BTC Volume",
            style: { color: t.inkSoft, fontSize: "16px" }
        },
        gridLineColor: t.grid,
        gridLineWidth: 1,
        lineColor: t.inkSoft,
        min: 0,
        labels: {
            style: { color: t.inkSoft, fontSize: "13px" }
        }
    },
    legend: {
        enabled: true,
        itemStyle: { color: t.inkSoft, fontSize: "14px" },
        itemHoverStyle: { color: t.ink }
    },
    plotOptions: {
        series: { animation: false },
        area: {
            step: "left",
            lineWidth: 2,
            marker: { enabled: false }
        }
    },
    series: [
        {
            name: "Bids (Buy)",
            data: bidData,
            color: "#009E73",
            fillColor: {
                linearGradient: { x1: 0, y1: 0, x2: 0, y2: 1 },
                stops: [
                    [0, "rgba(0,158,115,0.42)"],
                    [1, "rgba(0,158,115,0.06)"]
                ]
            }
        },
        {
            name: "Asks (Sell)",
            data: askData,
            color: "#AE3030",
            fillColor: {
                linearGradient: { x1: 0, y1: 0, x2: 0, y2: 1 },
                stops: [
                    [0, "rgba(174,48,48,0.42)"],
                    [1, "rgba(174,48,48,0.06)"]
                ]
            }
        }
    ]
});
Runnable source as JSON, for any HTTP client: https://api.anyplot.ai/specs/depth-order-book/highcharts/code. Any spec id and library id listed in llms-full.txt fit the same URL shape; every URL below is complete and callable.
{
  "spec_id": "depth-order-book",
  "language": "javascript",
  "library": "highcharts",
  "page": "https://anyplot.ai/depth-order-book/javascript/highcharts",
  "hub": "https://anyplot.ai/depth-order-book",
  "code_json": "https://api.anyplot.ai/specs/depth-order-book/highcharts/code",
  "spec_json": "https://api.anyplot.ai/specs/depth-order-book",
  "render_light_png": "https://storage.googleapis.com/anyplot-images/plots/depth-order-book/javascript/highcharts/plot-light.png",
  "render_dark_png": "https://storage.googleapis.com/anyplot-images/plots/depth-order-book/javascript/highcharts/plot-dark.png",
  "interactive_light_html": "https://storage.googleapis.com/anyplot-images/plots/depth-order-book/javascript/highcharts/plot-light.html",
  "interactive_dark_html": "https://storage.googleapis.com/anyplot-images/plots/depth-order-book/javascript/highcharts/plot-dark.html",
  "quality_score": 86.0,
  "license": "MIT",
  "guide": "https://anyplot.ai/llms.txt"
}
Part of Order Book Depth Chart on anyplot.ai.