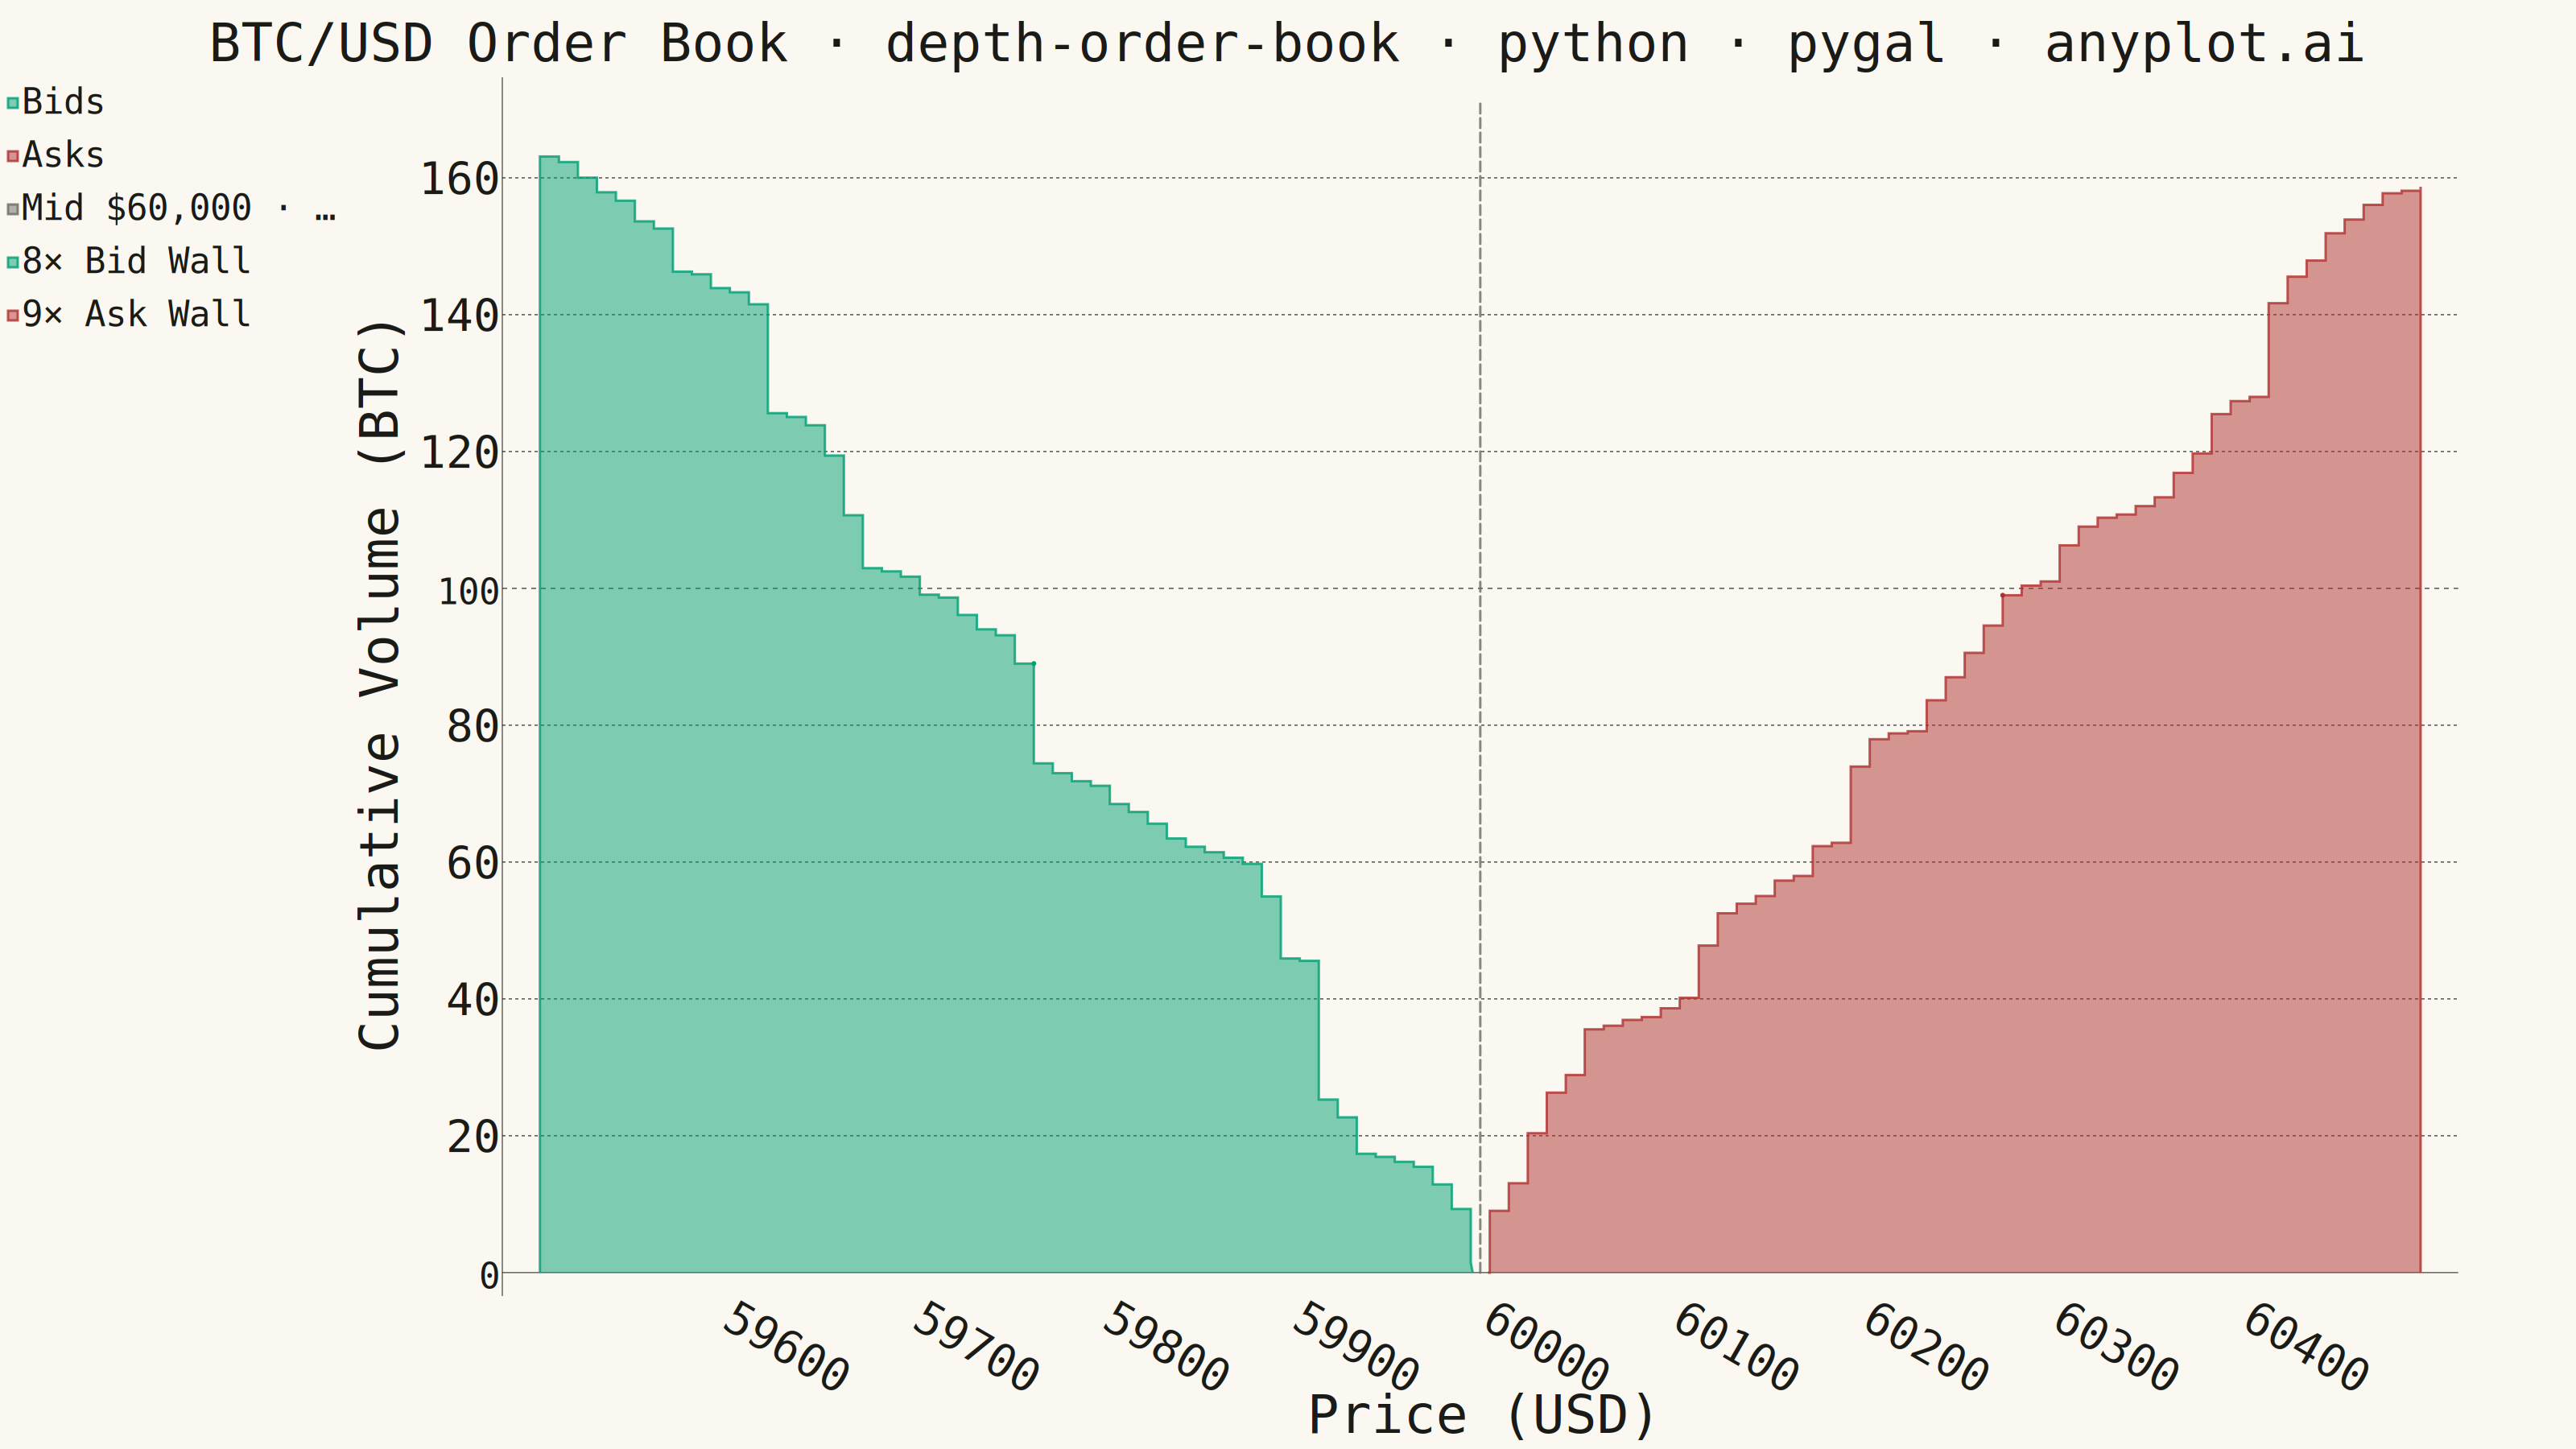
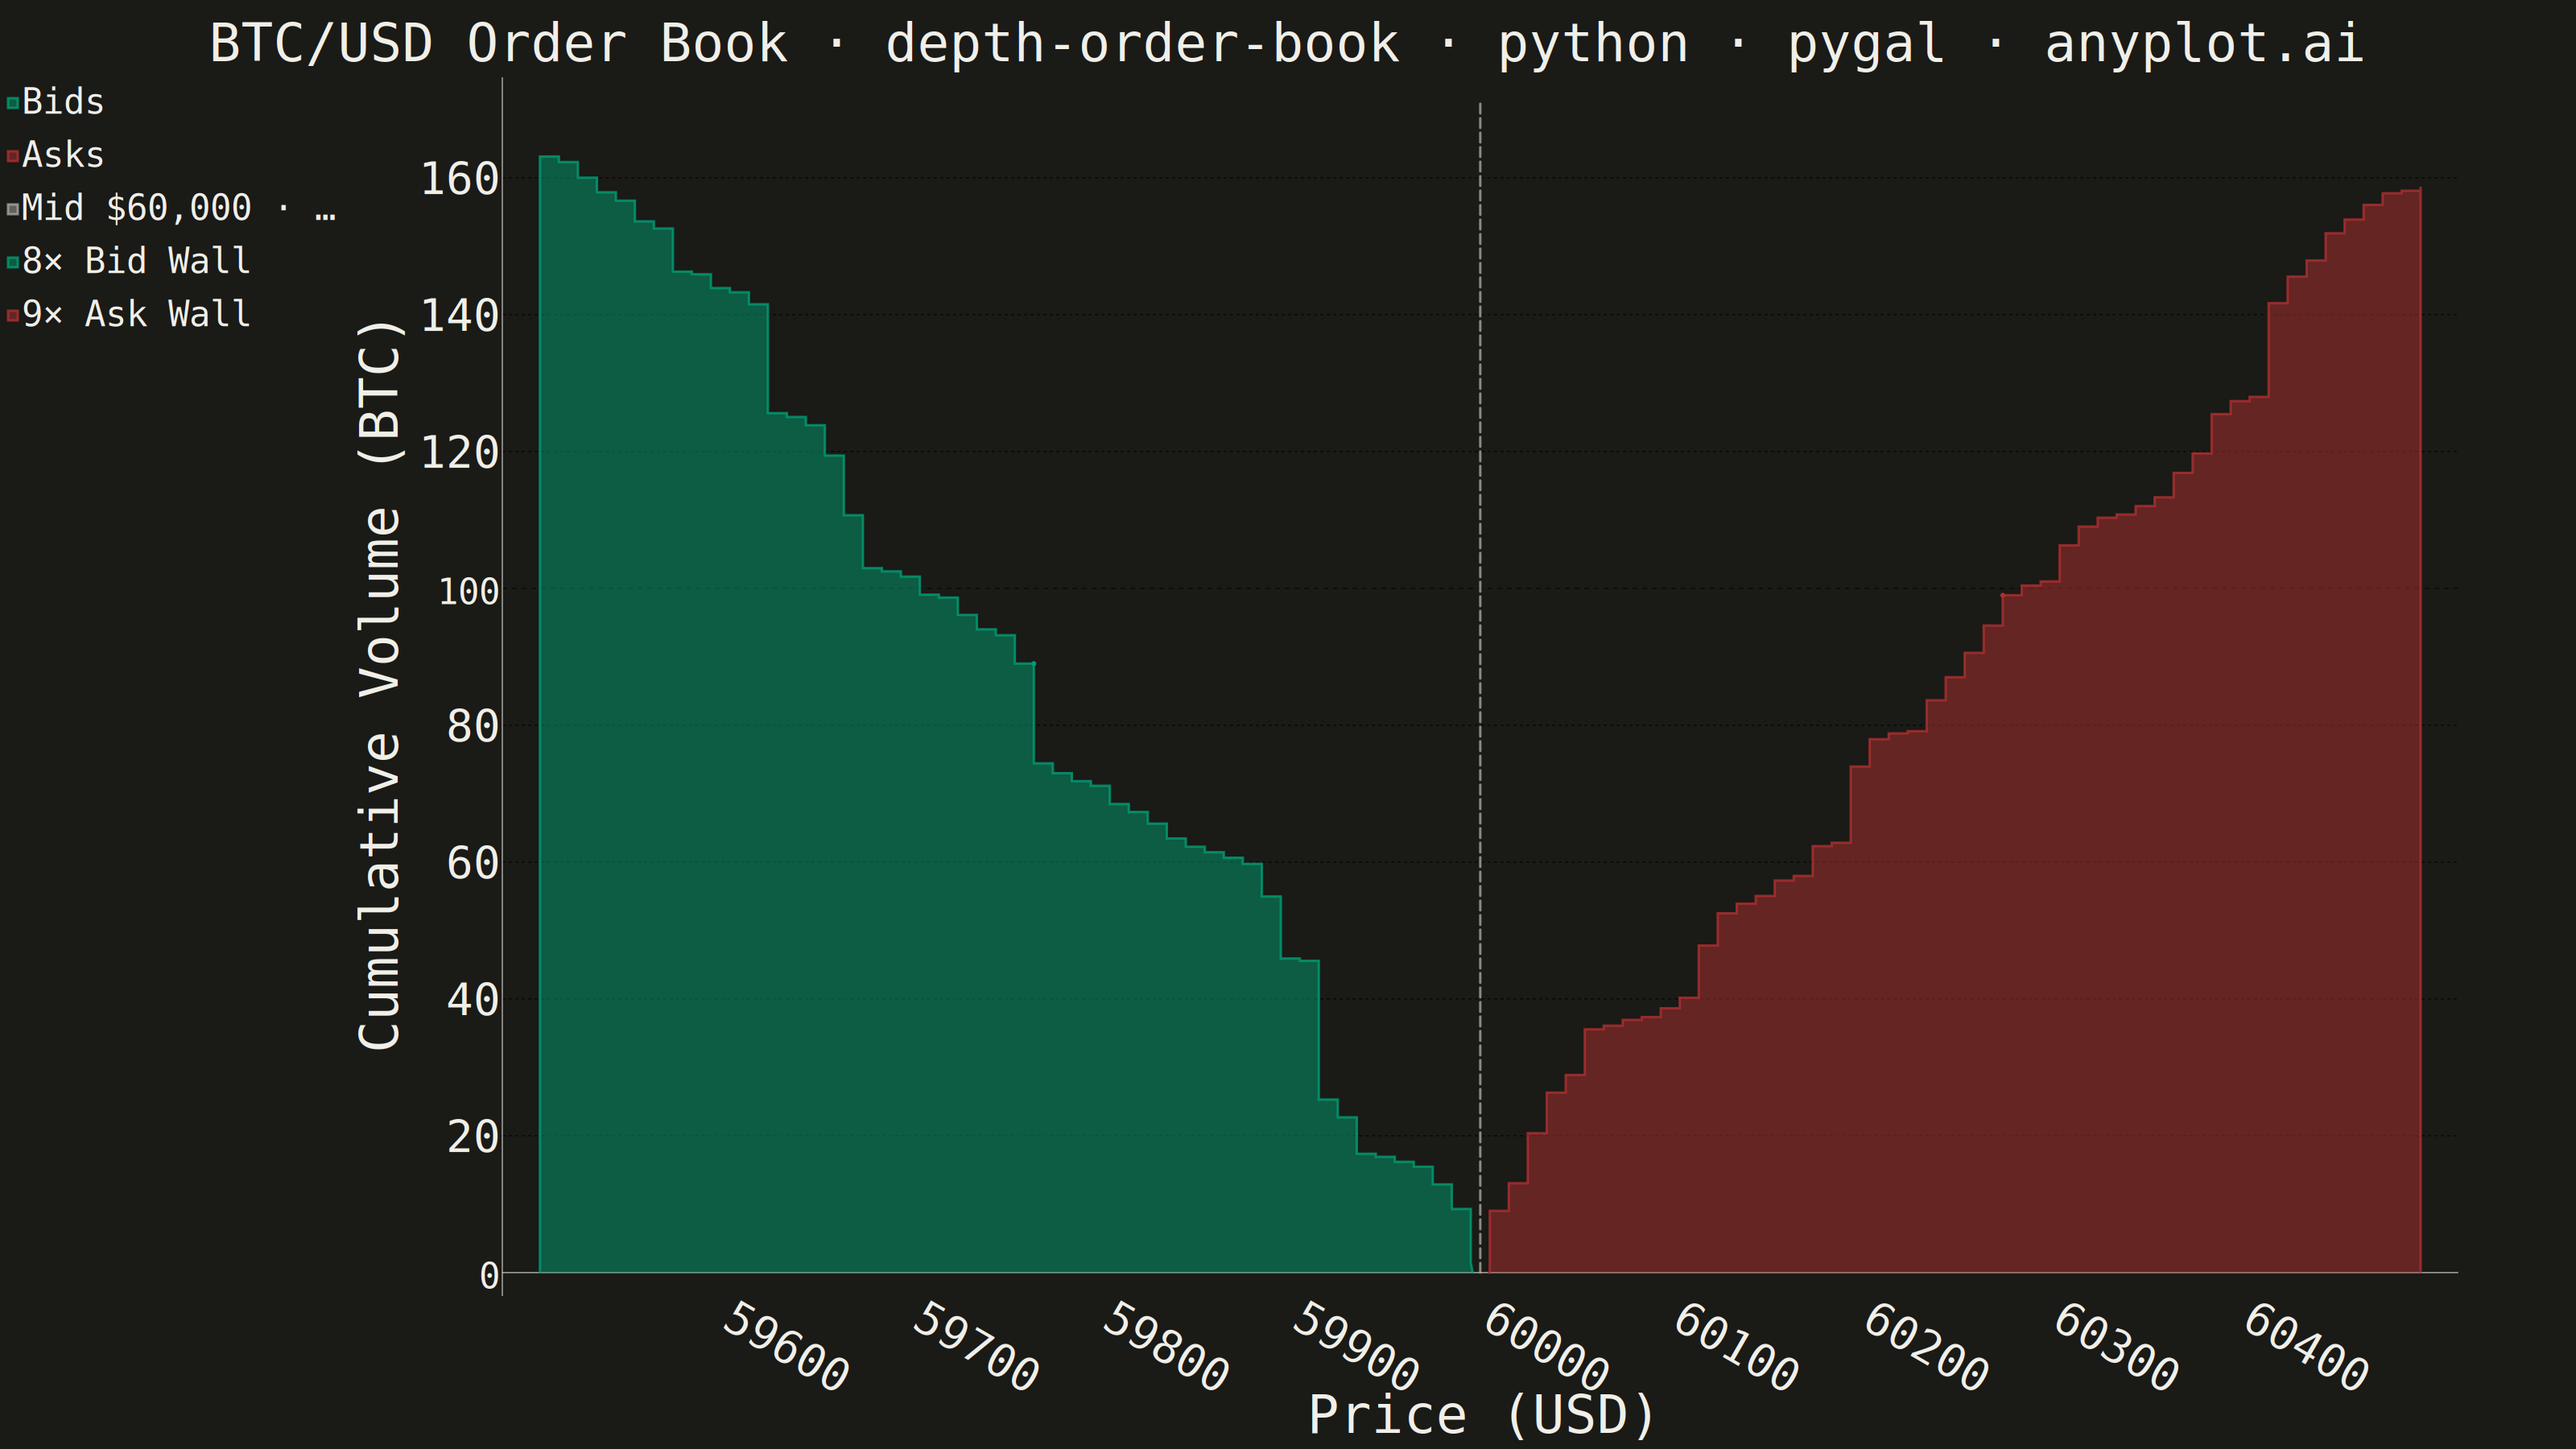
A market depth chart visualizes a snapshot of an exchange order book as two cumulative step areas around the mid price. Cumulative bid volume rises as a green step area to the left of the mid price (summing buy orders from the best bid downward), while cumulative ask volume rises as a red step area to the right (summing sell orders from the best ask upward). The bid-ask spread appears as a gap at the center, with price on the x-axis and cumulative quantity on the y-axis. This is the iconic chart found in nearly every trading and crypto exchange UI, revealing liquidity, support/resistance walls, and the imbalance between buying and selling pressure.
""" anyplot.ai
depth-order-book: Order Book Depth Chart
Library: pygal 3.1.0 | Python 3.13.13
Quality: 83/100 | Created: 2026-06-15
"""

import os
import sys

import numpy as np


# Prevent the local pygal.py from shadowing the installed pygal package
_script_dir = os.path.dirname(os.path.abspath(__file__))
if _script_dir in sys.path:
    sys.path.remove(_script_dir)

import pygal
from pygal.style import Style


# Theme
THEME = os.getenv("ANYPLOT_THEME", "light")
PAGE_BG = "#FAF8F1" if THEME == "light" else "#1A1A17"
INK = "#1A1A17" if THEME == "light" else "#F0EFE8"
INK_MUTED = "#6B6A63" if THEME == "light" else "#A8A79F"

# Imprint palette — semantic: green for bids (buy), red for asks (sell)
BID_COLOR = "#009E73"
ASK_COLOR = "#AE3030"

# Data — synthetic BTC/USD order book snapshot, mid price $60,000
np.random.seed(42)
n_levels = 50
tick = 10

bid_prices = np.array([59_995 - i * tick for i in range(n_levels)])
ask_prices = np.array([60_005 + i * tick for i in range(n_levels)])

bid_qtys = np.random.exponential(scale=2.5, size=n_levels) + 0.3
ask_qtys = np.random.exponential(scale=2.5, size=n_levels) + 0.3

# Order walls at key price levels
bid_qtys[9] *= 6
bid_qtys[24] *= 8
bid_qtys[38] *= 5
ask_qtys[11] *= 7
ask_qtys[27] *= 9
ask_qtys[41] *= 4

# Cumulative volume from best price outward
bid_cum = np.cumsum(bid_qtys)
ask_cum = np.cumsum(ask_qtys)

# Reverse bids for left-to-right layout (worst → best price, descending cumulative)
bid_px = bid_prices[::-1]
bid_cq = bid_cum[::-1]
ask_px = ask_prices
ask_cq = ask_cum

# Max cumulative volume and mid-price annotation data
max_vol = max(float(bid_cq[0]), float(ask_cq[-1]))
mid_price = 60_000
mid_line = [(mid_price, 0.0), (mid_price, max_vol * 1.05)]

# Biggest bid wall: bid_qtys[24] *= 8 at price 59755.
# Visual step (drop) appears at bid_px[26]=59765; top of the step is bid_cq[25]=bid_cum[24].
bid_wall_price = int(bid_px[26])  # 59765
bid_wall_vol = float(bid_cq[25])  # bid_cum[24] — height at the top of the 8× drop

# Biggest ask wall: ask_qtys[27] *= 9 at price 60275.
# Visual step (rise) at ask_px[27]=60275; peak is ask_cq[27]=ask_cum[27].
ask_wall_price = int(ask_px[27])  # 60275
ask_wall_vol = float(ask_cq[27])  # ask_cum[27] — height at the top of the 9× rise

# Build bid staircase (descending from left/worst to right/best, close to zero at mid)
bid_step = [(int(bid_px[0]), float(bid_cq[0]))]
for i in range(1, len(bid_px)):
    bid_step.append((int(bid_px[i]), float(bid_cq[i - 1])))
    bid_step.append((int(bid_px[i]), float(bid_cq[i])))
bid_step.append((int(bid_px[-1]) + 1, 0.0))

# Build ask staircase (ascending from left/best to right/worst, open from zero at mid)
ask_step = [(int(ask_px[0]) - 1, 0.0), (int(ask_px[0]), 0.0), (int(ask_px[0]), float(ask_cq[0]))]
for i in range(1, len(ask_px)):
    ask_step.append((int(ask_px[i]), float(ask_cq[i - 1])))
    ask_step.append((int(ask_px[i]), float(ask_cq[i])))

# Title — 67 chars → no scaling needed
title = "BTC/USD Order Book · depth-order-book · python · pygal · anyplot.ai"
n_chars = len(title)
ratio = 67 / n_chars if n_chars > 67 else 1.0
title_fontsize = max(44, round(66 * ratio))

# Style — 5 colors: Bids, Asks, Mid-price line, Bid Wall dot, Ask Wall dot
custom_style = Style(
    background=PAGE_BG,
    plot_background=PAGE_BG,
    foreground=INK,
    foreground_strong=INK,
    foreground_subtle=INK_MUTED,
    colors=(BID_COLOR, ASK_COLOR, INK_MUTED, BID_COLOR, ASK_COLOR),
    opacity=0.5,
    opacity_hover=0.85,
    title_font_size=title_fontsize,
    label_font_size=56,
    major_label_font_size=44,
    legend_font_size=44,
    value_font_size=36,
    stroke_width=3.0,
    dots_size=12,
)

# Chart
chart = pygal.XY(
    width=3200,
    height=1800,
    fill=True,
    show_dots=False,
    show_x_guides=False,
    show_y_guides=True,
    x_label_rotation=30,
    style=custom_style,
    title=title,
    x_title="Price (USD)",
    y_title="Cumulative Volume (BTC)",
)

chart.add("Bids", bid_step)
chart.add("Asks", ask_step)
# Dashed vertical line at mid price — highlights the bid-ask spread gap
chart.add(
    "Mid $60,000 · Spread $10",
    mid_line,
    fill=False,
    show_dots=False,
    stroke_style={"width": 3, "dasharray": "12,6", "linecap": "round"},
)
# Dot callouts at the largest liquidity walls for storytelling
chart.add(
    "8× Bid Wall", [{"value": (bid_wall_price, bid_wall_vol), "label": "8×"}], fill=False, show_dots=True, stroke=False
)
chart.add(
    "9× Ask Wall", [{"value": (ask_wall_price, ask_wall_vol), "label": "9×"}], fill=False, show_dots=True, stroke=False
)

# Save
chart.render_to_png(f"plot-{THEME}.png")
with open(f"plot-{THEME}.html", "wb") as f:
    f.write(chart.render())
Runnable source as JSON, for any HTTP client: https://api.anyplot.ai/specs/depth-order-book/pygal/code. Any spec id and library id listed in llms-full.txt fit the same URL shape; every URL below is complete and callable.
{
  "spec_id": "depth-order-book",
  "language": "python",
  "library": "pygal",
  "page": "https://anyplot.ai/depth-order-book/python/pygal",
  "hub": "https://anyplot.ai/depth-order-book",
  "code_json": "https://api.anyplot.ai/specs/depth-order-book/pygal/code",
  "spec_json": "https://api.anyplot.ai/specs/depth-order-book",
  "render_light_png": "https://storage.googleapis.com/anyplot-images/plots/depth-order-book/python/pygal/plot-light.png",
  "render_dark_png": "https://storage.googleapis.com/anyplot-images/plots/depth-order-book/python/pygal/plot-dark.png",
  "interactive_light_html": "https://storage.googleapis.com/anyplot-images/plots/depth-order-book/python/pygal/plot-light.html",
  "interactive_dark_html": "https://storage.googleapis.com/anyplot-images/plots/depth-order-book/python/pygal/plot-dark.html",
  "quality_score": 83.0,
  "license": "MIT",
  "guide": "https://anyplot.ai/llms.txt"
}
Part of Order Book Depth Chart on anyplot.ai.