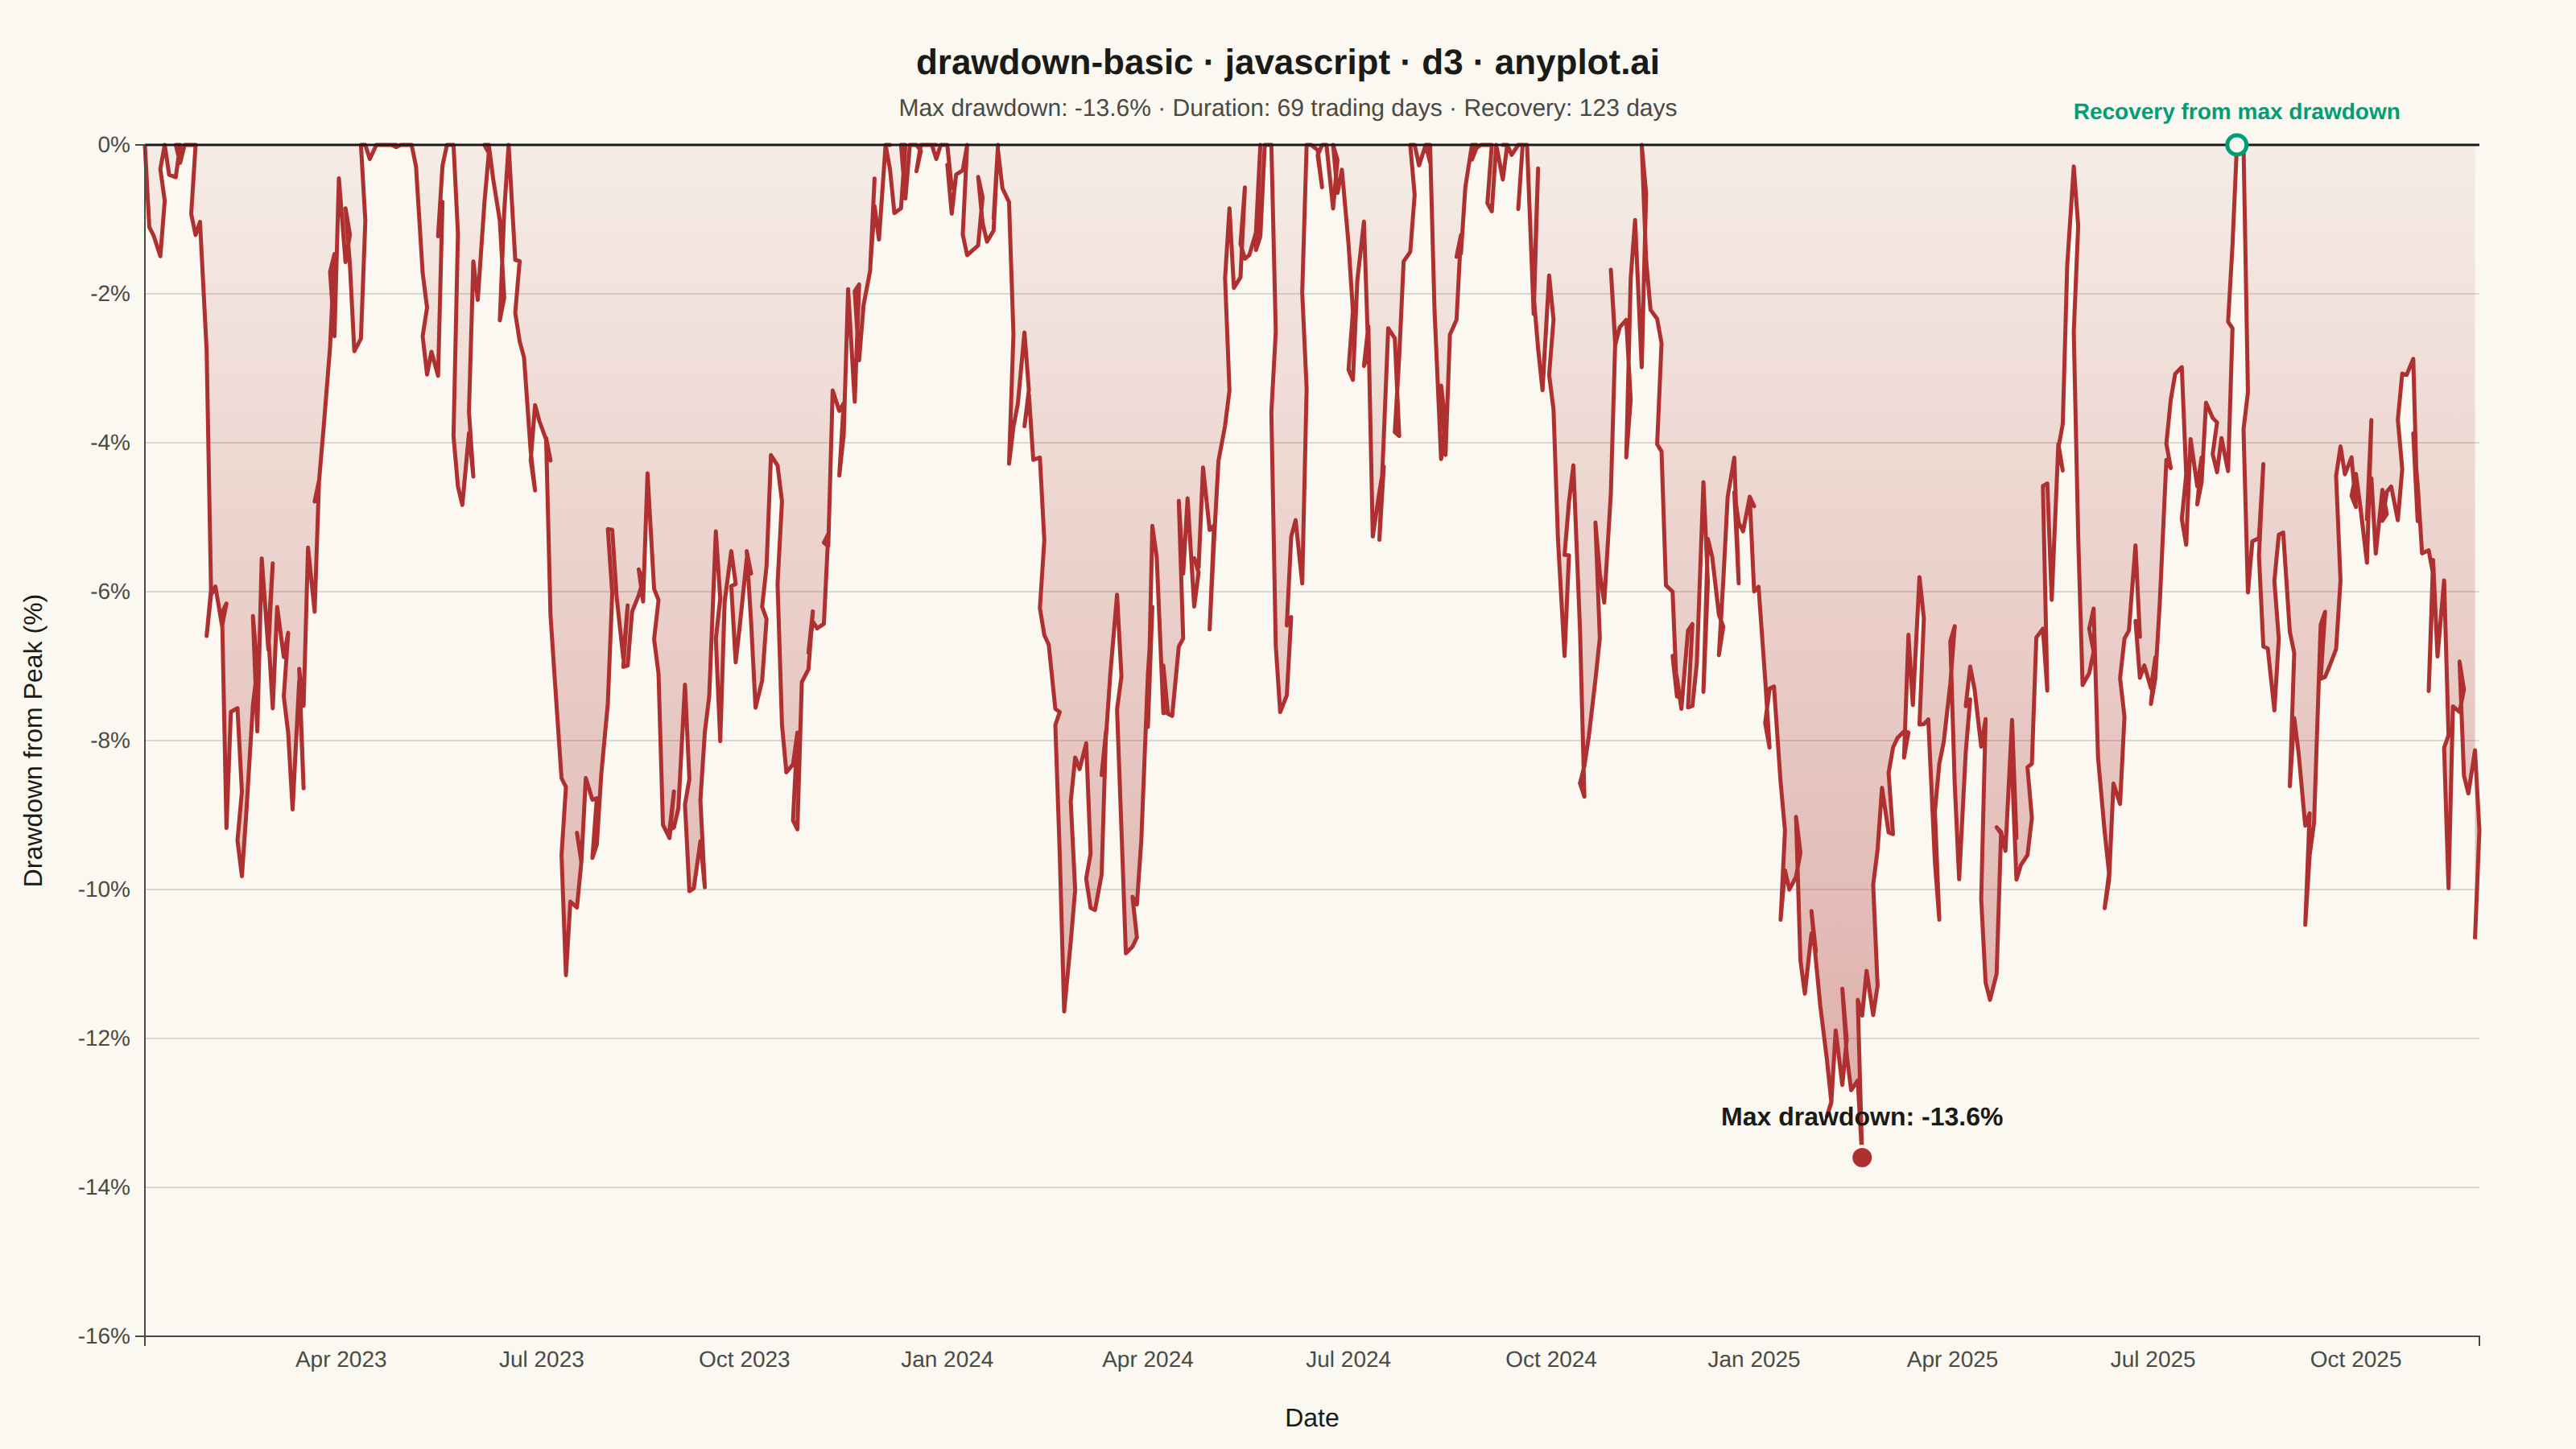
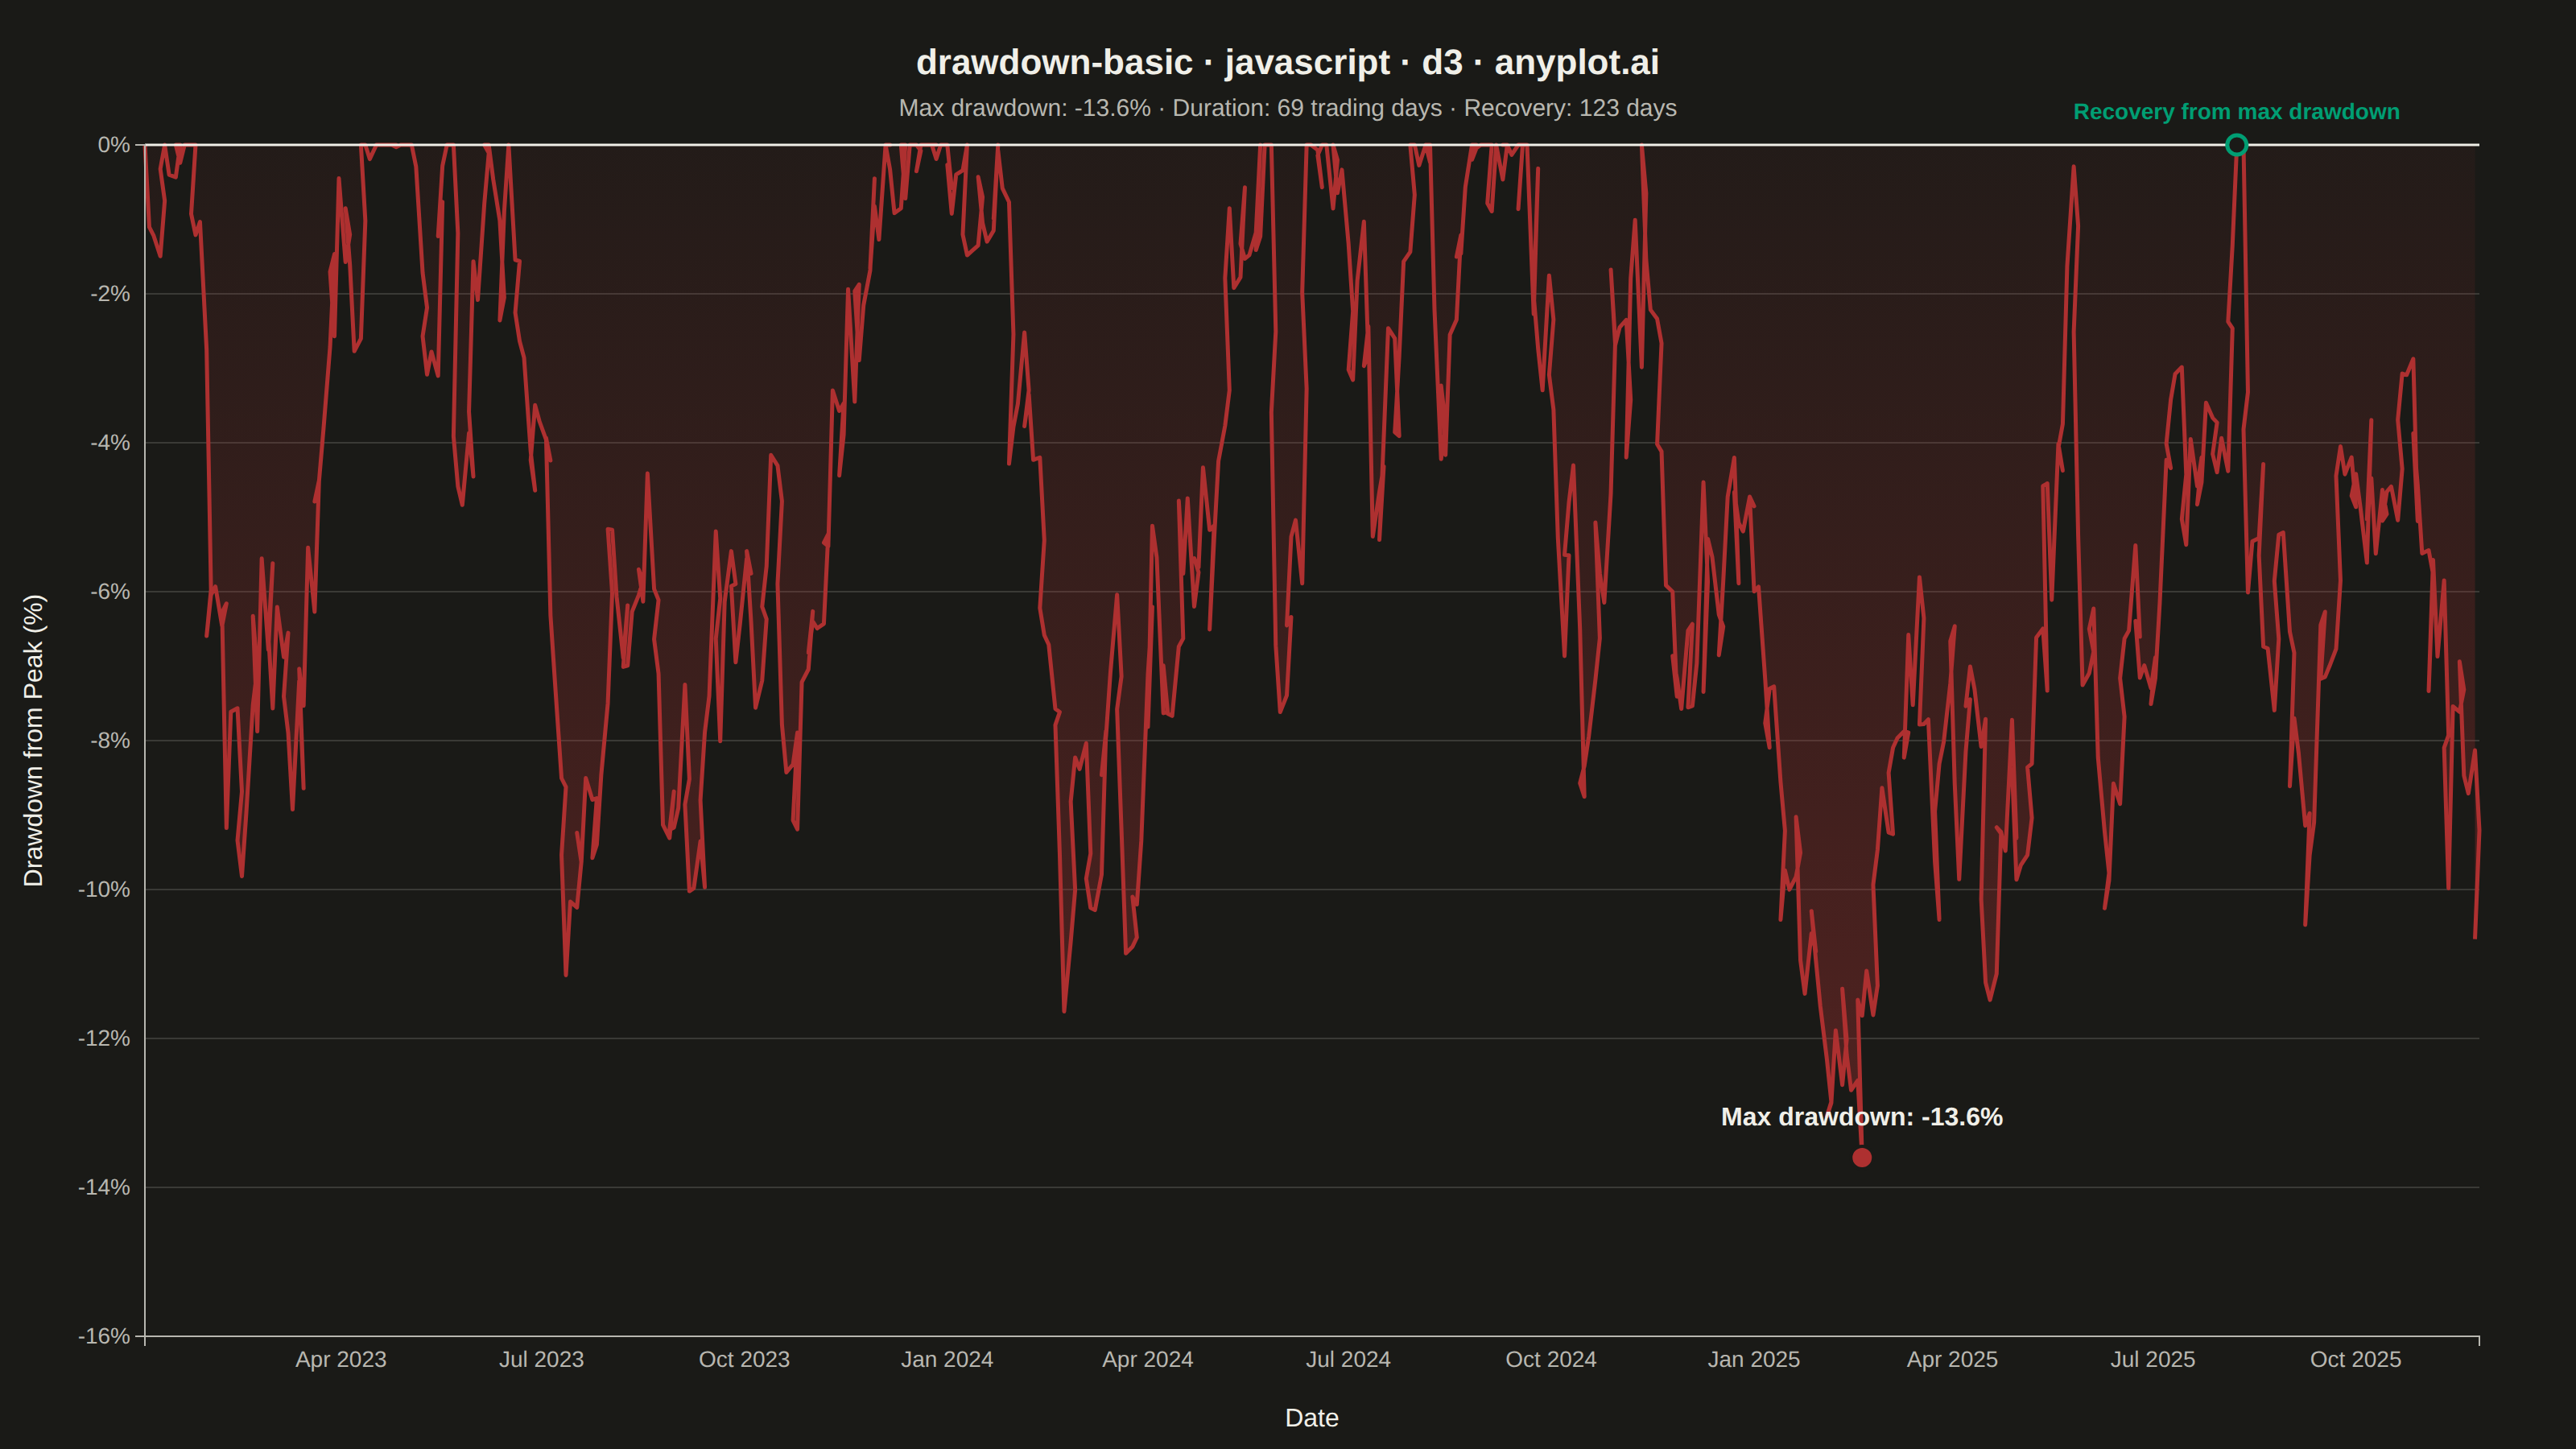
The same plot in 14 other libraries — JavaScript: Chart.js, Apache ECharts, Highcharts, MUI X Charts; Python: Altair, Bokeh, lets-plot, Matplotlib, Plotly, plotnine, Pygal, Seaborn; R: ggplot2; Julia: Makie.jl. Compare all 15 side by side: Drawdown Chart in Python, R, Julia and JavaScript.
A drawdown chart visualizes the percentage decline from peak value over time, showing how far an investment or asset has fallen from its highest point. This chart is essential for risk assessment and understanding the magnitude of losses during unfavorable market periods. The filled area below the zero line emphasizes the depth and duration of drawdowns, making it easy to identify maximum drawdown periods and recovery points.
// anyplot.ai
// drawdown-basic: Drawdown Chart
// Library: d3 7.9.0 | JavaScript 22.23.2
// Quality: 90/100 | Created: 2026-08-24

const t = window.ANYPLOT_TOKENS;
const { width, height } = window.ANYPLOT_SIZE;
const margin = { top: 90, right: 60, bottom: 70, left: 90 };
const iw = width - margin.left - margin.right;
const ih = height - margin.top - margin.bottom;

// --- Data (in-memory, deterministic fixed-seed LCG) -------------------------
let seed = 42;
function rand() {
  seed = (seed * 1103515245 + 12345) & 0x7fffffff;
  return seed / 0x7fffffff;
}
function gaussian() {
  const u1 = Math.max(rand(), 1e-9);
  const u2 = rand();
  return Math.sqrt(-2 * Math.log(u1)) * Math.cos(2 * Math.PI * u2);
}

const N_DAYS = 756; // ~3 years of trading days
const START_DATE = new Date(2023, 0, 2);
const dailyDrift = 0.0003;
const dailyVol = 0.011;

const dates = [];
const values = [];
let nav = 100;
for (let i = 0; i < N_DAYS; i++) {
  const day = new Date(START_DATE);
  day.setDate(day.getDate() + Math.floor((i / 5) * 7) + (i % 5));
  dates.push(day);
  if (i > 0) nav *= 1 + dailyDrift + dailyVol * gaussian();
  values.push(nav);
}

// Drawdown as percentage decline from the running maximum.
let runningMax = values[0];
const drawdowns = values.map((v) => {
  runningMax = Math.max(runningMax, v);
  return ((v - runningMax) / runningMax) * 100;
});

// Maximum drawdown: the trough with the deepest decline.
let troughIdx = 0;
for (let i = 1; i < drawdowns.length; i++) {
  if (drawdowns[i] < drawdowns[troughIdx]) troughIdx = i;
}
// Peak preceding the trough (last point where drawdown was ~0 before the trough).
let peakIdx = troughIdx;
for (let i = troughIdx; i >= 0; i--) {
  if (drawdowns[i] >= -1e-9) {
    peakIdx = i;
    break;
  }
  peakIdx = i;
}
// Recovery: first point after the trough where drawdown returns to zero.
let recoveryIdx = -1;
for (let i = troughIdx; i < drawdowns.length; i++) {
  if (drawdowns[i] >= -1e-9) {
    recoveryIdx = i;
    break;
  }
}

const data = dates.map((date, i) => ({ date, drawdown: drawdowns[i] }));

// Key statistics required by spec: max drawdown %, duration, and recovery time.
const maxDDDuration = troughIdx - peakIdx;
const recoveryTime = recoveryIdx >= 0 ? recoveryIdx - troughIdx : null;

// --- Scales -------------------------------------------------------------------
const x = d3
  .scaleTime()
  .domain(d3.extent(data, (d) => d.date))
  .range([0, iw]);
const y = d3
  .scaleLinear()
  .domain([d3.min(drawdowns) * 1.15, 0])
  .nice()
  .range([ih, 0]);

// --- SVG mount ----------------------------------------------------------------
const svg = d3.select("#container").append("svg").attr("width", width).attr("height", height);
const g = svg.append("g").attr("transform", `translate(${margin.left},${margin.top})`);

// --- Y gridlines (drawdown %) --------------------------------------------------
g.append("g")
  .selectAll("line")
  .data(y.ticks(6))
  .join("line")
  .attr("x1", 0)
  .attr("x2", iw)
  .attr("y1", (d) => y(d))
  .attr("y2", (d) => y(d))
  .attr("stroke", t.grid)
  .attr("stroke-width", 1);

// --- Drawdown area fill (semi-transparent loss red, fading toward zero) -------
svg
  .append("defs")
  .append("linearGradient")
  .attr("id", "drawdown-fill-gradient")
  .attr("x1", "0%")
  .attr("y1", "0%")
  .attr("x2", "0%")
  .attr("y2", "100%")
  .call((gradient) => {
    gradient.append("stop").attr("offset", "0%").attr("stop-color", t.palette[4]).attr("stop-opacity", 0.06);
    gradient.append("stop").attr("offset", "100%").attr("stop-color", t.palette[4]).attr("stop-opacity", 0.38);
  });

const area = d3
  .area()
  .x((d) => x(d.date))
  .y0(y(0))
  .y1((d) => y(d.drawdown))
  .curve(d3.curveLinear);

g.append("path").datum(data).attr("d", area).attr("fill", "url(#drawdown-fill-gradient)");

// --- Drawdown line --------------------------------------------------------------
const line = d3
  .line()
  .x((d) => x(d.date))
  .y((d) => y(d.drawdown))
  .curve(d3.curveLinear);

g.append("path")
  .datum(data)
  .attr("d", line)
  .attr("fill", "none")
  .attr("stroke", t.palette[4])
  .attr("stroke-width", 2.5)
  .attr("stroke-linejoin", "round");

// --- Zero baseline --------------------------------------------------------------
g.append("line")
  .attr("x1", 0)
  .attr("x2", iw)
  .attr("y1", y(0))
  .attr("y2", y(0))
  .attr("stroke", t.ink)
  .attr("stroke-width", 1.5);

// --- Recovery marker (new-high crossing back through zero) ----------------------
if (recoveryIdx >= 0) {
  g.append("circle")
    .attr("cx", x(data[recoveryIdx].date))
    .attr("cy", y(0))
    .attr("r", 6)
    .attr("fill", t.pageBg)
    .attr("stroke", t.palette[0])
    .attr("stroke-width", 2.5);

  g.append("text")
    .attr("x", x(data[recoveryIdx].date))
    .attr("y", y(0) - 16)
    .attr("text-anchor", "middle")
    .attr("fill", t.palette[0])
    .style("font-size", "14px")
    .style("font-weight", "600")
    .text("Recovery from max drawdown");
}

// --- Maximum drawdown marker + annotation ----------------------------------------
g.append("circle")
  .attr("cx", x(data[troughIdx].date))
  .attr("cy", y(drawdowns[troughIdx]))
  .attr("r", 7)
  .attr("fill", t.palette[4])
  .attr("stroke", t.pageBg)
  .attr("stroke-width", 2);

const troughLabel = g.append("g").attr("transform", `translate(${x(data[troughIdx].date)},${y(drawdowns[troughIdx])})`);
const labelBelow = y(drawdowns[troughIdx]) < ih * 0.35;
const labelDy = labelBelow ? 34 : -20;
troughLabel
  .append("text")
  .attr("x", 0)
  .attr("y", labelDy)
  .attr("text-anchor", "middle")
  .attr("fill", t.ink)
  .style("font-size", "16px")
  .style("font-weight", "700")
  .text(`Max drawdown: ${drawdowns[troughIdx].toFixed(1)}%`);

// --- Axes ------------------------------------------------------------------------
const xAxis = g
  .append("g")
  .attr("transform", `translate(0,${ih})`)
  .call(d3.axisBottom(x).ticks(8).tickFormat(d3.timeFormat("%b %Y")));
const yAxis = g.append("g").call(d3.axisLeft(y).ticks(6).tickFormat((d) => `${d}%`));

for (const ax of [xAxis, yAxis]) {
  ax.selectAll("text").attr("fill", t.inkSoft).style("font-size", "14px");
  ax.selectAll("line").attr("stroke", t.grid);
  ax.select(".domain").attr("stroke", t.inkSoft);
}
xAxis.selectAll(".tick line").remove();
yAxis.selectAll(".tick line").remove();

// --- Axis labels -------------------------------------------------------------------
g.append("text")
  .attr("x", iw / 2)
  .attr("y", ih + 56)
  .attr("text-anchor", "middle")
  .attr("fill", t.ink)
  .style("font-size", "16px")
  .text("Date");

g.append("text")
  .attr("transform", "rotate(-90)")
  .attr("x", -ih / 2)
  .attr("y", -64)
  .attr("text-anchor", "middle")
  .attr("fill", t.ink)
  .style("font-size", "16px")
  .text("Drawdown from Peak (%)");

// --- Title ----------------------------------------------------------------------
svg
  .append("text")
  .attr("x", width / 2)
  .attr("y", 46)
  .attr("text-anchor", "middle")
  .attr("fill", t.ink)
  .style("font-size", "22px")
  .style("font-weight", "600")
  .text("drawdown-basic · javascript · d3 · anyplot.ai");

// --- Key statistics callout (spec-required: max DD %, duration, recovery time) ---
const recoveryText = recoveryTime !== null ? `${recoveryTime} days` : "not yet recovered";
svg
  .append("text")
  .attr("x", width / 2)
  .attr("y", 72)
  .attr("text-anchor", "middle")
  .attr("fill", t.inkSoft)
  .style("font-size", "15px")
  .text(
    `Max drawdown: ${drawdowns[troughIdx].toFixed(1)}%  ·  Duration: ${maxDDDuration} trading days  ·  Recovery: ${recoveryText}`,
  );
Runnable source as JSON, for any HTTP client: https://api.anyplot.ai/specs/drawdown-basic/d3/code. Any spec id and library id listed in llms-full.txt fit the same URL shape; every URL below is complete and callable.
{
  "spec_id": "drawdown-basic",
  "language": "javascript",
  "library": "d3",
  "page": "https://anyplot.ai/drawdown-basic/javascript/d3",
  "hub": "https://anyplot.ai/drawdown-basic",
  "code_json": "https://api.anyplot.ai/specs/drawdown-basic/d3/code",
  "spec_json": "https://api.anyplot.ai/specs/drawdown-basic",
  "render_light_png": "https://storage.googleapis.com/anyplot-images/plots/drawdown-basic/javascript/d3/plot-light.png",
  "render_dark_png": "https://storage.googleapis.com/anyplot-images/plots/drawdown-basic/javascript/d3/plot-dark.png",
  "interactive_light_html": "https://storage.googleapis.com/anyplot-images/plots/drawdown-basic/javascript/d3/plot-light.html",
  "interactive_dark_html": "https://storage.googleapis.com/anyplot-images/plots/drawdown-basic/javascript/d3/plot-dark.html",
  "quality_score": 90.0,
  "license": "MIT",
  "guide": "https://anyplot.ai/llms.txt"
}
Part of Drawdown Chart on anyplot.ai.