The same plot in 14 other libraries — JavaScript: Chart.js, D3.js, Apache ECharts, Highcharts; Python: Altair, Bokeh, lets-plot, Matplotlib, Plotly, plotnine, Pygal, Seaborn; R: ggplot2; Julia: Makie.jl. Compare all 15 side by side: Drawdown Chart in Python, R, Julia and JavaScript.
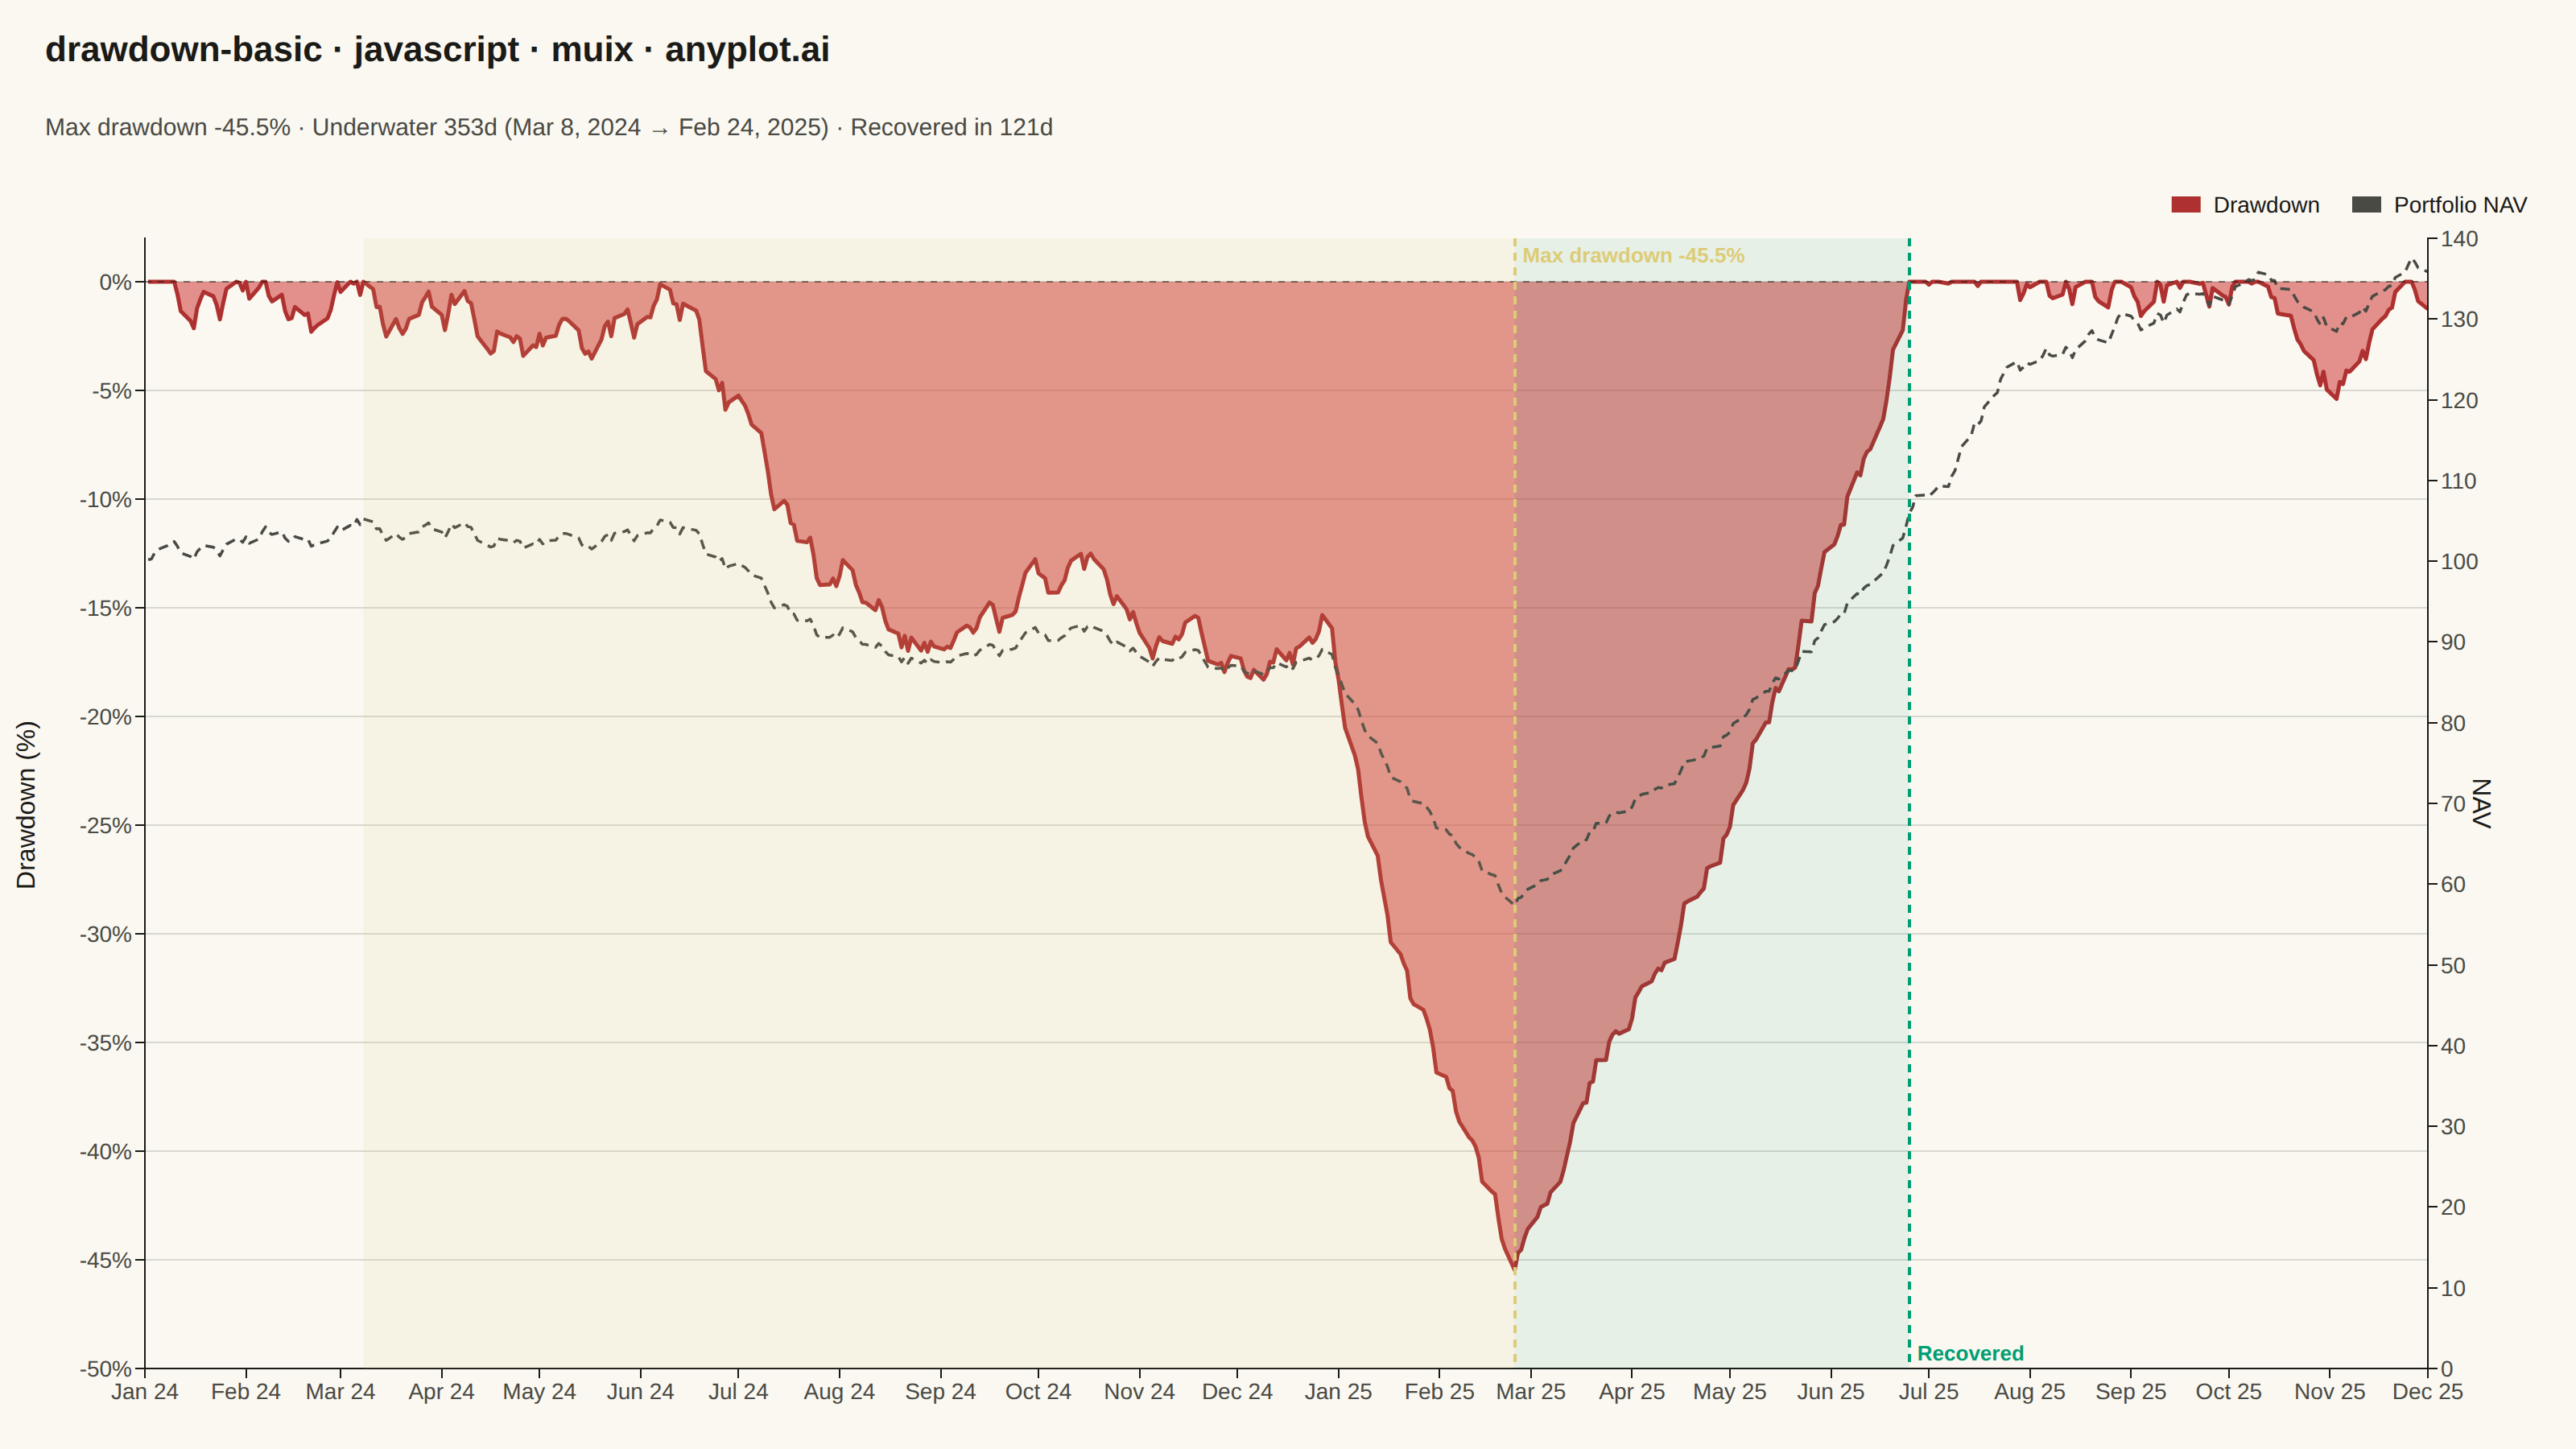
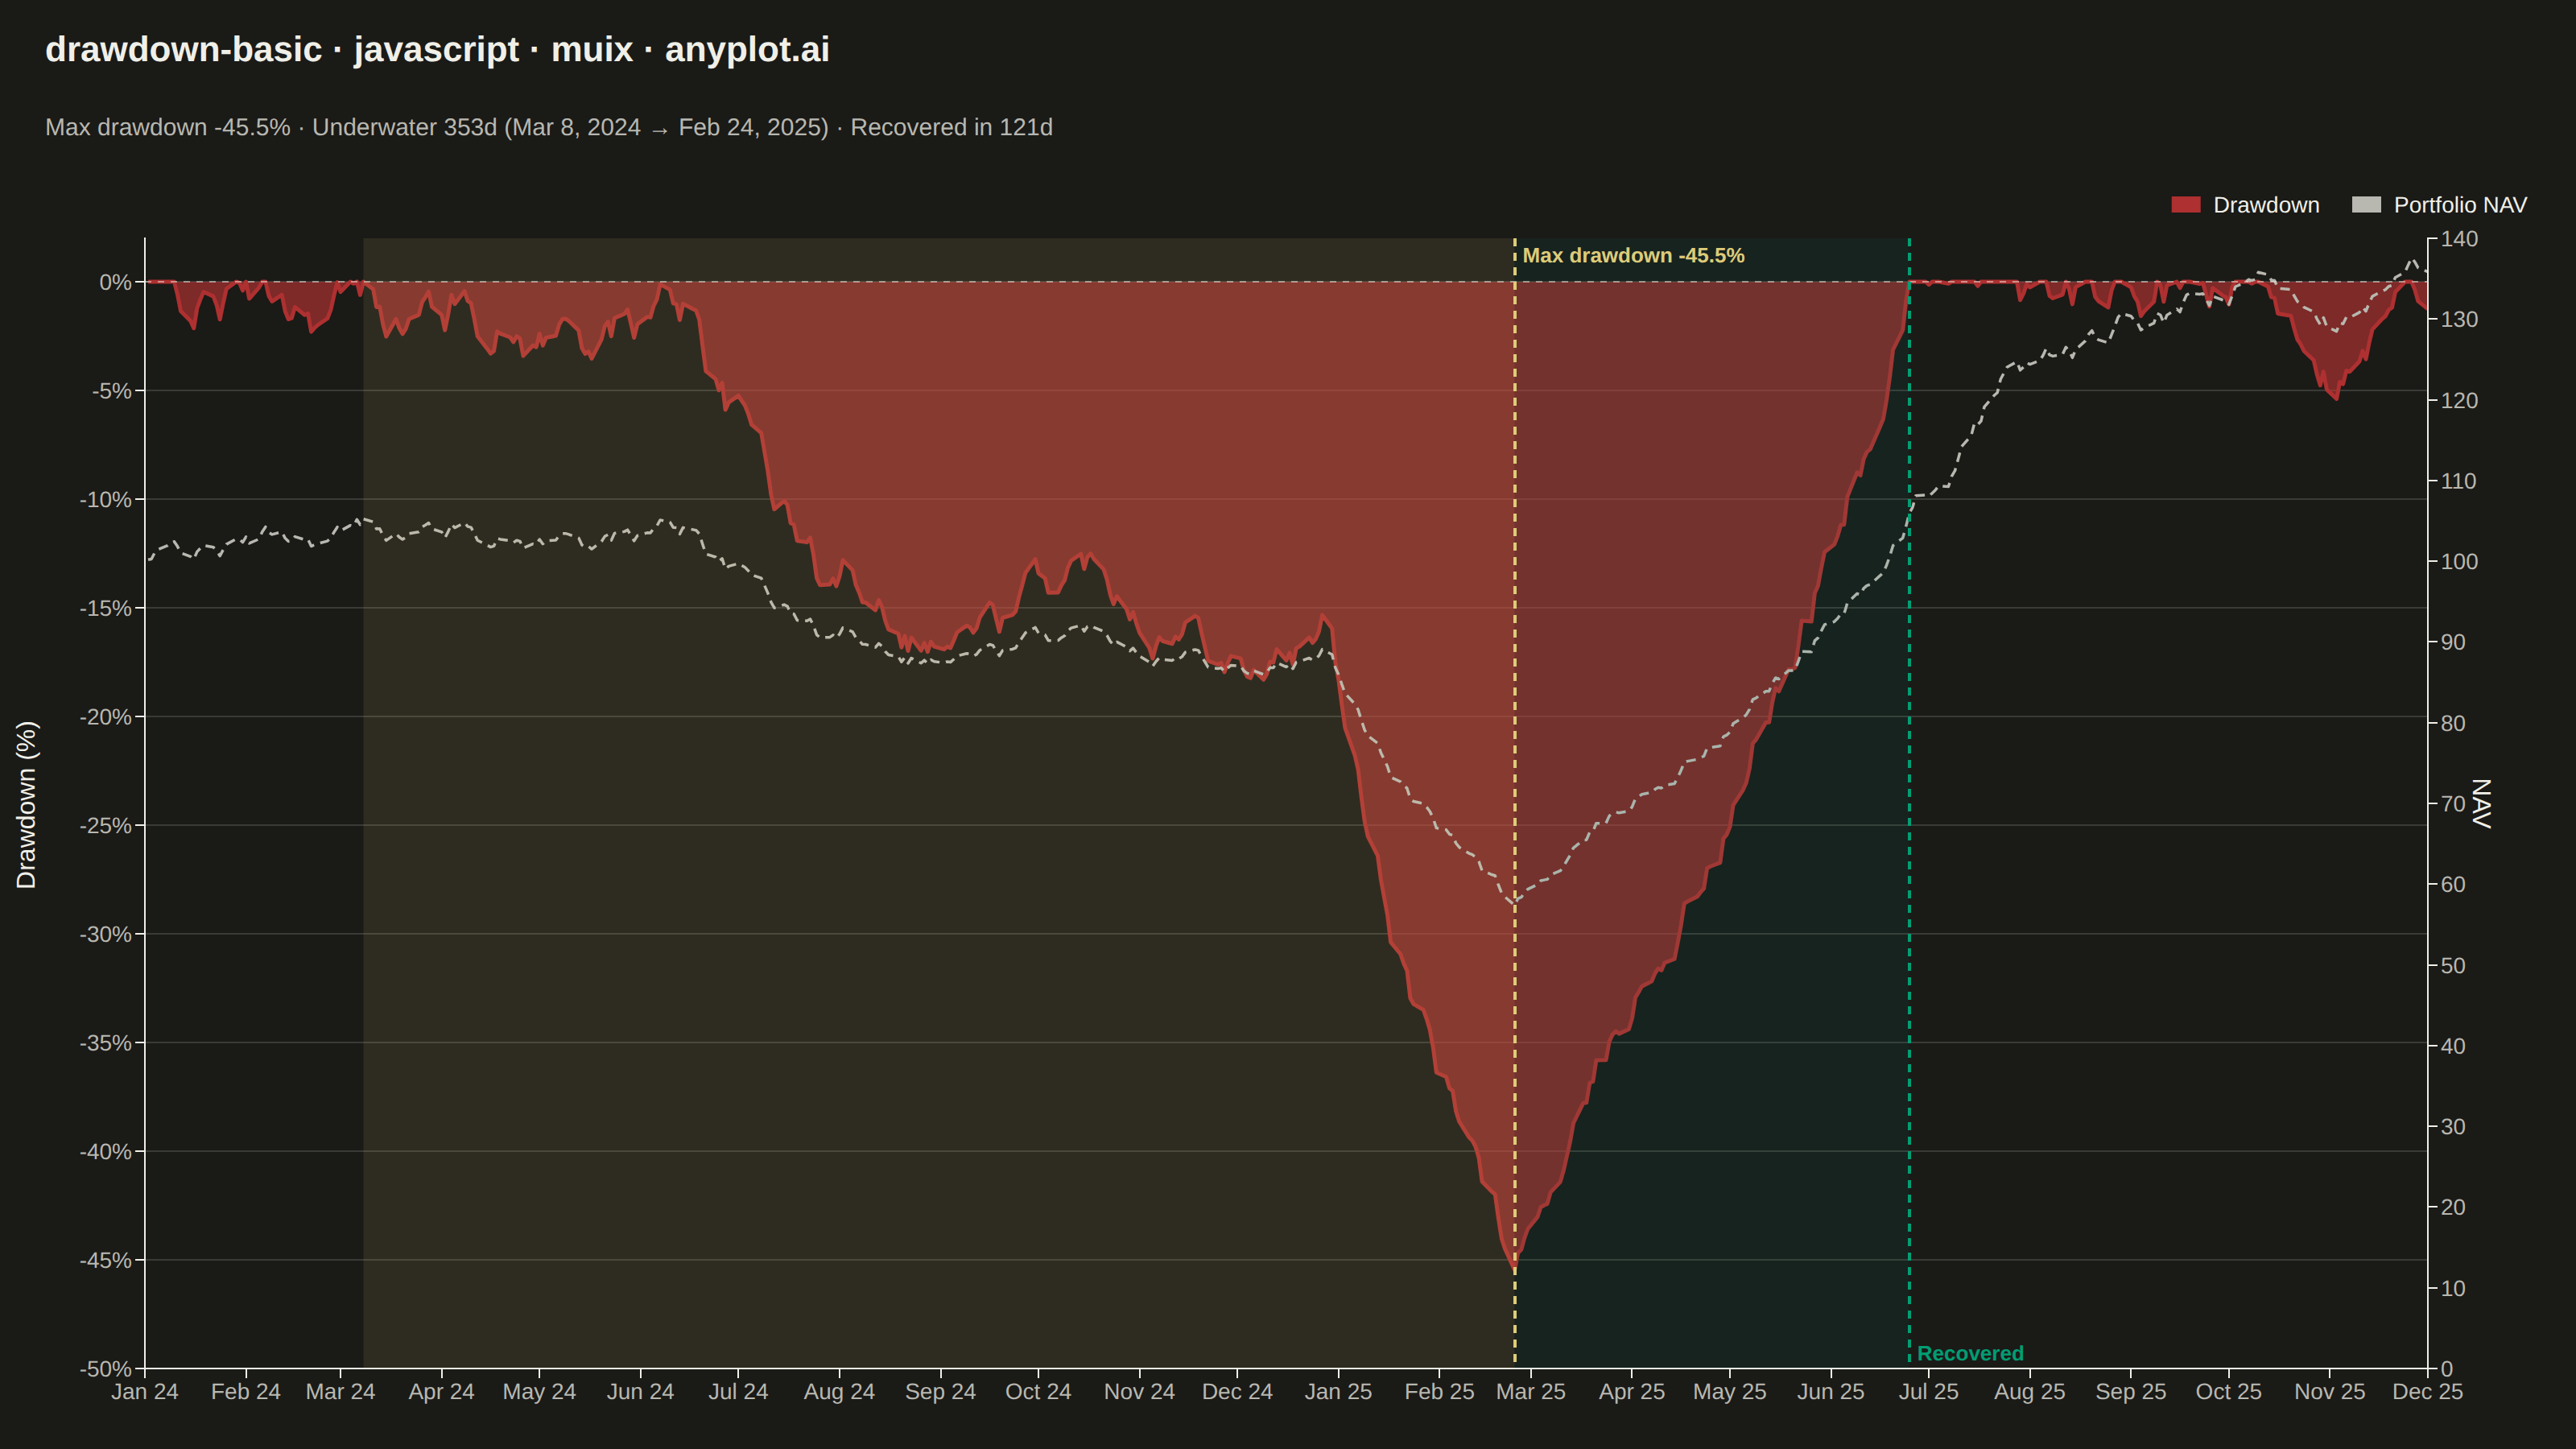
A drawdown chart visualizes the percentage decline from peak value over time, showing how far an investment or asset has fallen from its highest point. This chart is essential for risk assessment and understanding the magnitude of losses during unfavorable market periods. The filled area below the zero line emphasizes the depth and duration of drawdowns, making it easy to identify maximum drawdown periods and recovery points.
// anyplot.ai
// drawdown-basic: Drawdown Chart
// Library: muix 7.29.1 | JavaScript 22.23.2
// Quality: 93/100 | Created: 2026-08-24
import { LineChart } from "@mui/x-charts/LineChart";
import { ChartsReferenceLine } from "@mui/x-charts/ChartsReferenceLine";
import { useXScale, useDrawingArea } from "@mui/x-charts/hooks";
import { Box, Typography } from "@mui/material";

const t = window.ANYPLOT_TOKENS;

// --- Data (in-memory, deterministic) ----------------------------------------
// Simulated portfolio NAV: ~2 years of trading days (weekdays only), starting
// at 100 with a small positive drift plus two engineered stress regimes, so
// the drawdown story (decline, trough, recovery) reads unambiguously.
const START_DATE = new Date(2024, 0, 2);
const TRADING_DAYS = 500;

const dates = [];
const cursor = new Date(START_DATE);
while (dates.length < TRADING_DAYS) {
  const weekday = cursor.getDay();
  if (weekday !== 0 && weekday !== 6) dates.push(new Date(cursor));
  cursor.setDate(cursor.getDate() + 1);
}

let lcgState = 42;
const nextRandom = () => {
  lcgState = (lcgState * 1103515245 + 12345) % 2147483648;
  return lcgState / 2147483648;
};

// Regime schedule: calm start -> mild correction -> calm -> sharp bear-market
// crash (the main event) -> strong V-shaped recovery -> calm cruise. This
// keeps the running-max drawdown story unambiguous: one dominant trough that
// fully recovers with runway to spare before the series ends.
const regimeDrift = (i) => {
  if (i < 120) return 0.0004;
  if (i < 150) return -0.0045;
  if (i < 260) return 0.0006;
  if (i < 300) return -0.0105;
  if (i < 410) return 0.0068;
  return 0.0004;
};

let nav = 100;
const navValues = dates.map((_, i) => {
  const dailyShock = (nextRandom() - 0.5) * 0.018;
  nav *= 1 + regimeDrift(i) + dailyShock;
  return nav;
});

let runningPeak = navValues[0];
const drawdownPct = navValues.map((value) => {
  runningPeak = Math.max(runningPeak, value);
  return ((value - runningPeak) / runningPeak) * 100;
});

let troughIdx = 0;
drawdownPct.forEach((value, i) => {
  if (value < drawdownPct[troughIdx]) troughIdx = i;
});

let peakIdx = troughIdx;
for (let i = troughIdx; i >= 0; i -= 1) {
  if (drawdownPct[i] === 0) {
    peakIdx = i;
    break;
  }
}

let recoveryIdx = -1;
for (let i = troughIdx + 1; i < drawdownPct.length; i += 1) {
  if (drawdownPct[i] >= -0.02) {
    recoveryIdx = i;
    break;
  }
}

const DAY_MS = 24 * 60 * 60 * 1000;
const maxDrawdownPct = drawdownPct[troughIdx];
const drawdownDays = Math.round((dates[troughIdx] - dates[peakIdx]) / DAY_MS);
const recoveryDays = recoveryIdx > -1 ? Math.round((dates[recoveryIdx] - dates[troughIdx]) / DAY_MS) : null;

const dateLabel = (date) => date.toLocaleDateString("en-US", { month: "short", day: "numeric", year: "numeric" });

const statsLine =
  `Max drawdown ${maxDrawdownPct.toFixed(1)}% · ` +
  `Underwater ${drawdownDays}d (${dateLabel(dates[peakIdx])} → ${dateLabel(dates[troughIdx])}) · ` +
  (recoveryDays !== null ? `Recovered in ${recoveryDays}d` : "Not yet recovered");

// --- Overlay: shades the peak→trough and trough→recovery windows ---------
function DrawdownWindow({ from, to, color, opacity }) {
  const xScale = useXScale();
  const { top, height } = useDrawingArea();
  const x1 = xScale(from);
  const x2 = xScale(to);
  if (x1 == null || x2 == null) return null;
  return (
    <rect x={Math.min(x1, x2)} y={top} width={Math.abs(x2 - x1)} height={height} fill={color} fillOpacity={opacity} />
  );
}

const TITLE_H = 60;
const STATS_H = 40;
// MUI X's y-axis `label` prop offsets itself from a hardcoded tickFontSize
// guess rather than the tick labels' real measured width, so with "-40%"-style
// negative-percent ticks it collides with the tick numbers. A hand-rotated
// label in its own flex column sidesteps that with predictable spacing.
const Y_LABEL_W = 34;

// --- Chart (default-exported component — the harness mounts it) ------------
export default function Chart() {
  const { width, height } = window.ANYPLOT_SIZE;
  const chartHeight = height - TITLE_H - STATS_H;
  const chartWidth = width - Y_LABEL_W;

  return (
    <Box
      sx={{
        width,
        height,
        bgcolor: t.pageBg,
        boxSizing: "border-box",
        display: "flex",
        flexDirection: "column",
        fontFamily: "'Roboto', 'Helvetica Neue', Arial, sans-serif",
      }}
    >
      <Box sx={{ height: TITLE_H, display: "flex", alignItems: "center", pl: "28px" }}>
        <Typography sx={{ color: t.ink, fontSize: 22, fontWeight: 600 }}>
          drawdown-basic · javascript · muix · anyplot.ai
        </Typography>
      </Box>
      <Box sx={{ height: STATS_H, display: "flex", alignItems: "center", pl: "28px" }}>
        <Typography sx={{ color: t.inkSoft, fontSize: 15 }}>{statsLine}</Typography>
      </Box>

      <Box sx={{ display: "flex", flexDirection: "row", height: chartHeight }}>
        <Box sx={{ width: Y_LABEL_W, display: "flex", alignItems: "center", justifyContent: "center" }}>
          <Typography
            sx={{ fontSize: 16, color: t.ink, whiteSpace: "nowrap", transform: "rotate(-90deg)" }}
          >
            Drawdown (%)
          </Typography>
        </Box>
        <LineChart
          width={chartWidth}
          height={chartHeight}
          skipAnimation
          rightAxis="nav"
          series={[
            {
              id: "drawdown",
              yAxisId: "dd",
              data: drawdownPct,
              label: "Drawdown",
              area: true,
              showMark: false,
              curve: "linear",
              color: t.palette[4],
              valueFormatter: (v) => `${v.toFixed(1)}%`,
            },
            {
              id: "nav",
              yAxisId: "nav",
              data: navValues,
              label: "Portfolio NAV",
              area: false,
              showMark: false,
              curve: "linear",
              color: t.inkSoft,
              valueFormatter: (v) => v.toFixed(1),
            },
          ]}
          xAxis={[
            {
              id: "x",
              data: dates,
              scaleType: "time",
              valueFormatter: (date) => date.toLocaleDateString("en-US", { month: "short", year: "2-digit" }),
              tickLabelStyle: { fontSize: 14, fill: t.inkSoft },
            },
          ]}
          yAxis={[
            {
              id: "dd",
              max: 2,
              valueFormatter: (v) => `${v}%`,
              tickLabelStyle: { fontSize: 14, fill: t.inkSoft },
            },
            {
              id: "nav",
              position: "right",
              label: "NAV",
              tickLabelStyle: { fontSize: 14, fill: t.inkSoft },
              labelStyle: { fontSize: 16, fill: t.ink },
            },
          ]}
          grid={{ horizontal: true }}
          margin={{ top: 48, right: 92, bottom: 50, left: 56 }}
          slotProps={{
            legend: {
              direction: "row",
              position: { vertical: "top", horizontal: "right" },
              labelStyle: { fontSize: 14, fill: t.ink },
              itemMarkWidth: 18,
              itemMarkHeight: 10,
              markGap: 8,
              itemGap: 20,
            },
          }}
          sx={{
            "& .MuiLineElement-series-drawdown": { strokeWidth: 2.5 },
            "& .MuiAreaElement-series-drawdown": { fillOpacity: 0.55 },
            "& .MuiLineElement-series-nav": { strokeWidth: 1.75, strokeDasharray: "6 4" },
            "& .MuiChartsGrid-line": { stroke: t.grid },
          }}
        >
          <DrawdownWindow from={dates[peakIdx]} to={dates[troughIdx]} color={t.amber} opacity={0.1} />
          {recoveryIdx > -1 && (
            <DrawdownWindow from={dates[troughIdx]} to={dates[recoveryIdx]} color={t.palette[0]} opacity={0.08} />
          )}
          <ChartsReferenceLine
            y={0}
            axisId="dd"
            lineStyle={{ stroke: t.ink, strokeDasharray: "4 4", strokeOpacity: 0.5 }}
          />
          <ChartsReferenceLine
            x={dates[troughIdx]}
            label={`Max drawdown ${maxDrawdownPct.toFixed(1)}%`}
            labelAlign="start"
            lineStyle={{ stroke: t.amber, strokeWidth: 2, strokeDasharray: "5 4" }}
            labelStyle={{ fill: t.amber, fontSize: 13, fontWeight: 600 }}
          />
          {recoveryIdx > -1 && (
            <ChartsReferenceLine
              x={dates[recoveryIdx]}
              label="Recovered"
              labelAlign="end"
              lineStyle={{ stroke: t.palette[0], strokeWidth: 2, strokeDasharray: "5 4" }}
              labelStyle={{ fill: t.palette[0], fontSize: 13, fontWeight: 600 }}
            />
          )}
        </LineChart>
      </Box>
    </Box>
  );
}
Runnable source as JSON, for any HTTP client: https://api.anyplot.ai/specs/drawdown-basic/muix/code. Any spec id and library id listed in llms-full.txt fit the same URL shape; every URL below is complete and callable.
{
  "spec_id": "drawdown-basic",
  "language": "javascript",
  "library": "muix",
  "page": "https://anyplot.ai/drawdown-basic/javascript/muix",
  "hub": "https://anyplot.ai/drawdown-basic",
  "code_json": "https://api.anyplot.ai/specs/drawdown-basic/muix/code",
  "spec_json": "https://api.anyplot.ai/specs/drawdown-basic",
  "render_light_png": "https://storage.googleapis.com/anyplot-images/plots/drawdown-basic/javascript/muix/plot-light.png",
  "render_dark_png": "https://storage.googleapis.com/anyplot-images/plots/drawdown-basic/javascript/muix/plot-dark.png",
  "interactive_light_html": "https://storage.googleapis.com/anyplot-images/plots/drawdown-basic/javascript/muix/plot-light.html",
  "interactive_dark_html": "https://storage.googleapis.com/anyplot-images/plots/drawdown-basic/javascript/muix/plot-dark.html",
  "quality_score": 93.0,
  "license": "MIT",
  "guide": "https://anyplot.ai/llms.txt"
}
Part of Drawdown Chart on anyplot.ai.